. 2021 Mar 8:8:632302.
doi: 10.3389/fcvm.2021.632302. eCollection 2021.

Multiparametric vs. Inferior Vena Cava-Based Estimation of Right Atrial Pressure

Affiliations

Multiparametric vs. Inferior Vena Cava-Based Estimation of Right Atrial Pressure

Matteo Toma et al. Front Cardiovasc Med. .

Abstract

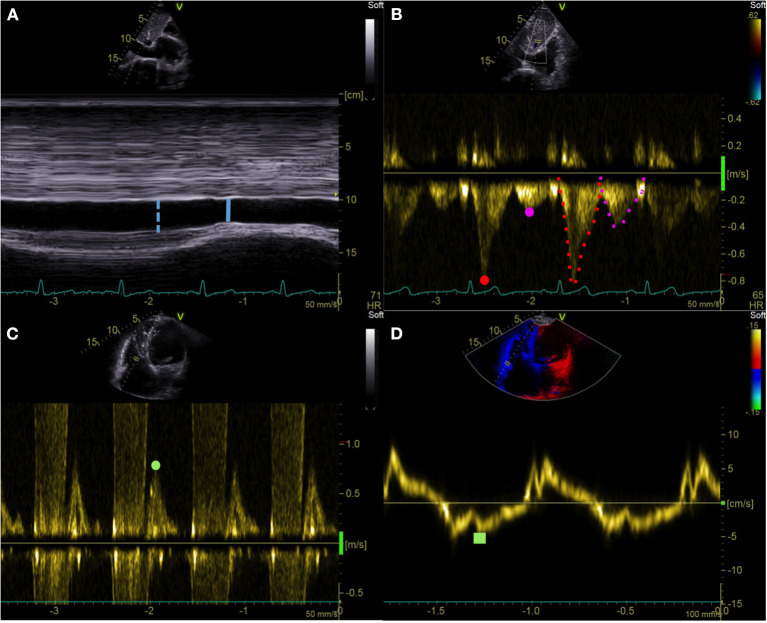
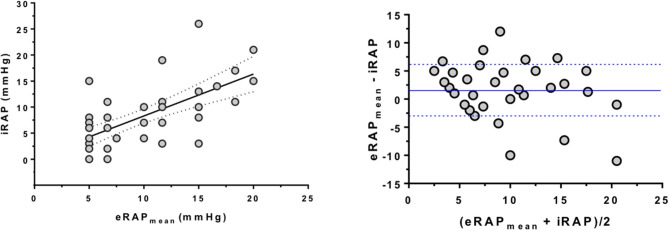
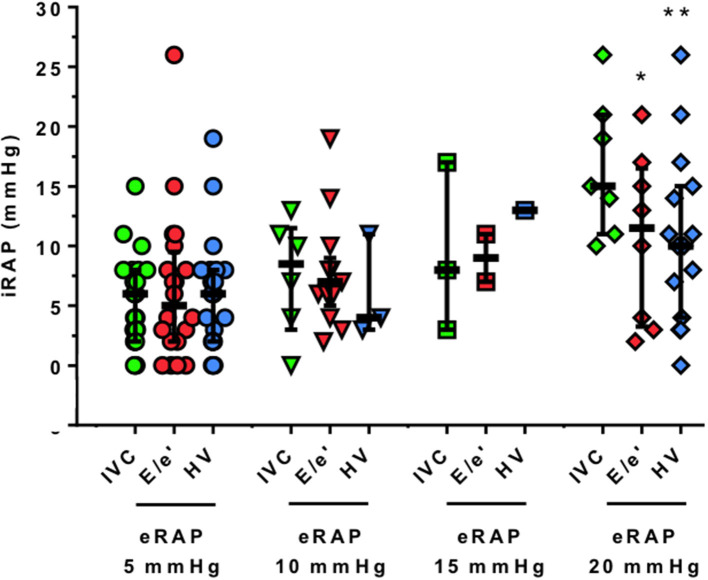
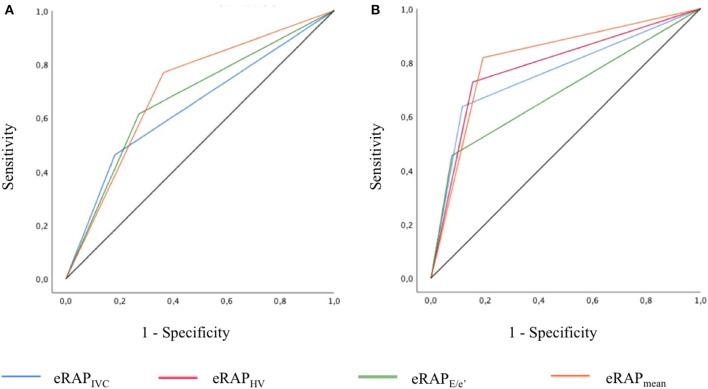
Background: Right atrial pressure (RAP) can be estimated by echocardiography from inferior vena cava diameter and collapsibility (eRAPIVC), tricuspid E/e' ratio ( eRAP E / e ' ), or hepatic vein flow (eRAPHV). The mean of these estimates (eRAPmean) might be more accurate than single assessments. Methods and Results: eRAPIVC, eRAP E / e ' , eRAPHV (categorized in 5, 10, 15, or 20 mmHg), eRAPmean (continuous values) and invasive RAP (iRAP) were obtained in 43 consecutive patients undergoing right heart catheterization [median age 69 (58-75) years, 49% males]. There was a positive correlation between eRAPmean and iRAP (Spearman test r = 0.66, P < 0.001), with Bland-Altman test showing the best agreement for values <10 mmHg. There was also a trend for decreased concordance between eRAPIVC, eRAP E / e ' , eRAPHV, and iRAP across the 5- to 20-mmHg categories, and iRAP was significantly different from eRAP E / e ' and eRAPHV for the 20-mmHg category (Wilcoxon signed-rank test P = 0.02 and P < 0.001, respectively). The areas under the curve in predicting iRAP were nonsignificantly better for eRAPmean than for eRAPIVC at both 5-mmHg [0.64, 95% confidence interval (CI) 0.49-0.80 vs. 0.70, 95% CI 0.53-0.87; Wald test P = 0.41] and 10-mmHg (0.76, 95% CI 0.60-0.92 vs. 0.81, 95% CI 0.67-0.96; P = 0.43) thresholds. Conclusions: Our data suggest that multiparametric eRAPmean does not provide advantage over eRAPIVC, despite being more complex and time-consuming.

Keywords: echocardiograghy; heart failure; pulmonary hypertension; right atrial pressure; right heart catheterization.


Conflict of interest statement

The authors declare that the research was conducted in the absence of any commercial or financial relationships that could be construed as a potential conflict of interest.

Figures

Figure 1
Figure 1
Echocardiographic right atrial pressure estimation. (A) IVC end-expiratory diameter (blue dotted line) and respiratory variation (solid line). (B) HV pulsed wave Doppler assessment: Vs (red dot), Vd (purple dot), VTIs (red dotted line), and VTId (purple dotted line). (C,D) Tricuspid E/e′ ratio: pulsed wave Doppler tricuspid inflow early E-wave peak velocity (green dot) and tricuspid lateral annulus tissue Doppler imaging e′ wave velocity (green square). IVC, inferior vena cava; HV, hepatic vein; Vs, hepatic vein peak systolic velocity; Vd, hepatic vein peak diastolic velocity; VTIs, velocity-time interval of the HV systolic wave; VTId, velocity-time interval of the HV diastolic wave.
Figure 2
Figure 2
Correlation between multiparametric estimation and invasive measurement of right atrial pressure. (Left) Positive correlation between eRAPmean and iRAP as assessed by RHC (Spearman correlation test). (Right) Bland–Altman plot showing that estimation of iRAP by eRAPmean was especially good for values <10 mmHg. The blue lines represent the average ± 1 standard deviation of (eRAPmean and iRAP). Note that in both analyses some subjects had the same values, hence the relevant dots overlap in the graphs. eRAPmean, multiparametric estimated RAP; iRAP, invasive RAP; RHC, right heart catheterization.
Figure 3
Figure 3
Correlation between single-parameter estimation and invasive measurement of right atrial pressure. The actual values of iRAP obtained during RHC are presented for each 5-mmHg threshold and by eRAP component. Horizontal bars indicate medians and interquartile ranges, *P < 0.05 and **P < 0.001, respectively (Wilcoxon signed-rank test). iRAP, invasive right atrial pressure; eRAP, estimated right atrial pressure; IVC, inferior vena cava; E/e′ ratio of pulsed wave Doppler tricuspid inflow early E-wave peak velocity and tricuspid lateral annulus tissue Doppler imaging e′ wave velocity; HV, hepatic veins.
Figure 4
Figure 4
ROC curves showing the accuracy of the different modalities of estimation of right atrial pressure in predicting the actual value, as measured during right heart catheterization, for the 5-mmHg (A) and 10-mmHg (B) thresholds. In (A), the AUC of eRAPIVC and eRAPHV overlap. eRAPIVC, estimated right atrial pressure (eRAP) based on inferior vena cava (IVC) diameter and respiratory variation; eRAPHV, eRAP based on the hepatic vein (HV) pulsed wave Doppler spectra; eRAPE/e', eRAP based on the tricuspid E/e′ ratio; eRAPmean, mean of the different eRAP.

Similar articles

Cited by

References

    1. Galiè N, Humbert M, Vachiery JL, Gibbs S, Lang I, Torbicki A, et al. . 2015 ESC/ERS Guidelines for the diagnosis and treatment of pulmonary hypertension: The Joint Task Force for the Diagnosis and Treatment of Pulmonary Hypertension of the European Society of Cardiology (ESC) and the European Respiratory Society (ERS): Endorsed by: Association for European Paediatric and Congenital Cardiology (AEPC), International Society for Heart and Lung Transplantation (ISHLT). Eur Heart J. 2016 37:67–119. 10.1093/eurheartj/ehv317 - DOI - PubMed
    1. Brinkley DM, Jr, Ho KKL, Drazner MH, Kociol RD. The prognostic value of the relationship between right atrial and pulmonary capillary wedge pressure in diverse cardiovascular conditions. Am Heart J. 2018 199:31–36. 10.1016/j.ahj.2018.01.006 - DOI - PubMed
    1. McCullough SA, Fifer MA, Mohajer P, Lowry PA, Reen CO, Baggish AL, et al. . Clinical Correlates and Prognostic Value of Elevated Right Atrial Pressure in Patients With Hypertrophic Cardiomyopathy. Circ J. 2018 82:1405–11. 10.1253/circj.CJ-17-0959 - DOI - PubMed
    1. van den Bosch AE, Badano LP, Grapsa J. Right ventricle and pulmonary arterial pressure. In: The EACVI Textbook of Echocardiography. Oxford University Press: (2017). p. 171–84.
    1. Moreno FL, Hagan AD, Holmen JR, Pryor TA, Strickland RD, Castle CH. Evaluation of size and dynamics of the inferior vena cava as an index of right-sided cardiac function. Am J Cardiol. 1984 53:579–85. 10.1016/0002-9149(84)90034-1 - DOI - PubMed

LinkOut - more resources