. 2021 Feb 2;6(1):ysab002.
doi: 10.1093/synbio/ysab002. eCollection 2021.

A platform for post-translational spatiotemporal control of cellular proteins

Affiliations

A platform for post-translational spatiotemporal control of cellular proteins

Brianna Jayanthi et al. Synth Biol (Oxf). .

Abstract

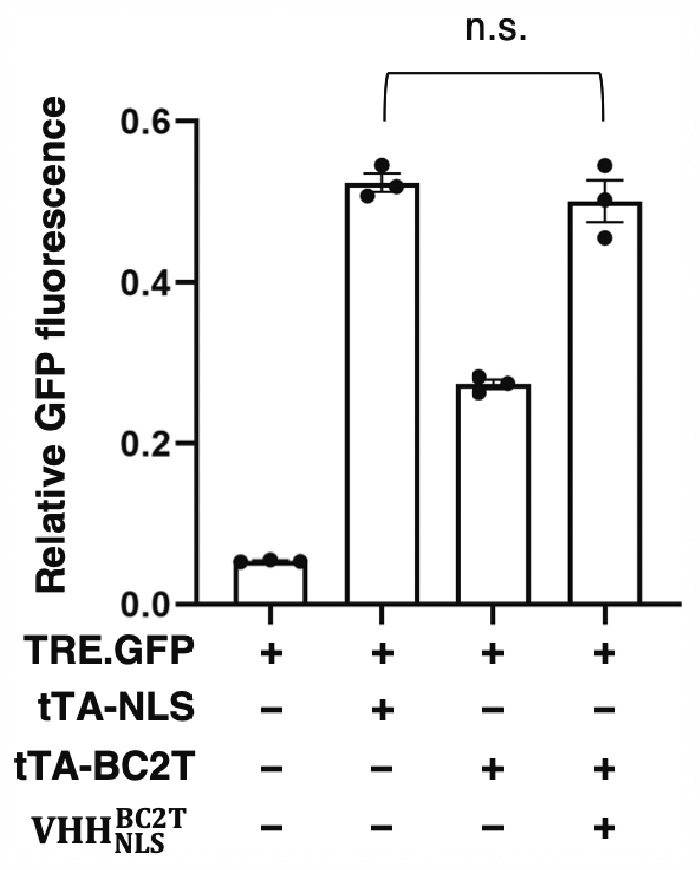
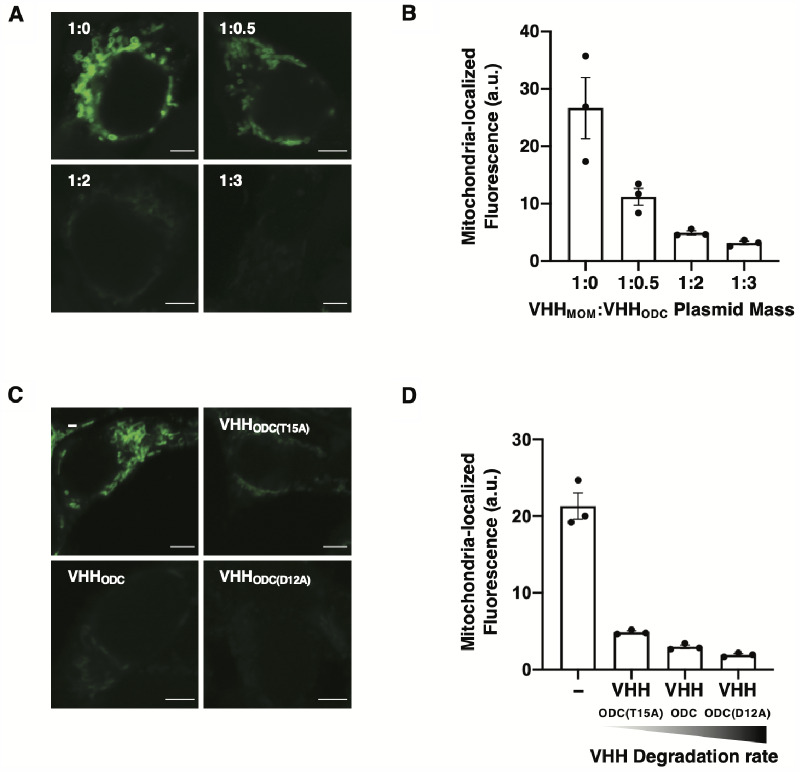
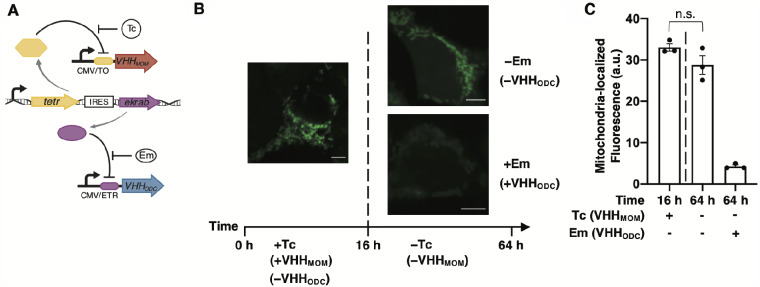
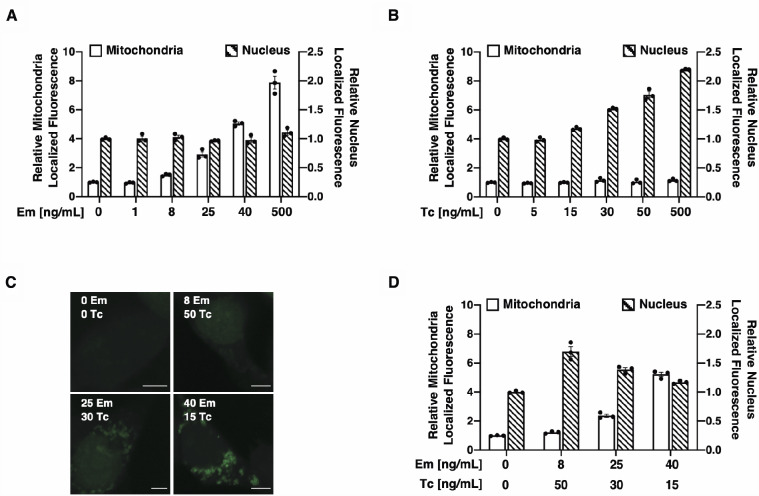
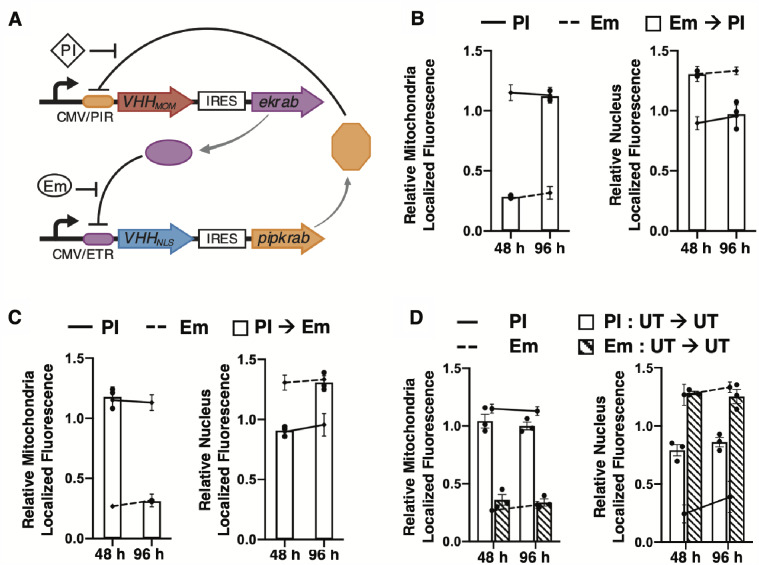
Mammalian cells process information through coordinated spatiotemporal regulation of proteins. Engineering cellular networks thus relies on efficient tools for regulating protein levels in specific subcellular compartments. To address the need to manipulate the extent and dynamics of protein localization, we developed a platform technology for the target-specific control of protein destination. This platform is based on bifunctional molecules comprising a target-specific nanobody and universal sequences determining target subcellular localization or degradation rate. We demonstrate that nanobody-mediated localization depends on the expression level of the target and the nanobody, and the extent of target subcellular localization can be regulated by combining multiple target-specific nanobodies with distinct localization or degradation sequences. We also show that this platform for nanobody-mediated target localization and degradation can be regulated transcriptionally and integrated within orthogonal genetic circuits to achieve the desired temporal control over spatial regulation of target proteins. The platform reported in this study provides an innovative tool to control protein subcellular localization, which will be useful to investigate protein function and regulate large synthetic gene circuits.

Keywords: degradation; localization; mammalian genetic circuits; nanobody; orthogonal protein regulation.


Figures

Figure 1.
Figure 1.
NanoLoc-mediated control of GFP subcellular localization. Representative confocal microscopy images of HEK293/GFP#1 cells transiently transfected for the expression of VHHLoc variants and analyzed 72 h post-transfection. Subcellular compartment (red, column 1); GFP (green, column 2); VHH (blue, anti-HA, column 3); colocalization of subcellular compartment and VHH shown in merged images (purple, column 4); colocalization of GFP and VHH shown in merged images (cyan, column 5); colocalization of subcellular compartment and GFP shown in merged images (yellow, column 6). Scale bars: 5 µm. Brightness and contrast levels were adjusted and images of cells treated the same were subjected to the same adjustment. Pseudo-coloring was applied to the subcellular compartment stain and VHH images for the plasma membrane and the nucleus.
Figure 2.
Figure 2.
Residence time of NanoLoc-mediated GFP subcellular localization. (A) Schematic representation of the NanoLoc platform (left). Expression of VHHLoc is induced upon the addition of Em, which displaces the Em-dependent transrepressor (EKRAB) from the Em operator (ETR). EKRAB is expressed constitutively. Cells were treated with Em for 16 h to induce expression of VHHLoc. Confocal microscopy analyses were initiated at the time of removal of Em (t = 0) from the culturing medium (right). (B) Representative confocal microscopy images of HEK293/GFP2R cells transiently transfected for the expression of VHHLoc variants and induced with Em (500 ng/ml) 8 h post-transfection. Time-course analyses were initiated at the time of Em removal (t = 0 h) and conducted every 24 h for 144 h. Scale bars: 5 µm. Brightness levels were adjusted and images of cells treated the same were subjected to the same adjustment.
Figure 3.
Figure 3.
NanoLoc-mediated control of GFP subcellular localization upon expression of multiple VHHLoc variants. Representative confocal microscopy images of HEK293/GFP#1 cells transiently transfected for the expression of (A) a single VHHLoc variant and (B) two VHHLoc variants using a 1:1 plasmid ratio. Samples were analyzed 72 h post-transfection. Scale bars: 5 µm. Brightness levels were adjusted and images of cells treated the same were subjected to the same adjustment.
Figure 4.
Figure 4.
GFP mitochondrial localization as a function of VHHMOM and GFP expression level. (A) Mitochondria-localized and cytosolic GFP fluorescence of HEK293/GFP#1 cells transiently transfected with plasmid expressing VHHMOM (0–450 ng) and analyzed 72 h post-transfection by confocal microscopy. Mitochondria-localized GFP fluorescence intensity values were obtained by quantifying the GFP signal that co-localizes with the MitoTracker stain. Data are reported as mean ± s.e.m. (n = 3, P <0.05, Student’s t-test, n.s. = not significant). Black dots represent biological replicates. (B) Mitochondria-localized and cytosolic GFP fluorescence of stable HEK293 cell lines presenting low (HEK293/GFP#1), intermediate (HEK293/GFP#2) and high (HEK293/GFP#3) GFP expression levels transiently transfected with plasmid expressing VHHMOM (450 ng). Mitochondria-localized GFP fluorescence intensity values were obtained by quantifying the GFP signal that co-localizes with the MitoTracker stain. Data are reported as mean ± s.e.m. (n = 3, P <0.05, Student’s t-test). Black dots represent the biological replicates.
Figure 5.
Figure 5.
NanoLoc-mediated control of tTA function. GFP expression in HEK293 cells expressing GFP under the control of tTA (TRE.GFP) and either tTA-NLS or tTA-BC2T and VHHNLSBC2T. Relative GFP fluorescence values were obtained by normalizing GFP signal to iRFP signal to correct for differences in transfection efficiency. Data are reported as mean ± s.e.m. (n = 3, P <0.01, Student’s t-test, n.s. = not significant). Black dots represent biological replicates.
Figure 6.
Figure 6.
Modulation of mitochondria-localized GFP fluorescence via nanobody-mediated GFP degradation. (A and B) Confocal microscopy analyses of HEK293/GFP#1 cells transiently transfected for the expression of VHHMOM and VHHODC using VHHMOM:VHHODC plasmid mass ratios of 1:0, 1:0.5, 1:2 and 1:3. A filler plasmid lacking vhh was used to maintain constant total plasmid mass. Images were analyzed 72 h post-transfection. (A) Representative images of mitochondria-localized GFP fluorescence. Scale bars: 5 µm. Brightness levels were adjusted and images of cells treated the same were subjected to the same adjustment. (B) Average mitochondria-localized GFP fluorescence. Fluorescence intensity values were obtained by quantifying the GFP signal that co-localizes with the MitoTracker stain. Data are reported as mean ± s.e.m. (n = 3, P <0.005, Student’s t-test). Black dots represent biological replicates. (C and D) Confocal microscopy analyses of HEK293/GFP#1 cells transiently transfected with a plasmid expressing VHHMOM and a plasmid expressing a VHHODC variant (VHHODC(T15A), half-life 2.1 h; VHHODC, half-life 1.3 h; and VHHODC(D12A), half-life 0.9 h) or lacking vhh in a 1:2 plasmid mass ratio and analyzed 72 h post-transfection. (C) Representative images of mitochondria-localized GFP fluorescence. Scale bars: 5 µm. Brightness levels were adjusted and images of cells treated the same were subjected to the same adjustment. (D) Average mitochondria-localized GFP fluorescence. Fluorescence intensity values were obtained by quantifying the GFP signal that co-localizes with the MitoTracker stain. Data are reported as mean ± s.e.m. (n = 3, P <0.005, Student’s t-test). Black dots represent biological replicates.
Figure 7.
Figure 7.
A dual-input expression system for the temporal control of GFP localization. (A) Schematic representation of the dual-input system to control expression of two VHH variants. The Tc repressor (TetR) and Em-dependent transrepressor (EKRAB) are constitutively expressed from a single promoter. Expression of VHHMOM is repressed by TetR binding to the Tc operator (TO) and induced with Tc. Expression of VHHODC is repressed by EKRAB binding to the Em operator (ETR) and induced with Em. (B and C) Confocal microscopy analyses of HEK293/GFP2R cells transiently transfected with the dual expression systems described in (A) and cultured in the presence of Tc (50 ng/ml) for the first 16 h and then in the presence or absence of Em (500 ng/ml) for an additional 48 h. (B) Representative images of cells at 16 h (Tc treatment, left) and 64 h (right, Em-free media, top; Em-supplemented media, bottom). Scale bars: 5 µm. Brightness levels were adjusted and images of cells treated the same were subjected to the same adjustment. (C) Average mitochondria-localized GFP fluorescence of cells analyzed at 16 h (left of dashed line) and 64 h (right of dashed line) post-transfection. Fluorescence intensity values were obtained by quantifying the GFP signal that co-localizes with the MitoTracker stain. Data are reported as mean ± s.e.m. (n = 3, P <0.01, Student’s t-test). Black dots represent biological replicates.
Figure 8.
Figure 8.
Modulation of GFP localization to different subcellular compartment using a dual-input nanobody expression system. (AD) Mitochondria- and nucleus-localized GFP fluorescence in HEK293/GFP2R cells transiently transfected for the expression of VHHMOM under control of the Em-inducible operator and VHHNLS under control of the Tc-inducible operator, treated with the inducers (Em and Tc) 16 h post-transfection and analyzed after 48 h of induction. (A) GFP fluorescence localized with the mitochondria (white bars) and with the nucleus (striped bars) in transfected cells cultured in the presence of Em (0–500 ng/ml) and in the absence of Tc. Relative fluorescence values were obtained by normalizing the GFP signal that co-localizes with the VHHLoc-specific compartment to the co-localized GFP signal of untreated samples. (B) GFP fluorescence localized with the mitochondria (white bars) and with the nucleus (striped bars) in transfected cells cultured in the presence of Tc (0–500 ng/ml) and in the absence of Em. Relative fluorescence values were obtained as described in (A). (C) Representative images of cells treated with Tc and Em. Scale bars: 5 µm. Brightness levels were adjusted and images of cells treated the same were subjected to the same adjustment. (D) GFP fluorescence localized with the mitochondria (white bars) and with the nucleus (striped bars) in transfected cells cultured in the presence of both Em and Tc. Relative fluorescence values were obtained as described in (A). All data are reported as mean ± s.e.m. (n = 3, P <0.05, Student’s t-test). Black dots represent biological replicates.
Figure 9.
Figure 9.
A synthetic toggle switch to control GFP subcellular localization. (A) Schematic representation of the spatial toggle switch. Expression of VHHMOM is linked to that of EKRAB and expression of VHHNLS is linked to that of PIPKRAB. Expression of VHHMOM and EKRAB is repressed by PIPKRAB binding to the pristinamycin operator (PIR) and induced by PI. Expression of VHHNLS and PIPKRAB is repressed by EKRAB binding to the Em operator (ETR) and induced by Em. (BD) Mitochondria- and nucleus-localized GFP fluorescence of HEK293/GFP#1 cells transiently transfected with plasmids for expression of the spatial toggle switch described in A and analyzed by confocal microscopy. Relative fluorescence values were obtained by normalizing the GFP signal that co-localizes with the VHHLoc-specific compartment to the co-localized GFP signal of untreated samples. (B) Relative localized GFP fluorescence of transfected cells cultured in the presence of PI during transfection to initialize cells to VHHMOM and PIPKRAB expression and then treated with Em (500 ng/ml) for the first 48 h, and with PI (500 ng/ml) for the other 48 h. Cells were analyzed at the end of Em treatment (48 h) and at the end of the PI treatment (96 h). Control cells were treated continuously with PI (solid line) and Em (dashed line). (C) Relative localized GFP fluorescence of transfected cells cultured in the presence of Em during transfection to initialize cells to VHHNLS and EKRAB expression and then treated with PI (500 ng/ml) for the first 48 h, and with Em (500 ng/ml) for other 48 h. Cells were analyzed at the end of PI treatment (48 h) and at the end of Em treatment (96 h). Control cells were treated continuously with PI (solid line) and Em (dashed line). (D) Relative localized GFP fluorescence of transfected cells cultured in the presence of PI (white bars) or of Em (striped bars) during transfection (16 h) and then in inducer-free medium (untreated, UT) for 96 h. Cells were analyzed 48 and 96 h after removal of the inducer. Control cells were treated continuously with PI (solid line) and Em (dashed line). All data are reported as mean ± s.e.m. (n = 3, P <0.05, Student’s t-test). Black dots represent biological replicates.

Similar articles

Cited by

References

    1. Berg J., Tymoczko J., Stryer L. (2002) Biochemistry, 5th edn. W. H. Freeman and Company, New York.
    1. Bauer N.C., Doetsch P.W., Corbett A.H. (2015) Mechanisms regulating protein localization. Traffic, 16, 1039–1061. - PubMed
    1. Coulon A., Chow C.C., Singer R.H., Larson D.R. (2013) Eukaryotic transcriptional dynamics: from single molecules to cell populations. Nat. Rev. Genet., 14, 572–584. - PMC - PubMed
    1. Weake V.M., Workman J.L. (2010) Inducible gene expression: diverse regulatory mechanisms. Nat. Rev. Genet., 11, 426–437. [10.1038/nrg2781]. - PubMed
    1. Lambert S.A., Jolma A., Campitelli L.F., Das P.K., Yin Y., Albu M., Chen X., Taipale J., Hughes T.R., Weirauch M.T. (2018) The human transcription factors. Cell, 172, 650–665. - PubMed

LinkOut - more resources