Clinical Trial
. 2021 Feb 22;2(3):100207.
doi: 10.1016/j.xcrm.2021.100207. eCollection 2021 Mar 16.

Protein/AS01B vaccination elicits stronger, more Th2-skewed antigen-specific human T follicular helper cell responses than heterologous viral vectors

Affiliations
Clinical Trial

Protein/AS01B vaccination elicits stronger, more Th2-skewed antigen-specific human T follicular helper cell responses than heterologous viral vectors

Carolyn M Nielsen et al. Cell Rep Med. .

Abstract

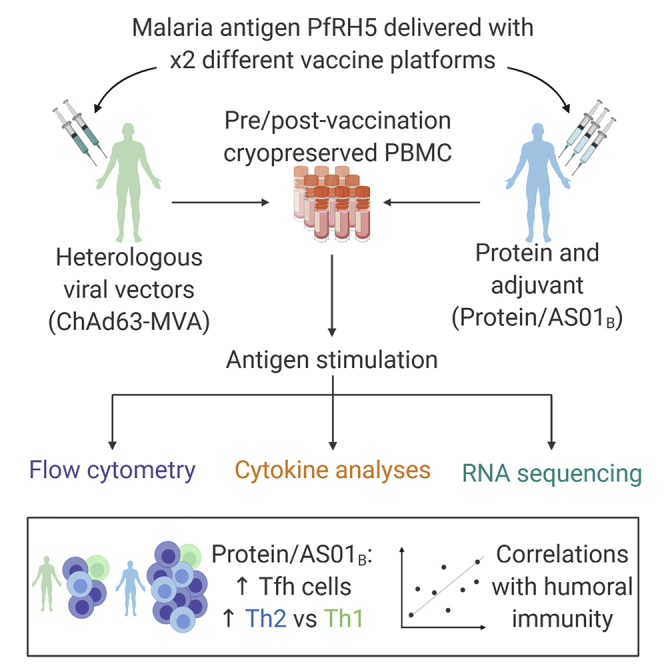
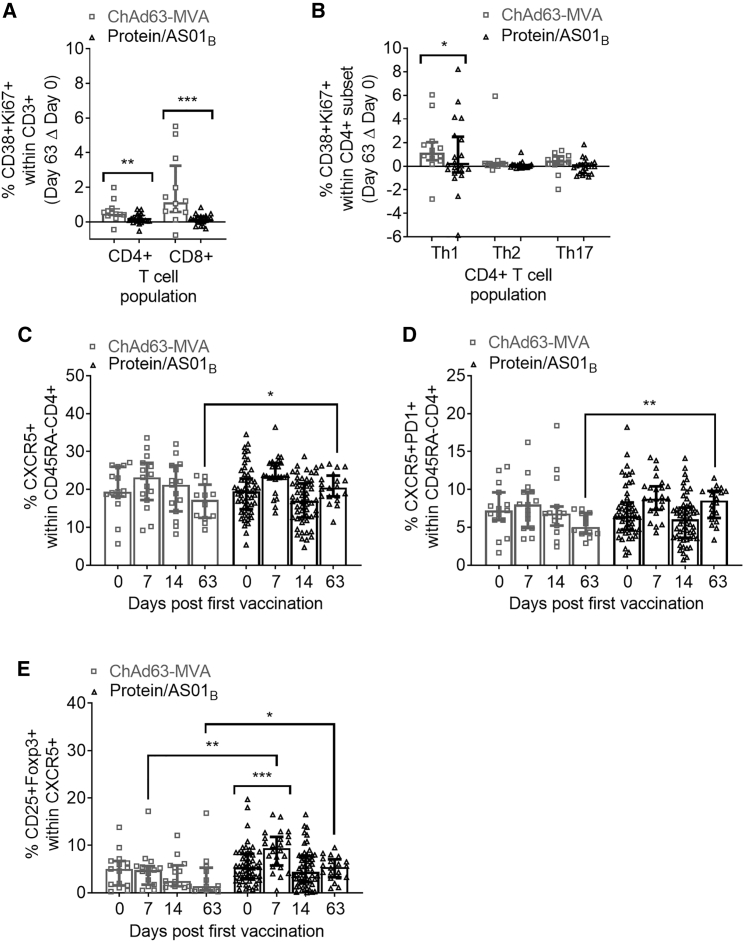
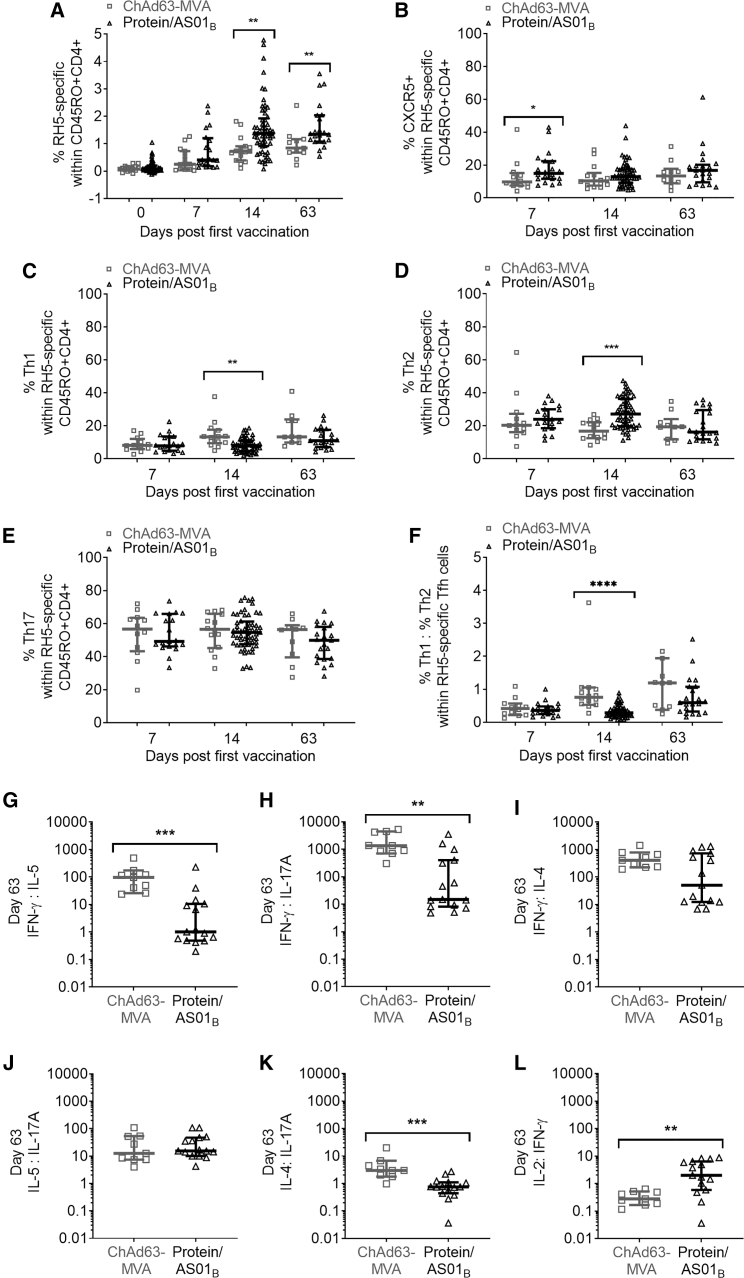
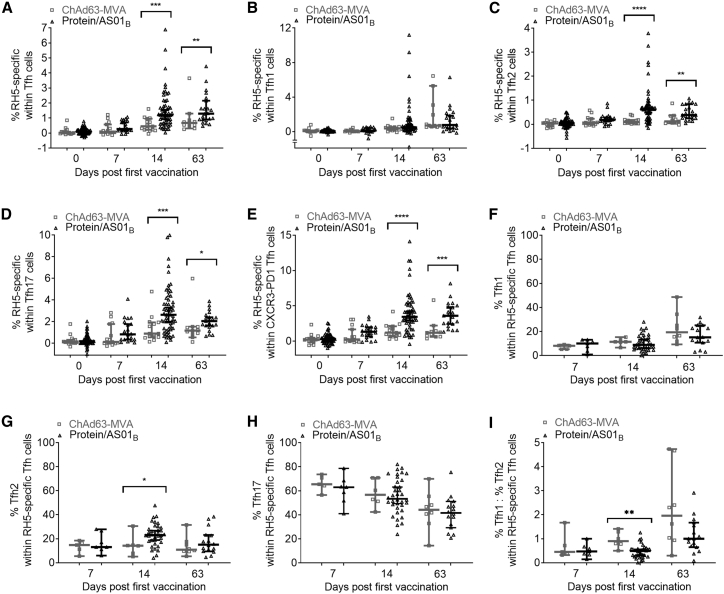
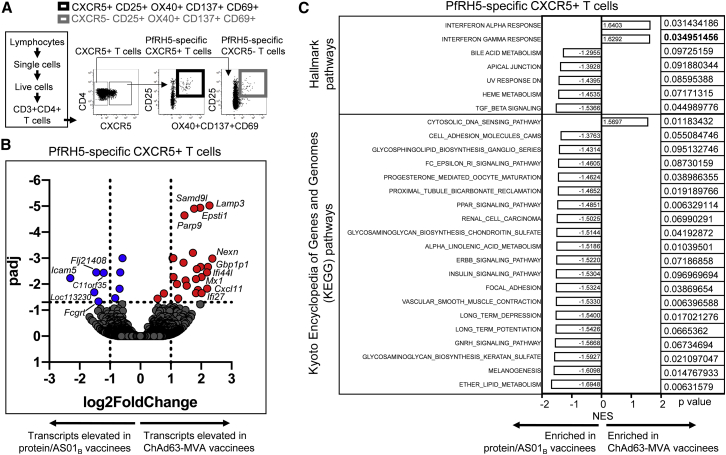
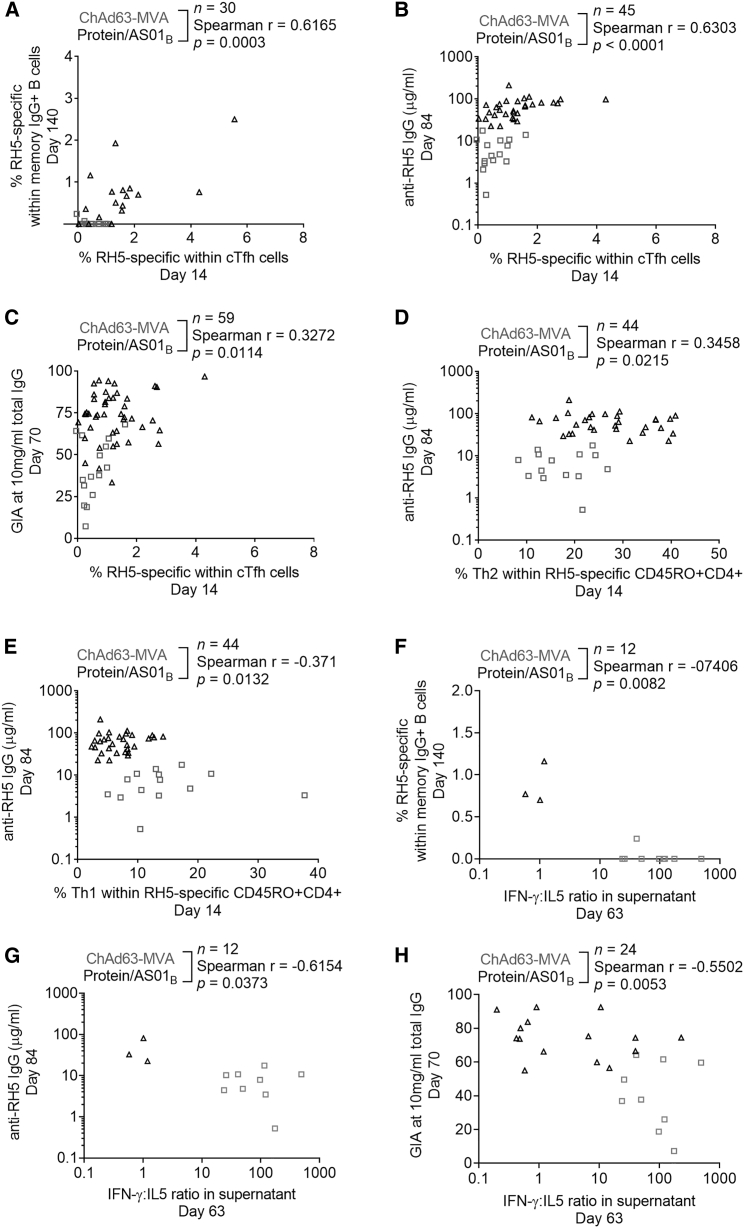
Interactions between B cells and CD4+ T follicular helper (Tfh) cells are key determinants of humoral responses. Using samples from clinical trials performed with the malaria vaccine candidate antigen Plasmodium falciparum merozoite protein (PfRH5), we compare the frequency, phenotype, and gene expression profiles of PfRH5-specific circulating Tfh (cTfh) cells elicited by two leading human vaccine delivery platforms: heterologous viral vector prime boost and protein with AS01B adjuvant. We demonstrate that the protein/AS01B platform induces a higher-magnitude antigen-specific cTfh cell response and that this correlates with peak anti-PfRH5 IgG concentrations, frequency of PfRH5-specific memory B cells, and antibody functionality. Furthermore, our data indicate a greater Th2/Tfh2 skew within the polyfunctional response elicited following vaccination with protein/AS01B as compared to a Th1/Tfh1 skew with viral vectors. These data highlight the impact of vaccine platform on the cTfh cell response driving humoral immunity, associating a high-magnitude, Th2-biased cTfh response with potent antibody production.

Trial registration: ClinicalTrials.gov NCT02927145.

Keywords: AS01; T follicular helper cells; Tfh cells; Th1; Th2; adaptive immunity; antibody; clinical trials; heterologous viral vectors; malaria; vaccines.


Conflict of interest statement

S.J.D. is a named inventor on patent applications relating to PfRH5 and/or other malaria vaccines and immunization regimens. A.M.M. has an immediate family member who is listed as an inventor on patents relating to PfRH5 and/or other malaria vaccines and immunization regimens.

Figures

None
Graphical abstract
Figure 1
Figure 1
PfRH5 vaccination with the ChAd63-MVA platform induces greater activation of total circulating CD8+ and CD4+ T cell populations, while the protein/AS01B platform elicits a more sustained increase in cTfh-phenotype cells PBMCs from days 0, 7, 14, and 63 were stained ex vivo and analyzed using the gating strategies shown in Figures S1–S3. (A and B) Increases at day 63 in activated CD38+Ki67+ cells within total CD8+ and CD4+ T cells (A) or Th1 (CXCR3+CCR6), Th2 (CXCR3CCR6), and Th17 (CXCR3CCR6+) CD4+ T cell subsets (B) were compared between platforms following subtraction of day 0 CD38+Ki67+ frequencies in paired samples. (C–E) Frequencies of total cTfh cells defined as CXCR5+ (C) or CXCR5+PD1+ (D) cells within the CD45RACD4+ T cell population were compared between platforms and the frequency of cTfr cells within total cTfh cells (defined as the CD25+Foxp3+ subset) (E). All of the available samples are plotted (ChAd63-MVA/protein/AS01B): day 0, n = 15/54; day 7, n = 15/24; day 14, n = 15/54; day 63, n = 12/20. For intra-trial comparisons (E), only vaccinees with all 4 time points were analyzed: ChAd63-MVA, n = 12, protein/AS01B, n = 17. Comparisons were performed with Mann-Whitney tests (between trials) or Friedman tests with Dunn’s correction for multiple comparisons (within trials comparing day 0 to post-vaccination time points). ∗p < 0.5, ∗∗p < 0.01, and ∗∗∗p < 0.001. In all of the panels, each point represents a vaccinee. Bars and lines denote medians and interquartile ranges, respectively.
Figure 2
Figure 2
Protein/AS01B platform induces a more robust and Th2-skewed PfRH5-specific CD4+ response than ChAd63-MVA vaccination PBMCs from days 0, 7, 14, and 63 were stimulated with medium alone or a PfRH5 peptide pool for 24 h, then stained and analyzed, identifying PfRH5-specific cells as those co-expressing CD25 with OX40, CD137, or CD69 following stimulation. Frequencies of CXCR5+ (cTfh cells), Th1 (CXCR3+CCR6), Th2 (CXCR3CCR6), and Th17 (CXCR3CCR6+) were also quantified within RH5-specific CD4+CD45RO+ cells (all gating as in Figure S4). (A) Frequencies of PfRH5-specific cells within CD45RO+CD4+ T cells were compared between each time point between trials. (B–F) Within the PfRH5-specific CD45RO+CD4+ T cell population, the proportion of cells that were CXCR5+ cTfh (B), CXCR3+CCR6 (Th1) (C), CXCR3CCR6 (Th2) (D), CXCR3CCR6+ (Th17) (E), or the ratio of Th1:Th2 cells (F) was also compared between platforms at each time point. (G–L) A multiplex bead-based assay was then used to measure the supernatant concentrations of cytokines, and the Th1/Th2/Th17 skew of the cytokine response was determined by calculating ratios of IFN-γ:IL-5 (G), IFN-γ:IL-17A (H), IFN-γ:IL-4 (I), IL-5-IL-17A (J), IL-4:IL-17A (K), and IL-2:IFN-γ (L) in supernatants from day 63 PBMCs. In (A), all of the available samples were analyzed (ChAd63-MVA/protein/AS01B): day 0, n = 15/57; day 7, n = 15/20; day 14, n = 15/57; and day 63, n = 11/22. In (B–F), samples were excluded if the total number of PfRH5-specific CD45RO+CD4+ T cells was <50 (ChAd63-MVA/protein/AS01B): day 7, n = 12/20; day 14, n = 14/56; and day 63, n = 10/21. A multiplex assay (G–L) was run on a subset of samples (ChAd63-MVA/protein/AS01B): day 63, n = 9/15. Comparisons between trials were performed using Mann-Whitney tests. ∗p < 0.05, ∗∗p < 0.01, ∗∗∗p < 0.001, and ∗∗∗∗p < 0.0001. In all of the panels, each point represents a vaccinee. Lines denote medians and interquartile ranges.
Figure 3
Figure 3
Protein/AS01B platform induces a robust PfRH5-specific response within the cTfh cell population, with a qualitative skew toward Tfh2 PBMCs were stimulated as in Figure 2 with PfRH5-specific and Tfh1/2/17 gating as per Figures S4 and S6, respectively. cTfh cells were defined as CXCR5+ cells within CD45RO+CD4+ T cells and delineating the CXCR3-PD1+ subset of CXCR5+CD45RO+CD4+ cTfh. (A–E) Frequencies of PfRH5-specific cells were compared at each time point within cTfh cells (A), Tfh1 cells (B), Tfh2 cells (C), Tfh17 cells (D), and CXCR3PD1+ cells (E). (F–I) Within the PfRH5-specific cTfh cell population, the proportion of cells at each time point that was Tfh1 cells (F), Tfh2 cells (G), Tfh17 cells (H), or the ratio of %Tfh1:Tfh2 (I) was also compared between platforms. All of the available samples were analyzed (ChAd63-MVA/protein/AS01B): day 0, n = 15/57; day 7, n = 15/20; day 14, n = 15/57; and day 63, n = 11/22. In (B–E), samples were excluded if the total number of Tfh1/Th2/Th17 or CXCR3PD1+ cells was <50 in either the medium alone or PfRH5 peptide pool sample (ChAd63-MVA/protein/AS01B): day 0, n = 15/55–57; day 7, n = 15/19–20; day 14, n = 15/ 55–57; and day 63, n = 11/21. In (F–I), data points were excluded if the total number of responding cTfh cells was <50 (ChAd63-MVA/protein/AS01B): day 7, n = 5/7; day 14, n = 6/36; and day 63, n = 8/16. Comparisons between trials were performed using Mann-Whitney tests. ∗p < 0.05, ∗∗p < 0.01, ∗∗∗p < 0.001, and ∗∗∗∗p < 0.0001. In all of the panels, each point represents a vaccinee. Lines denote medians and interquartile ranges.
Figure 4
Figure 4
Transcriptomic analysis of PfRH5-specific CXCR5+ cells identifies signatures associated with the superior humoral immune response in protein/AS01B vaccinees PBMCs from 4 weeks following final vaccination from vaccinees receiving PfRH5 delivered using ChAd63-MVA (n = 6) or protein/AS01B (n = 5) platforms were stimulated with a PfRH5 peptide pool (2.5 μL/mL) for 24 h and stained for phenotypic and activation markers. (A) Representative gating strategy for sorting of PfRH5-specific CXCR5+ and CXCR5CD4+ T cells. (B) Volcano plot illustrating genes that were differentially expressed in PfRH5-specific CXCR5+CD4+ T cells from ChAd63-MVA versus protein/AS01B vaccinees. FDR-adjusted p values are shown on the y axis and log2 fold change on the x axis. Individual transcript names are shown for some points. (C) Results from Gene Ontology enrichment analysis using Hallmark and Kyoto Encyclopedia of Genes and Genomes (KEGG) databases. The network enrichment score (NES) for each pathway enriched or trending to be enriched (p < 0.1) in PfRH5-specific CXCR5+CD4+ T cells from either ChAd63-MVA or protein/AS01B vaccinees is illustrated, together with the p value; p values in bold remained significant after FDR correction (q < 0.05).
Figure 5
Figure 5
cTfh cell responses and parameters of Th1:Th2 skew correlate with key markers of humoral immunogenicity (A–C) Spearman correlation analyses were performed to interrogate the relationships between the frequency of PfRH5-specific cTfh cells at day 14 and the frequency of IgG+ mBCs that were PfRH5 specific at day 140 (A), the serum anti-PfRH5 IgG concentration at day 84 (B), and the purified IgG GIA at 10 mg/mL at day 70 (C). (D–H) Spearman correlation analyses were also performed between the frequency of Th2 (CXCR3CCR6) (D) or Th1 (CXCR3+CCR6) (E) cells within PfRH5-specific CD45RO+CD4+ T cells at day 14 and serum anti-PfRH5 IgG concentration at day 84, as well as between the IFN-γ:IL-5 ratio in day 63 supernatants and the frequency of IgG+ mBCs that were PfRH5 specific at day 140 (F), serum anti-PfRH5 IgG concentration at day 84 (G), and the purified IgG GIA at 10 mg/mL at day 70 (H). Sample sizes, Spearman r, and p values annotated on the graphs refer to analyses of pooled samples from both vaccine platforms. In all of the panels, each point represents a vaccinee.

References

    1. Payne R.O., Silk S.E., Elias S.C., Miura K., Diouf A., Galaway F., de Graaf H., Brendish N.J., Poulton I.D., Griffiths O.J. Human vaccination against RH5 induces neutralizing antimalarial antibodies that inhibit RH5 invasion complex interactions. JCI Insight. 2017;2:96381. - PMC - PubMed
    1. Jin J., Tarrant R.D., Bolam E.J., Angell-Manning P., Soegaard M., Pattinson D.J., Dulal P., Silk S.E., Marshall J.M., Dabbs R.A. Production, quality control, stability, and potency of cGMP-produced Plasmodium falciparum RH5.1 protein vaccine expressed in Drosophila S2 cells. NPJ Vaccines. 2018;3:32. - PMC - PubMed
    1. O’Donnell K., Marzi A. The Ebola virus glycoprotein and its immune responses across multiple vaccine platforms. Expert Rev. Vaccines. 2020;19:267–277. - PubMed
    1. Laurens M.B. RTS,S/AS01 vaccine (Mosquirix™): an overview. Hum. Vaccin. Immunother. 2020;16:480–489. - PMC - PubMed
    1. Heineman T.C., Cunningham A., Levin M. Understanding the immunology of Shingrix, a recombinant glycoprotein E adjuvanted herpes zoster vaccine. Curr. Opin. Immunol. 2019;59:42–48. - PubMed

Publication types

MeSH terms

Associated data