. 2021 Mar 16;2(3):100219.
doi: 10.1016/j.xcrm.2021.100219.

A single-cell atlas of the healthy breast tissues reveals clinically relevant clusters of breast epithelial cells

Affiliations

A single-cell atlas of the healthy breast tissues reveals clinically relevant clusters of breast epithelial cells

Poornima Bhat-Nakshatri et al. Cell Rep Med. .

Abstract

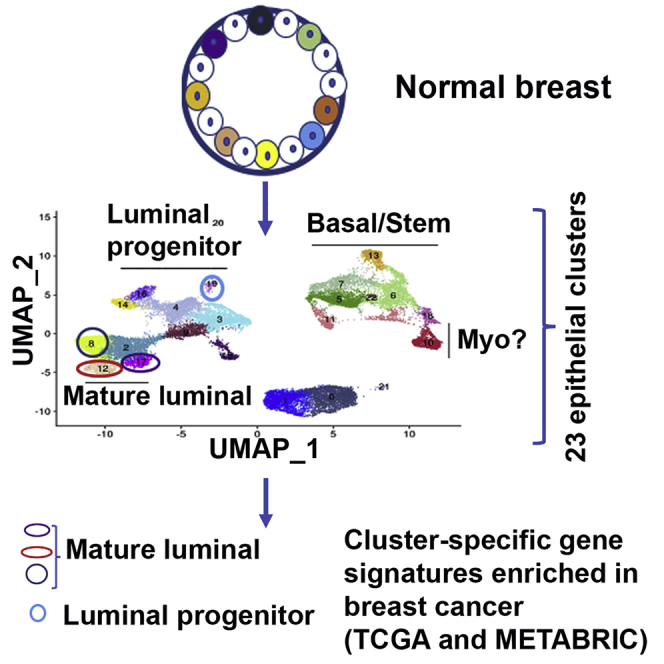
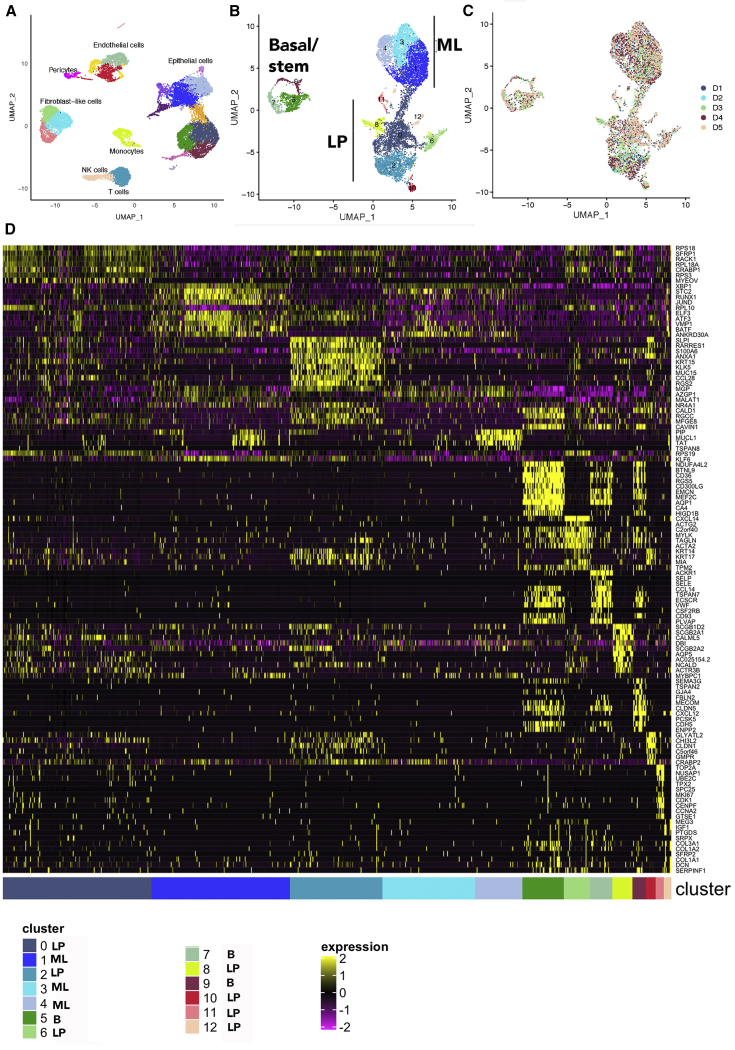
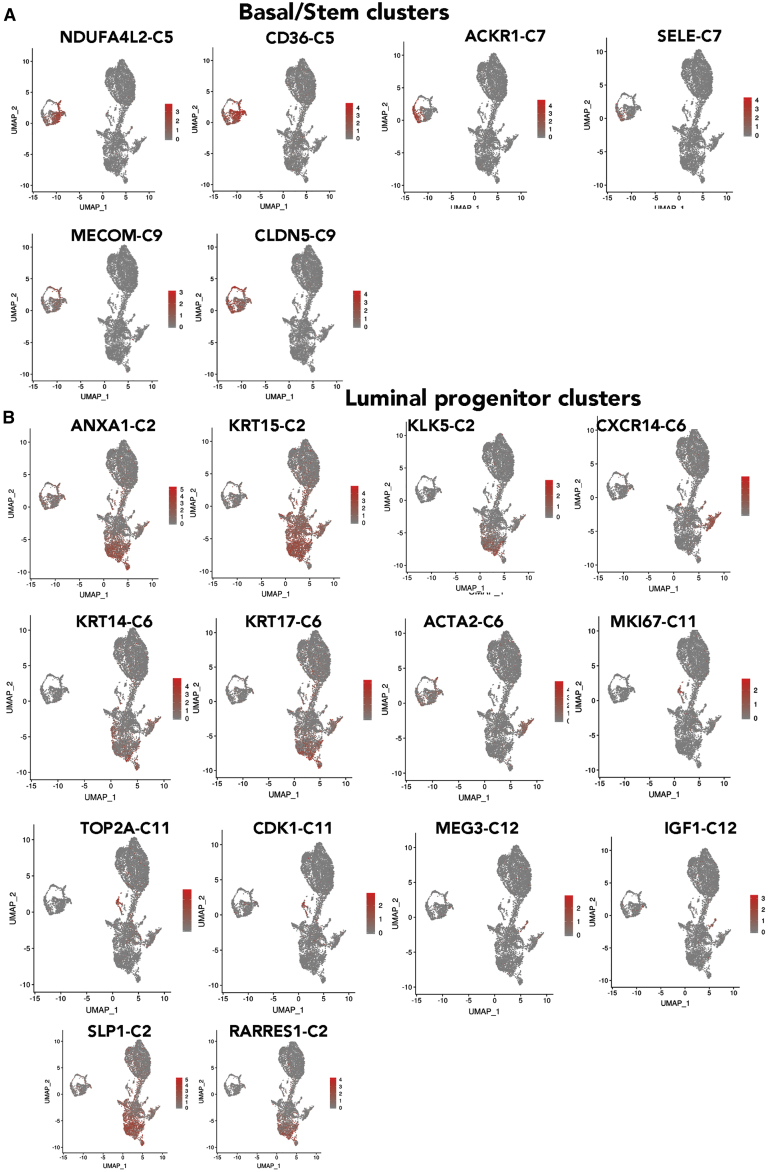
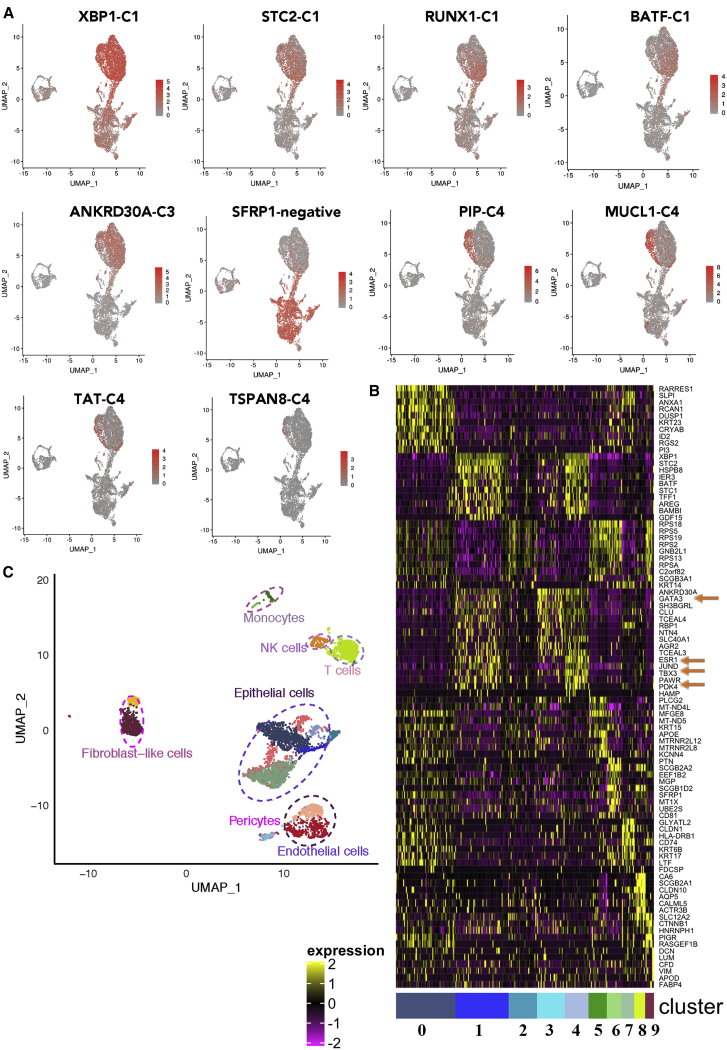
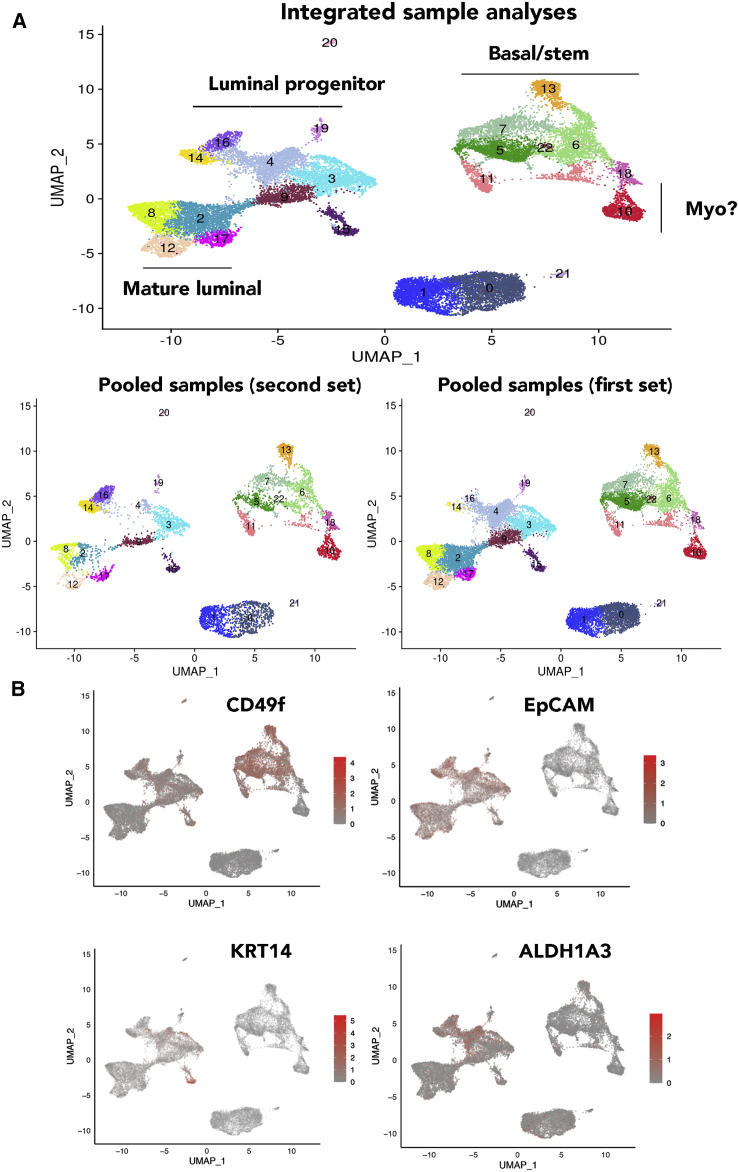
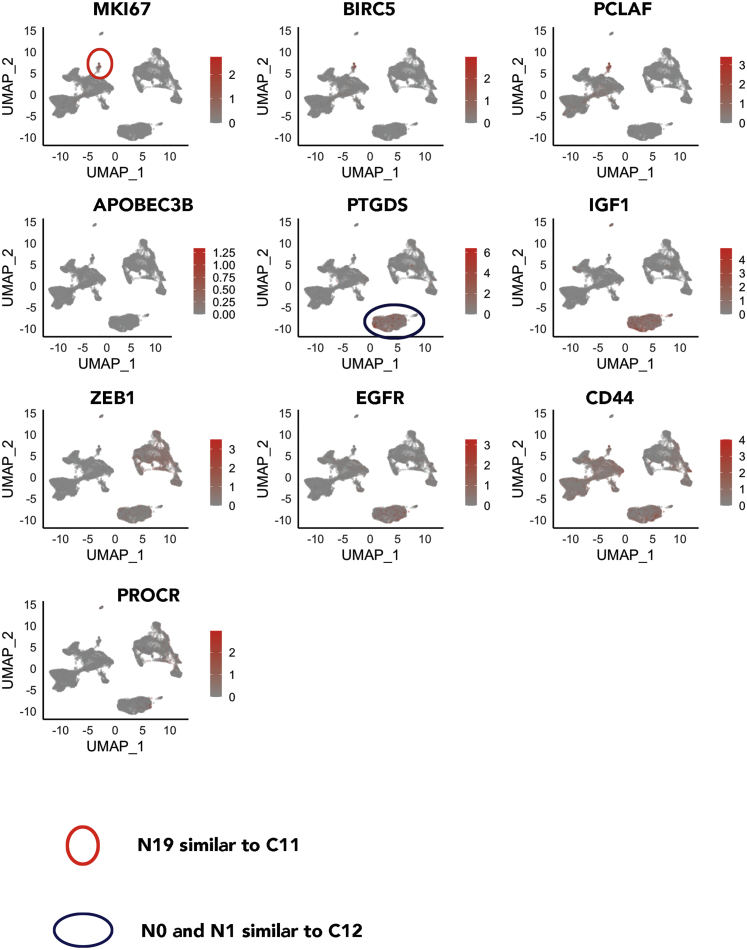
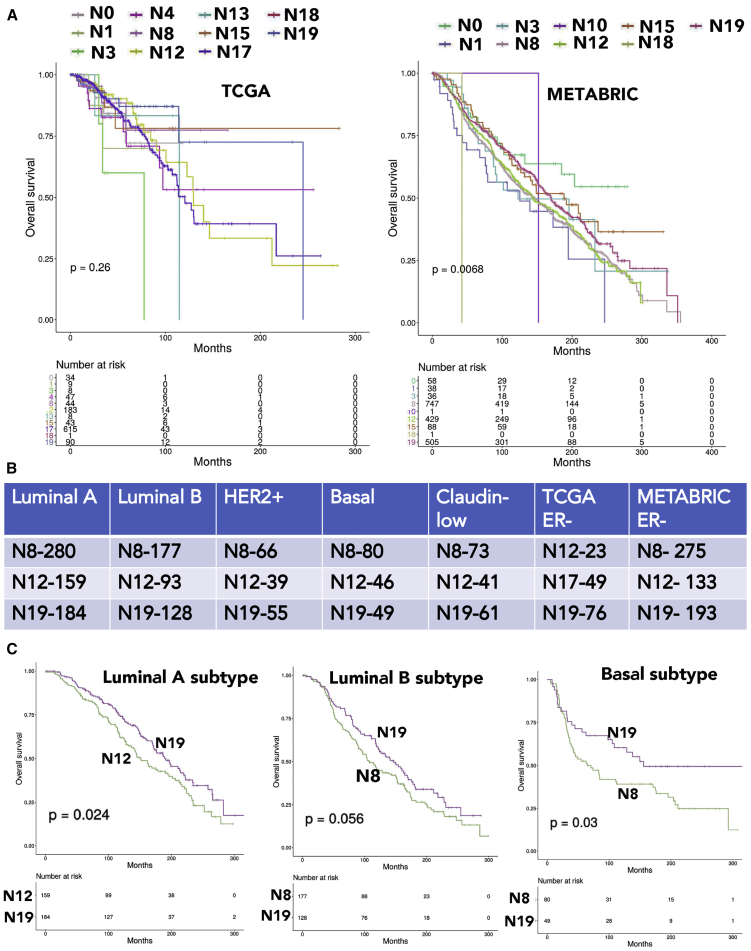
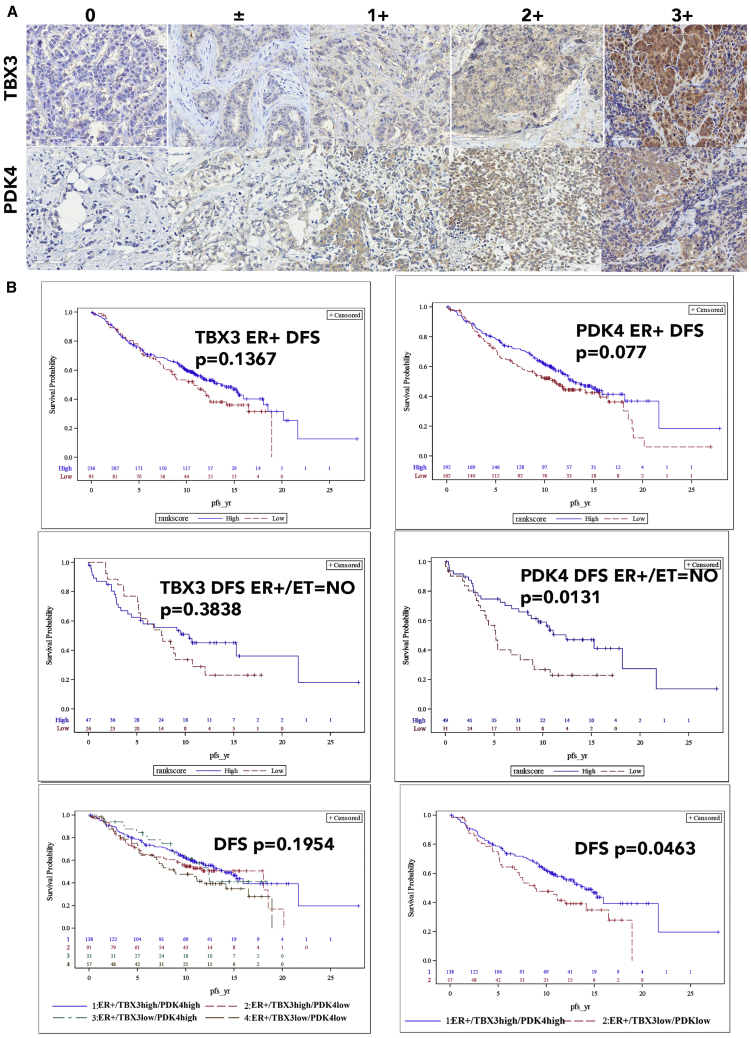
Single-cell RNA sequencing (scRNA-seq) is an evolving technology used to elucidate the cellular architecture of adult organs. Previous scRNA-seq on breast tissue utilized reduction mammoplasty samples, which are often histologically abnormal. We report a rapid tissue collection/processing protocol to perform scRNA-seq of breast biopsies of healthy women and identify 23 breast epithelial cell clusters. Putative cell-of-origin signatures derived from these clusters are applied to analyze transcriptomes of ~3,000 breast cancers. Gene signatures derived from mature luminal cell clusters are enriched in ~68% of breast cancers, whereas a signature from a luminal progenitor cluster is enriched in ~20% of breast cancers. Overexpression of luminal progenitor cluster-derived signatures in HER2+, but not in other subtypes, is associated with unfavorable outcome. We identify TBX3 and PDK4 as genes co-expressed with estrogen receptor (ER) in the normal breasts, and their expression analyses in >550 breast cancers enable prognostically relevant subclassification of ER+ breast cancers.

Keywords: breast cancer; cell of origin; epithelial cell clusters; normal breasts; single-cell analyses.


Conflict of interest statement

The authors declare no competing interests.

Figures

None
Graphical abstract
Figure 1
Figure 1
The normal breast contains 13 epithelial clusters (A) Integrated analysis of single cells of the normal breast biopsies of five healthy donors. Epithelial cells dominate among cell types. (B) Subclustering of epithelial cell types using CD49f/EpCAM as well as NFIB, TP63, EHF, ELF5, ESR1, and FOXA1 expression patterns. (C) Representation of various cell types in each sample. Subclusters in individual sample are shown in Figure S1A. (D) Hierarchical clustering of top cluster-enriched genes.
Figure 2
Figure 2
Expression patterns of representative cluster-enriched genes (A) Genes enriched in basal/stem cell clusters. (B) Genes enriched in various clusters within luminal progenitor cells.
Figure 3
Figure 3
Mature luminal cells are enriched for ESR1 and XBP1, whereas SFRP1 is enriched in luminal progenitor cells (A) Genes enriched in mature luminal cells. Note that cluster C4 within mature luminal cells is distinctly enriched for MUCL1 and PIP. (B) Identification of ESR1-expressing subclusters and genes co-expressed with ESR1 in the normal breasts. (C) Various cell types in the normal breast of a donor.
Figure 4
Figure 4
Recharacterization of epithelial cells of the normal breasts with additional samples (A) Combined integrated analyses that included samples in Figure 1, a new sample from an Asian (Chinese), and pooled five new samples. There were 23 clusters of cells, which can be subdivided into three major groups of basal/stem, luminal progenitor, and mature luminal cells. Potential myoepithelial cells (myo) distinct from basal/stem cells are also indicated. The bottom panel shows distribution patterns of cell clusters in five samples of the first set and the five pooled samples of the second set. Clusters in individual samples are shown in Figure S1B. Expression patterns of various markers that are used to subclassify clusters are shown Figure S2. (B) CD49f, EpCAM, ALDH1A3, and KRT14 expression in various clusters.
Figure 5
Figure 5
Gene expression in clusters N19 and N0–N1 of Figure 4 overlap with unique genes in C11 and C12, respectively (A) MKI67, BIRC5, and PCLAF, which are all overexpressed in cluster C11 (Figure 1D), are enriched in N19. (B) PTGDS and IGF1, which are overexpressed in cluster C12 (Figure 1D), are enriched in N0–N1 clusters. This cluster also expresses ZEB1 and EGFR.
Figure 6
Figure 6
Breast-cancer-subtype-specific expression of cluster-signature genes (A) Breast cancer gene expression data in TCGA (left) and METABRIC datasets were analyzed for enrichment of cluster-specific genes described in Table S3. (B) PAM50 intrinsic subtype classifiers were used to subdivide breast cancers into luminal A, luminal B, HER2, basal, and claudin-low subtypes. Enrichment of cluster-specific genes in these subtypes of breast cancer were further analyzed. (C) Kaplan-Meier curves show overall survival based on overlap in gene expression between specific clusters and specific subtypes of breast cancer. Additional data can be found in Figure S3.
Figure 7
Figure 7
PDK4 and TBX3 enable further classification of ER+ breast cancers (A) Immunohistochemistry of breast TMA for PDK4 and TBX3. (B) ER+ breast cancers expressing lower levels of PDK4 compared to tumors with higher PDK4 and not received endocrine therapy were associated with poor disease-free survival (DFS). Similarly, ER+ tumors expressing lower levels of both TBX3 and PDK4 compared to tumors expressing higher levels of PDK4 and TBX3 were associated with poor DFS.

References

    1. Sotiriou C., Neo S.Y., McShane L.M., Korn E.L., Long P.M., Jazaeri A., Martiat P., Fox S.B., Harris A.L., Liu E.T. Breast cancer classification and prognosis based on gene expression profiles from a population-based study. Proc. Natl. Acad. Sci. USA. 2003;100:10393–10398. - PMC - PubMed
    1. Curtis C., Shah S.P., Chin S.F., Turashvili G., Rueda O.M., Dunning M.J., Speed D., Lynch A.G., Samarajiwa S., Yuan Y., METABRIC Group The genomic and transcriptomic architecture of 2,000 breast tumours reveals novel subgroups. Nature. 2012;486:346–352. - PMC - PubMed
    1. Prat A., Perou C.M. Mammary development meets cancer genomics. Nat. Med. 2009;15:842–844. - PubMed
    1. Visvader J.E., Stingl J. Mammary stem cells and the differentiation hierarchy: current status and perspectives. Genes Dev. 2014;28:1143–1158. - PMC - PubMed
    1. Lim E., Vaillant F., Wu D., Forrest N.C., Pal B., Hart A.H., Asselin-Labat M.L., Gyorki D.E., Ward T., Partanen A., kConFab Aberrant luminal progenitors as the candidate target population for basal tumor development in BRCA1 mutation carriers. Nat. Med. 2009;15:907–913. - PubMed

Publication types

MeSH terms