. 2021 Mar 16;2(3):100220.
doi: 10.1016/j.xcrm.2021.100220.

MAIT cell activation is associated with disease severity markers in acute hantavirus infection

Affiliations

MAIT cell activation is associated with disease severity markers in acute hantavirus infection

Kimia T Maleki et al. Cell Rep Med. .

Abstract

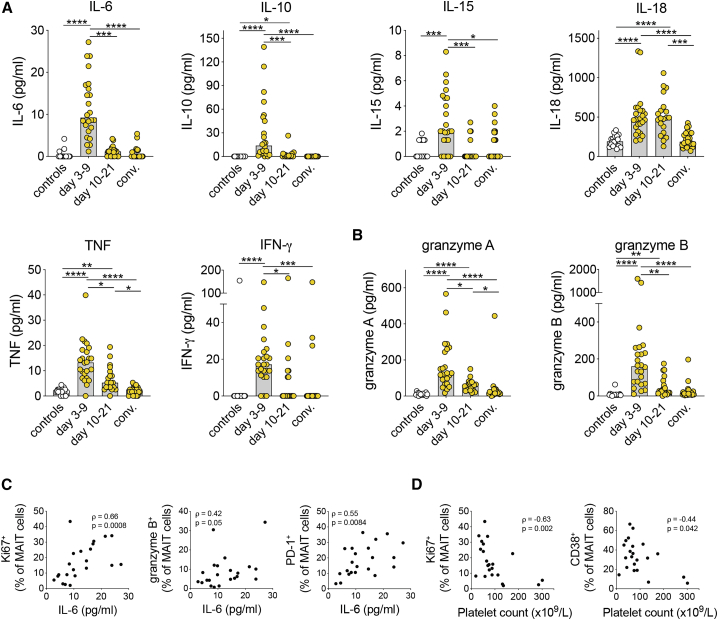
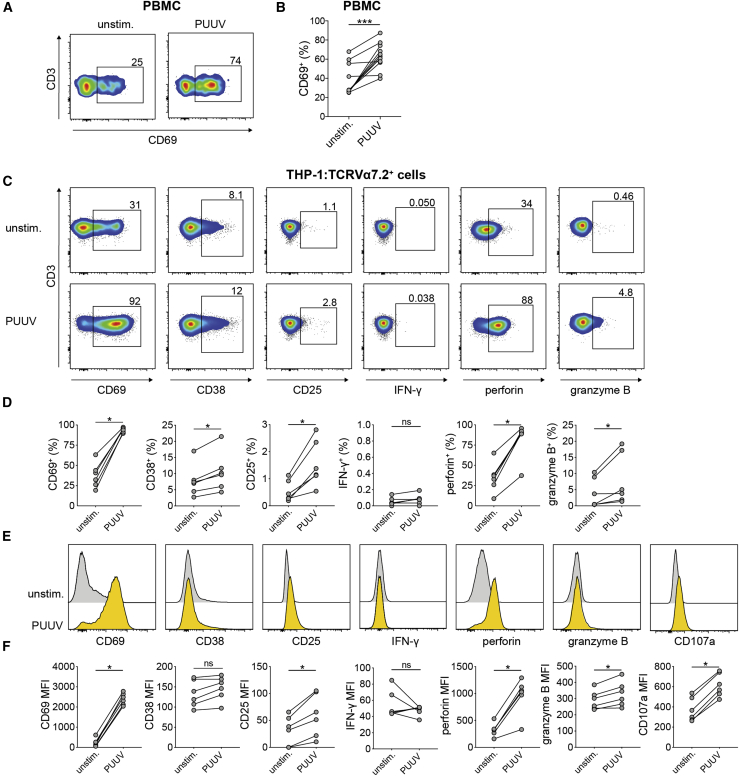
Hantaviruses are zoonotic RNA viruses that cause severe acute disease in humans. Infected individuals have strong inflammatory responses that likely cause immunopathology. Here, we studied the response of mucosal-associated invariant T (MAIT) cells in peripheral blood of individuals with hemorrhagic fever with renal syndrome (HFRS) caused by Puumala orthohantavirus, a hantavirus endemic in Europe. We show that MAIT cell levels decrease in the blood during HFRS and that residual MAIT cells are highly activated. This activation correlates with HFRS severity markers. In vitro activation of MAIT cells by hantavirus-exposed antigen-presenting cells is dependent on type I interferons (IFNs) and independent of interleukin-18 (IL-18). These findings highlight the role of type I IFNs in virus-driven MAIT cell activation and suggest a potential role of MAIT cells in the disease pathogenesis of viral infections.

Keywords: IL-6; MAIT cells; Puumala orthohantavirus; T cells; cytokines; endothelial cells; hantavirus; hemorrhagic fever with renal syndrome; monocytes; type I interferons.


Conflict of interest statement

The authors declare no competing interests.

Figures

None
Graphical abstract
Figure 1
Figure 1
Blood MAIT cells are reduced during HFRS (A) Representative flow cytometry plots showing frequencies of MAIT cells in a control and in an individual with HFRS (gated on CD3+ cells). (B) MAIT cell frequencies (gated on CD3+ cells) in controls (n = 19) and individuals with HFRS during the acute phase (days 3–9, n = 24), intermediate phase (days 10–21, n = 21), and convalescent phase (conv.; n = 24). (C) Absolute counts of MAIT cells in controls and individuals with HFRS during the acute phase (days 3–9, n = 22), intermediate phase (days 10–21, n = 20), and conv. (n = 23). (D) Representative flow cytometry plots showing frequencies of MAIT cells expressing CD8 and CD4 a control and in an individual with HFRS. (E) Frequencies of CD8+, CD8 and CD4 double-negative (DN), and CD4+ MAIT cells in controls and individuals with HFRS during the acute phase (days 3–9, n = 22), intermediate phase (days 10–21, n = 18), and conv. (n = 24). (F) CD8 median fluorescence intensity (MFI) of CD8+ MAIT cells of controls and individuals with HFRS during the acute phase (n = 22), intermediate phase (n = 18), and conv. (n = 24). Horizontal lines and bars represent median values. Kruskal-Wallis test, Friedman test. ∗p < 0.05, ∗∗p < 0.01, ∗∗∗p < 0.001.
Figure 2
Figure 2
Residual MAIT cells are highly activated during HFRS (A) Representative flow cytometry plots showing frequencies of CD38+, CD69+, granzyme B+, and Ki67+ MAIT cells in controls and individuals with HFRS during the acute phase (days 3–9, n = 22), intermediate phase (days 10–21, n = 18), and convalescent phase (conv.) (n = 24). (B) Frequencies of CD38+, CD69+, granzyme B+, and Ki67+ MAIT cells in controls and individuals with HFRS during the acute phase (n = 22), intermediate phase (n = 18), and conv. (n = 24). Bars represent median values. Kruskal-Wallis test, Friedman test. ∗p < 0.05, ∗∗p < 0.01, ∗∗∗∗p < 0.0001.
Figure 3
Figure 3
MAIT cell activation correlates with disease severity markers (A and B) Plasma levels of (A) cytokines and (B) granzymes in controls (n = 18) and individuals with HFRS during the acute phase (days 3–9, n = 24), intermediate phase (days 10–21, n = 21), and convalescent phase (conv.) (n = 24). (C) Correlations between plasma IL-6 levels and the frequencies of Ki67+, granzyme B+, and PD-1+ MAIT cells during acute HFRS (n = 22). (D) Correlations between platelet counts and the frequencies of Ki67+ and CD38+ MAIT cells during acute HFRS (n = 22). Spearman‘s rank correlation coefficient. Bars represent median values. Kruskal-Wallis test, Friedman test. ∗p < 0.05, ∗∗p < 0.01, ∗∗∗p < 0.001, ∗∗∗∗p < 0.0001.
Figure 4
Figure 4
MAIT cells of individuals with HFRS display altered expression of tissue homing markers (A) Plasma levels of CCL20 and CCL25 in controls (n = 18) and individuals with HFRS during the acute phase (days 3–9, n = 24), intermediate phase (days 10–21, n = 21), and convalescent phase (conv.) (n = 24). (B) Frequencies of CCR9+ MAIT cells in controls (n = 19) and individuals with HFRS during the acute phase (days 3–9, n = 22), intermediate phase (days 10–21, n = 18), and conv. (n = 24). (C and D) Representative flow cytometry plots (C) and frequencies (D) of α4β7+ MAIT cells in controls and individuals with HFRS. (E and F) Representative flow cytometry plots (E) and frequencies (F) of CCR6+ MAIT cells in controls and individuals with HFRS during the acute phase (n = 22), intermediate phase (n = 18), and conv. (n = 24). Bars represent median values. Kruskal-Wallis test, Friedman test. ∗p < 0.05, ∗∗p < 0.01, ∗∗∗p < 0.001, ∗∗∗∗p < 0.0001.
Figure 5
Figure 5
PUUV-exposed antigen-presenting cells stimulate MAIT cell activation in vitro (A and B) PBMCs from blood donors were exposed to PUUV (MOI 1) or left unstimulated for 72 h, and then MAIT cells were assessed for CD69 expression (n = 11, four independent experiments). (C–F) THP-1 cells were treated with PUUV (MOI 5) or left unstimulated for 72 h and then co-incubated with TCR Vα7.2+ cells purified from buffy coats from blood donors for 12 h. (C and D) Representative flow cytometry plots (C) and graphs (D) showing the frequencies of CD69+, CD38+, CD25+, IFN-γ+, perforin+, and granzyme B+ MAIT cells after 12 h co-incubation with unstimulated and PUUV-exposed THP-1 cells (n = 6, two independent experiments). (E and F) Representative histograms (E) and graphs (F) displaying the mean fluorescence intensity (MFI) of CD69, CD38, CD25, IFN-γ, perforin, granzyme B, and CD107a in MAIT cells after 12 h co-incubation with unstimulated and PUUV-exposed THP-1 cells (n = 6, same donors as in C and D, two independent experiments). Bars represent median values. Wilcoxon signed-rank test. ∗p < 0.05, ∗∗∗p < 0.001.
Figure 6
Figure 6
PUUV-induced MAIT cell activation is dependent on type I IFNs (A) CD69 expression (fold change normalized to unstimulated, depicted by a dotted line) on MAIT cells after co-incubation with THP-1 cells exposed to PUUV or UV-inactivated PUUV (n = 5, two independent experiments). (B) CD69 expression on MAIT cells after co-incubation with THP-1 cells exposed to PUUV in the presence or absence of anti-MR1 and MAIT cells incubated with conditioned medium (CM) from PUUV-exposed THP-1 cells (n = 8, three independent experiments). (C and D) Levels of IL-18 (C) and IFN-α (D) in supernatants of unstimulated and PUUV-exposed THP-1 cells 72 h after exposure (median + SD of three independent experiments). (E and F) Anti-IL-12 antibody and/or anti-IL-18 antibody and/or the type I IFN blocking reagent B18R was added to THP-1 cultures prior to addition of TCR Vα7.2+ cells (n = 8, same donors as in B, three independent experiments). (E) Representative flow cytometry plots of CD69 and perforin expression on MAIT cells following 12 h co-incubation with PUUV-exposed or unstimulated THP-1 cells. (F) Frequencies of CD69+ and (H) perforin+ MAIT cells. (G–J) Primary monocytes (n = 2) or endothelial cells (ECs) were treated with PUUV (MOI 1) or left unstimulated for 48 h and then co-incubated with purified TCR Vα7.2+ cells for 24 h. (G and H) Representative flow cytometry plots (G) and graphs (H) showing the expression of CD69, CD38, IFN-γ, granzyme B, perforin, and CD107a on MAIT cells (n = 6, two independent experiments) following 24 h incubation with CM from PUUV-exposed or unstimulated primary monocytes with or without B18R. (I and J) Representative flow cytometry plots (I) and graphs (J) showing the expression of CD69, CD38, IFN-γ, perforin, granzyme B, and CD107a on MAIT cells (n = 6, two independent experiments) following 24 h incubation with CM from PUUV-exposed or unstimulated primary ECs with or without B18R. (K) IFN-α levels in plasma of controls (n = 19) and individuals with HFRS during the acute phase (days 3–9, n = 18), intermediate phase (days 10–21, n = 16), and conv. n = 16). Bars represent median values. Kruskal-Wallis test, Friedman test; median. n.d., not detected. ∗p < 0.05, ∗∗p < 0.01, ∗∗∗p < 0.001.

References

    1. Vaheri A., Henttonen H., Voutilainen L., Mustonen J., Sironen T., Vapalahti O. Hantavirus infections in Europe and their impact on public health. Rev. Med. Virol. 2013;23:35–49. - PubMed
    1. Avsic-Zupanc T., Petrovec M., Furlan P., Kaps R., Elgh F., Lundkvist A. Hemorrhagic fever with renal syndrome in the Dolenjska region of Slovenia--a 10-year survey. Clin. Infect. Dis. 1999;28:860–865. - PubMed
    1. MacNeil A., Ksiazek T.G., Rollin P.E. Hantavirus pulmonary syndrome, United States, 1993-2009. Emerg. Infect. Dis. 2011;17:1195–1201. - PMC - PubMed
    1. Hjertqvist M., Klein S.L., Ahlm C., Klingström J. Mortality rate patterns for hemorrhagic fever with renal syndrome caused by Puumala virus. Emerg. Infect. Dis. 2010;16:1584–1586. - PMC - PubMed
    1. Vaheri A., Strandin T., Hepojoki J., Sironen T., Henttonen H., Mäkelä S., Mustonen J. Uncovering the mysteries of hantavirus infections. Nat. Rev. Microbiol. 2013;11:539–550. - PubMed

Publication types

MeSH terms