. 2021 Jul 8;138(1):23-33.
doi: 10.1182/blood.2020008966.

Single-cell transcriptomics dissects hematopoietic cell destruction and T-cell engagement in aplastic anemia

Affiliations

Single-cell transcriptomics dissects hematopoietic cell destruction and T-cell engagement in aplastic anemia

Caiying Zhu et al. Blood. .

Abstract

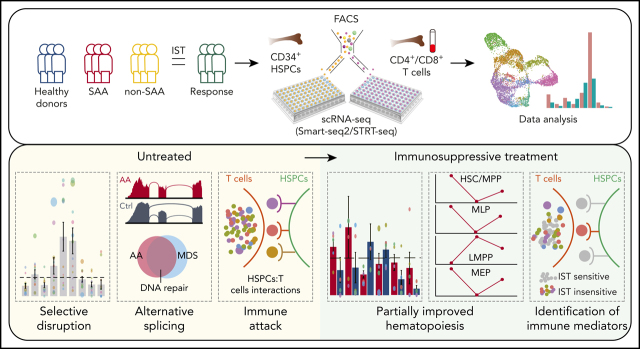
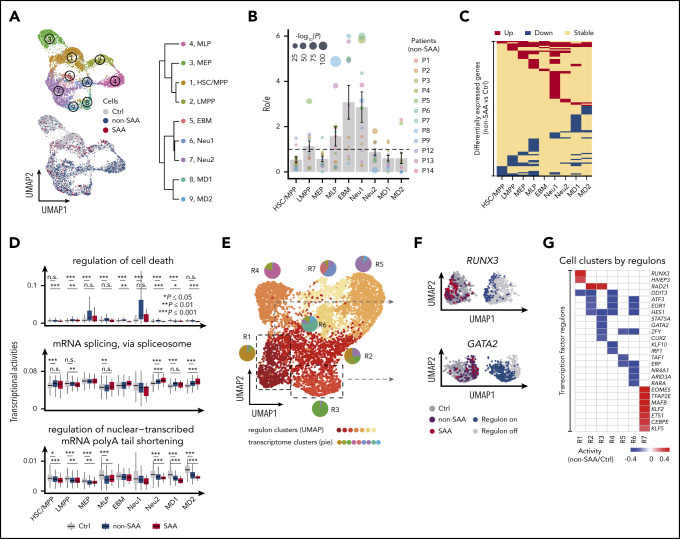
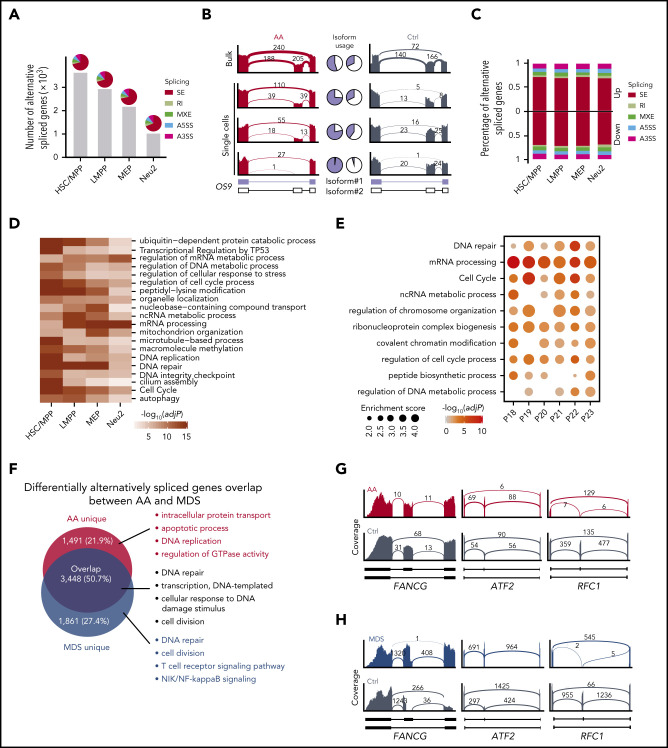
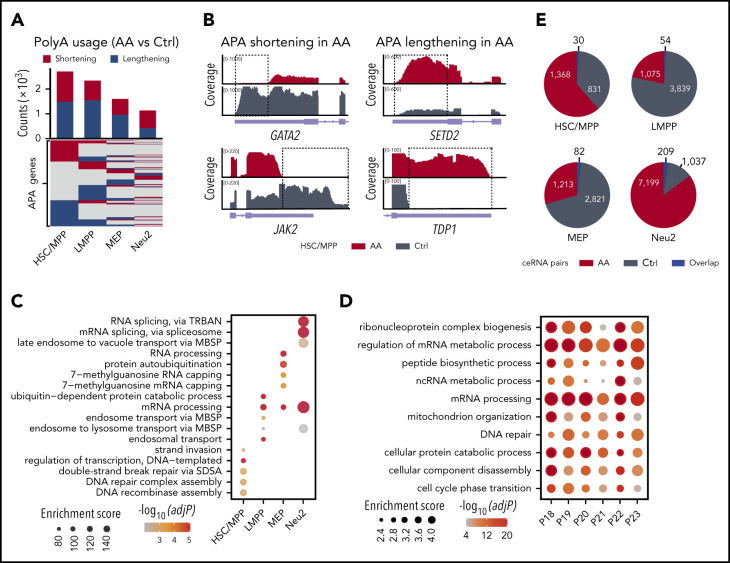
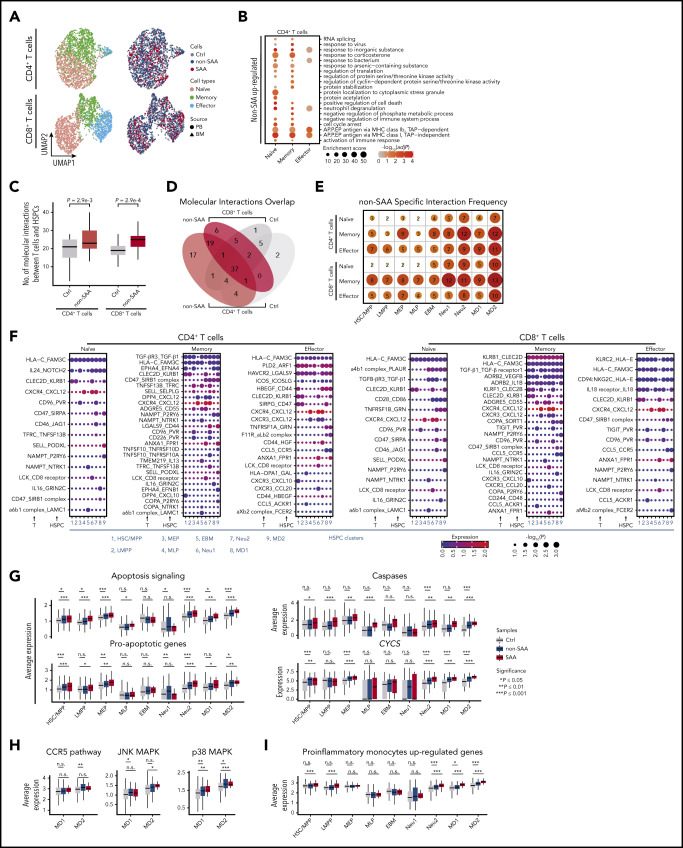
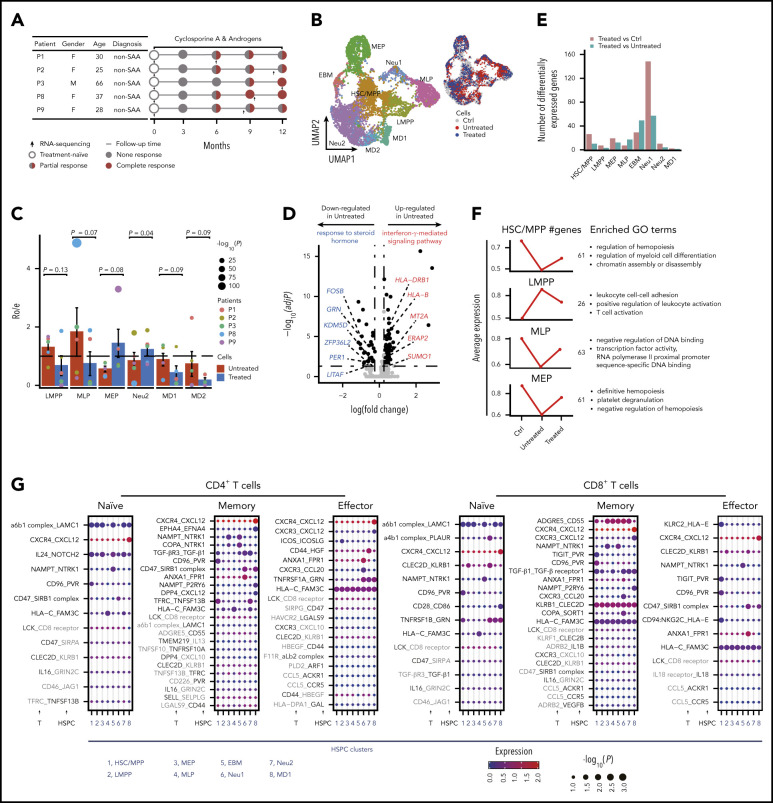
Aplastic anemia (AA) is a T cell-mediated autoimmune disorder of the hematopoietic system manifested by severe depletion of the hematopoietic stem and progenitor cells (HSPCs). Nonetheless, our understanding of the complex relationship between HSPCs and T cells is still obscure, mainly limited by techniques and the sparsity of HSPCs in the context of bone marrow failure. Here we performed single-cell transcriptome analysis of residual HSPCs and T cells to identify the molecular players from patients with AA. We observed that residual HSPCs in AA exhibited lineage-specific alterations in gene expression and transcriptional regulatory networks, indicating a selective disruption of distinct lineage-committed progenitor pools. In particular, HSPCs displayed frequently altered alternative splicing events and skewed patterns of polyadenylation in transcripts related to DNA damage and repair, suggesting a likely role in AA progression to myelodysplastic syndromes. We further identified cell type-specific ligand-receptor interactions as potential mediators for ongoing HSPCs destruction by T cells. By tracking patients after immunosuppressive therapy (IST), we showed that hematopoiesis remission was incomplete accompanied by IST insensitive interactions between HSPCs and T cells as well as sustained abnormal transcription state. These data collectively constitute the transcriptomic landscape of disrupted hematopoiesis in AA at single-cell resolution, providing new insights into the molecular interactions of engaged T cells with residual HSPCs and render novel therapeutic opportunities for AA.


Figures

None
Graphical abstract
Figure 1.
Figure 1.
Lineage-specific alterations in residual HSPC by single-cell transcriptomes in patients with AA. (A) Uniform manifold approximation and project (UMAP) visualization of HSPCs based on single-cell transcriptomes (left). Each dot represents a single cell; colors indicate cell clusters with numbered labels (top) and source of donors (bottom) (healthy controls [Ctrls], n = 4; non-SAA, n = 12; SAA, n = 3). Hierarchical clustering showing transcriptional relationships among cell types (right); the dot colors and numbers correspond to their counterparts in the UMAP plot (left). (B) Bar plot showing the ratio of observed to expected numbers of each cell type in patients non-SAA (n = 12). Dots indicate individual patients and dot sizes represent logarithmic transformed P values (χ2 test). Error bars represent ± standard error of the mean. (C) Heat-map showing differentially expressed genes (rows) comparing patients with non-SAA (n = 12) with Ctrl across 9 different cell types (columns). Red indicates upregulation in non-SAA, blue indicates downregulation in non-SAA, and yellow indicates no significant change in expression (Wilcoxon rank-sum test, fold change ≥2, Bonferroni adjusted P ≤ .05). (D) Representative expression of selected gene sets illustrating the heterogeneity of transcriptional modulation and differential expression in HSPCs from patients with non-SAA (n = 12) and SAA (n = 3). *P ≤ .05; **P ≤ 0.01; ***P ≤ 0.001 (Wilcoxon rank-sum test). (E) UMAP visualization of HSPC clustering based on regulons. Each pie chart shows the composition of each regulon cluster by cell types (defined based on single-cell gene expression). (F) Representative display of differential regulon activity in hematopoietic stem cells and multipotent progenitors (top) and megakaryocyte/erythroid progenitors (bottom) corresponding to regulon clusters R1 and R3 in (E), respectively. Dark red dots represent cells from SAA (n = 3), dark blue dots represent cells from patients with non-SAA (n = 12), and dark gray dots represent Ctrl cells (left). Blue indicates active regulons and gray represents inactive regulons (right). (G) Heat-map showing regulons that were differentially activated (rows) between patients with non-SAA (n = 12) and Ctrl across 7 different regulon clusters (columns). Blue to red color indicates low to high regulon activity in non-SAA.
Figure 2.
Figure 2.
Alternative splicing events in HSPCs. (A) Number of genes that were differentially alternatively spliced in each HSPC subset. Pie charts illustrate the percentages of 5 types of splicing events. SE, skipped exon; RI, retained intron; MXE, mutually exclusive exons; A5SS, alternative 5′ splicing site; A3SS, alternative 3′ splicing site. (B) Representative display of differential OS9 exon usage in AA compared with control (Ctrl). Pie charts demonstrate the ratio of exon-exclusion isoform (blue, isoform#1) to exon-inclusion isoform (white, isoform#2). Bulk indicates the aggregation of single-cell data. (C) Percentage of different types of splicing events associated with up- or downregulated genes in AA. (D) Heat-map showing the top 20 enriched terms of differentially alternatively spliced genes in HSPCs. Colors indicate logarithmic transformed adjusted P values (Benjamini-Hochberg correction). (E) Enriched terms of differentially alternatively spliced genes between each patient with AA (n = 6) and 3 healthy controls based on bulk RNA-seq. Dot sizes represent enrichment scores and dot colors represent logarithmic transformed adjusted P values (Benjamini-Hochberg correction). (F) Venn diagram showing the overlap of differentially alternatively spliced genes in AA and MDS compared with Ctrl in aggregated HSPCs. Top 4 enriched GO terms ranked by P values (hypergeometric test) are shown for each gene set. Representative display of shared skipped exon events for DNA repair-associated genes in AA (G) and MDS (H) of aggregated HSPCs.
Figure 3.
Figure 3.
Aberrant polyadenylation in HSPCs. (A) Heat-map showing genes (rows) with 3′ untranslated region (UTR) shortening (red) or lengthening (blue) in AA derived HSPCs. Bar plot shows the number of altered APA genes in each cell type (top). (B) Representative display of genes exhibiting 3′ UTR shortening (GATA2, JAK2) or lengthening (SETD2, TDP1) in HSC/MPP. Alternative usages of the 3′ UTR are highlighted by the dotted rectangles. (C) Top 5 enriched GO terms (ranked by logarithmic transformed adjusted P values, Benjamini-Hochberg correction) for altered APA genes in each HSPC subset. MBSP, multivesicular body sorting pathway; SDSA, synthesis-dependent strand annealing; TRBAN, transesterification reactions with bulged adenosine as nucleophile. (D) Enriched terms of differential APA genes between each patient with AA (n = 6) and 3 healthy controls (Ctrls) based on bulk RNA-seq. Dot sizes represent enrichment scores and dot colors represent logarithmic transformed adjusted P values (Benjamini-Hochberg correction). (E) Pie charts showing the number of ceRNA pairs shared between AA and Ctrl (blue). AA-specific ceRNA pairs (red) and control-specific ceRNA pairs (gray) have also been highlighted.
Figure 4.
Figure 4.
HSPC molecular interactions with T cells. (A) UMAP visualization of single T cells derived from bone marrow (triangles) or peripheral blood (circles) from SAA (dark red, n = 4), non-SAA (dark blue, n = 11) or Ctrl (dark gray, n = 2). Colors indicate naïve cells (red), memory cells (green), and effector cells (blue). (B) Top 20 GO terms enriched among the genes upregulated in CD4+ T cells from patients with non-SAA (n = 11). Dot color indicates the logarithmic transformed adjusted P value (Benjamini-Hochberg correction). Dot size indicates enrichment score estimated by Metascape. Abbreviation: AP.P.EP, antigen processing and presentation of exogenous peptide. (C) Box plots indicating a significantly increased number of HSPCs molecular interactions with CD4+ and CD8+ T cells in non-SAA (HSPCs, n = 12; T cells, n = 11; Student t test). (D) Venn diagram displaying the overlap of molecular interactions between CD4+ and CD8+ T cells in non-SAA (HSPCs, n = 12; T cells, n = 11). (E) Number of non-SAA–specific molecular interactions in each T-cell subset and HSPCs. Gradient color and dot size indicate relative abundance of molecular interactions. (F) Spectrum of ligand-receptor pairs (rows) between HSPCs and T cells (columns) as observed in patients with non-SAA (HSPCs, n = 12; T cells, n = 11). Dot sizes and colors represent logarithmic transformed P values (permutation test) and mean expression of interacting molecules in corresponding cell subsets. (G) Average expression of apoptosis signaling genes and critical components in this signaling pathway. *P ≤ .05; **P ≤ .01; ***P ≤ .001; Wilcoxon rank-sum test. (H) Average expression of CCR5 pathway genes and critical components in this signaling pathway. (I) Average expression of upregulated genes in proinflammatory monocytes in autoimmune disease.
Figure 5.
Figure 5.
Transcriptome dynamics of HSPCs and T cells and their crosstalk after immunosuppressive therapy. (A) Diagram of tracking patients with non-SAA (n = 5) responsive to immunosuppressive treatment. Characteristics of each patient are shown on the left table; days of follow-up relative to diagnosis and the time points for sample collection are shown on the right accordingly. (B) UMAP display of HSPCs based on single-cell transcriptomes. Each dot represents a single cell; colors indicate cell clusters (left) and source of donors (right) (untreated, n = 12; treated, n = 5). (C) Bar plot showing the ratio of observed to expected cell numbers of each cell type in patients with both untreated and treated samples (n = 5). Dots indicate individual patients and dot sizes indicate logarithmic transformed P values (χ2 test). Error bars represent ± standard error of the mean. Student t test was used for differential comparison between untreated and treated. (D) Volcano plot showing the DEGs of MD2 in treatment-naïve patients (n = 12) compared with control (Ctrl). Each dot represents a single gene; the black dots represent DEGs (fold change using default parameters in Seurat with Bonferroni adjusted P ≤ .05). Selected enriched GO terms of downregulated and upregulated genes in treatment-naïve patients are shown on the top. Genes with blue and red colors are related to response to steroid hormone and IFN-γ–mediated signaling pathway, respectively. (E) Bar plot displays the number of DEGs between different donor groups in HSPCs (untreated, n = 12; treated, n = 5). (F) Line chart showing the expression dynamics of 4 gene sets in Ctrl and different time points of patients with non-SAA illustrating milder hematopoietic improvement after treatment (left) (untreated, n = 12; treated, n = 5). The number in the middle means the number of genes sharing the same expression pattern in each cluster. Enriched GO terms in each cluster were shown on the right. (G) Molecular interaction states of 55 ligand-receptor pairs (rows) between HSPCs and T cells (columns) in non-SAA after immunosuppressive treatment (n = 5). Molecules in gray indicate that they were downregulated in T cells or HSPCs. Dot sizes and colors represent logarithmic transformed P values (permutation test) and mean expression of interacting molecules in corresponding cell subsets.

Similar articles

Cited by

References

    1. Maciejewski JP, Selleri C, Sato T, Anderson S, Young NS. A severe and consistent deficit in marrow and circulating primitive hematopoietic cells (long-term culture-initiating cells) in acquired aplastic anemia. Blood. 1996;88(6):1983-1991. - PubMed
    1. Young NS. Aplastic anemia. N Engl J Med. 2018;379(17):1643-1656. - PMC - PubMed
    1. Schoettler ML, Nathan DG. The pathophysiology of acquired aplastic anemia: current concepts revisited. Hematol Oncol Clin North Am. 2018;32(4):581-594. - PMC - PubMed
    1. Maciejewski J, Selleri C, Anderson S, Young NS. Fas antigen expression on CD34+ human marrow cells is induced by interferon gamma and tumor necrosis factor alpha and potentiates cytokine-mediated hematopoietic suppression in vitro. Blood. 1995;85(11):3183-3190. - PubMed
    1. Zoumbos NC, Gascon P, Djeu JY, Young NS. Interferon is a mediator of hematopoietic suppression in aplastic anemia in vitro and possibly in vivo. Proc Natl Acad Sci USA. 1985;82(1):188-192. - PMC - PubMed

Publication types