

Degradable and Removable Tough Adhesive Hydrogels
- PMID: 33763904
- PMCID: PMC8764582
- DOI: 10.1002/adma.202008553
Degradable and Removable Tough Adhesive Hydrogels
Abstract
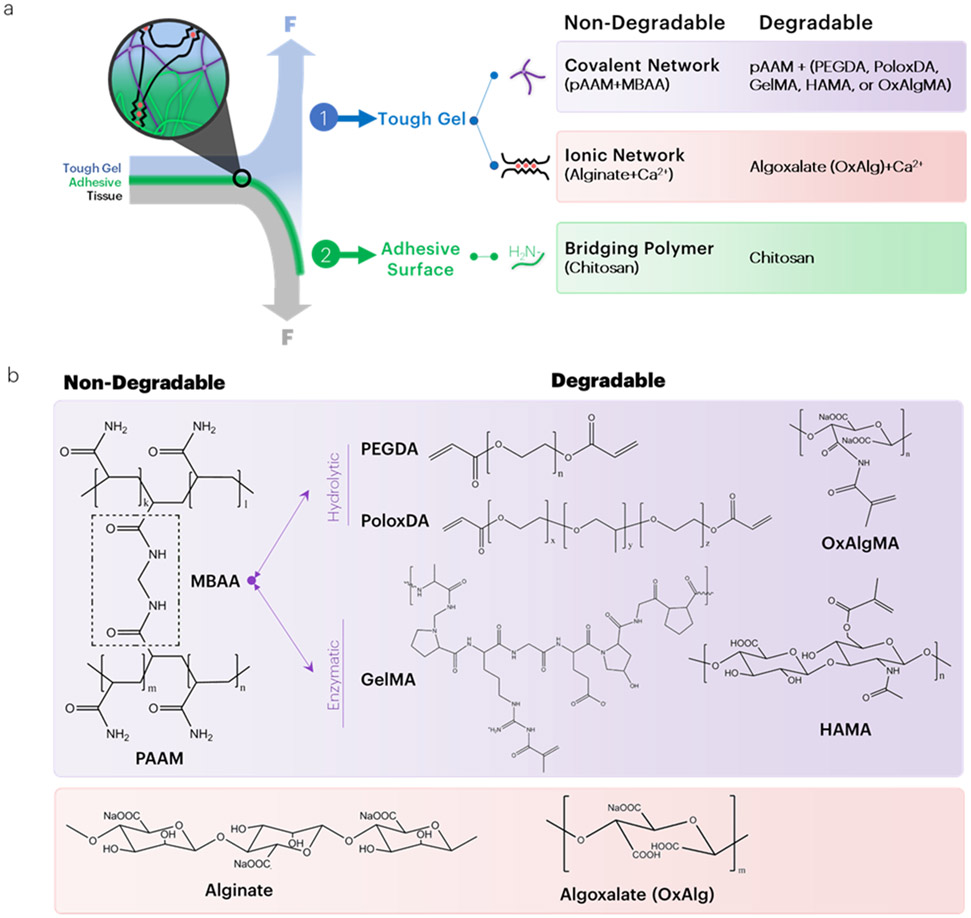
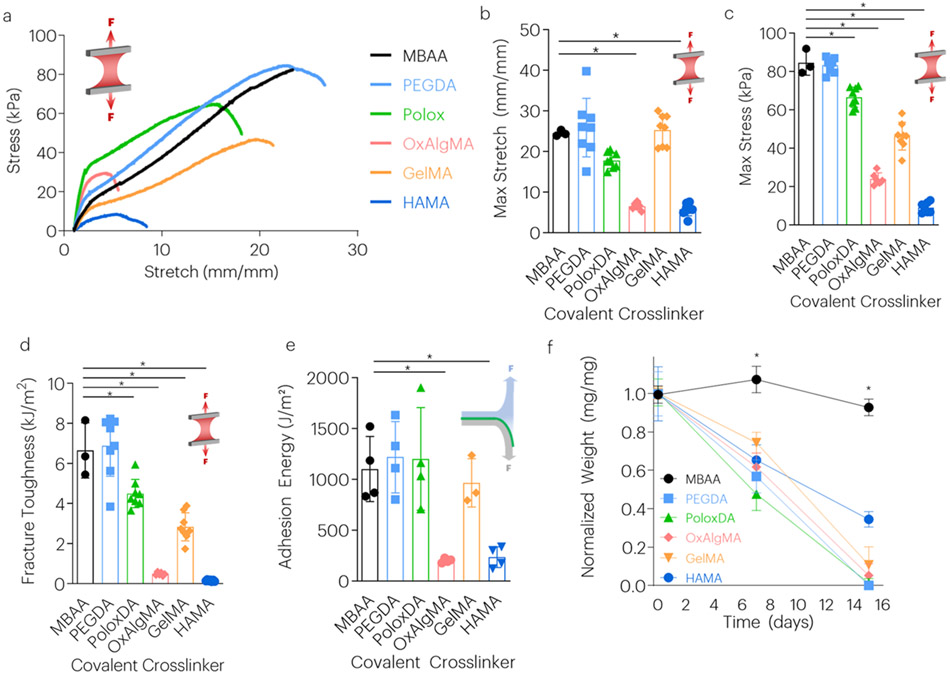
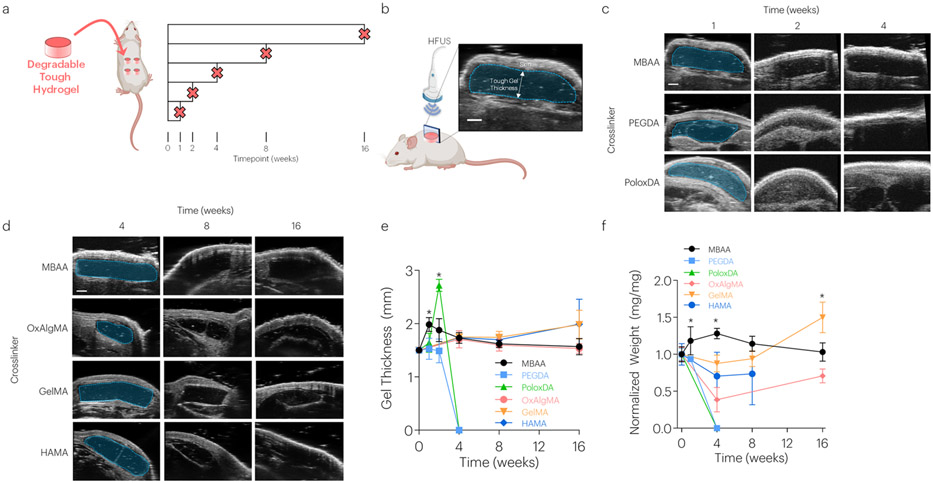
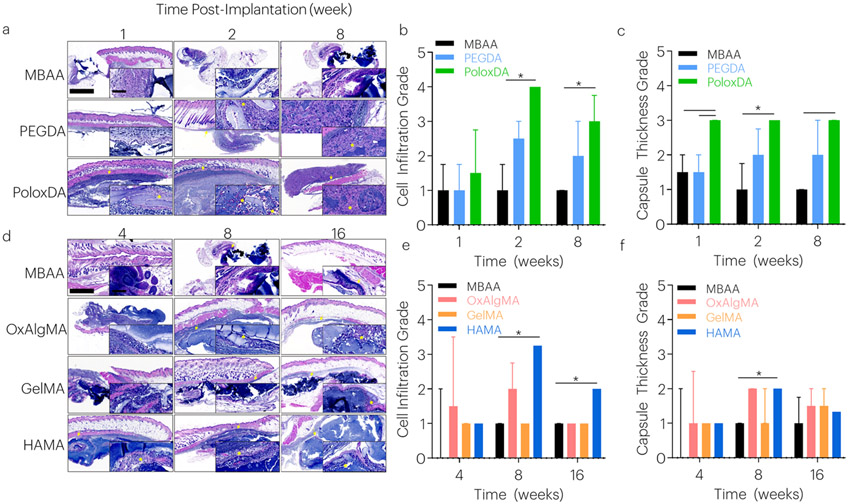
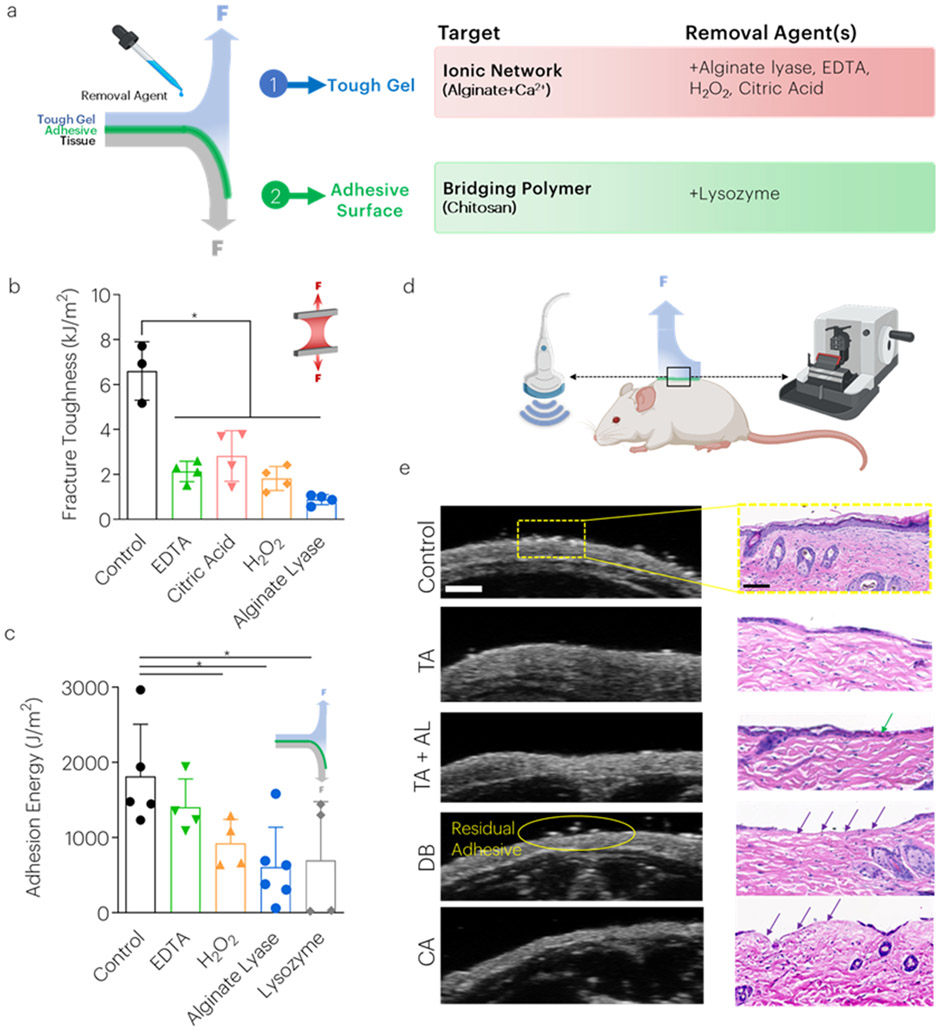
The development of tough adhesive hydrogels has enabled unprecedented adhesion to wet and moving tissue surfaces throughout the body, but they are typically composed of nondegradable components. Here, a family of degradable tough adhesive hydrogels containing ≈90% water by incorporating covalently networked degradable crosslinkers and hydrolyzable ionically crosslinked main-chain polymers is developed. Mechanical toughness, adhesion, and degradation of these new formulations are tested in both accelerated in vitro conditions and up to 16 weeks in vivo. These degradable tough adhesives are engineered with equivalent mechanical and adhesive properties to nondegradable tough adhesives, capable of achieving stretches >20 times their initial length, fracture energies >6 kJ m-2 , and adhesion energies >1000 J m-2 . All degradable systems show complete degradation within 2 weeks under accelerated aging conditions in vitro and weeks to months in vivo depending on the degradable crosslinker selected. Excellent biocompatibility is observed for all groups after 1, 2, 4, 8, and 16 weeks of implantation, with minimal fibrous encapsulation and no signs of organ toxicity. On-demand removal of the adhesive is achieved with treatment of chemical agents which do not cause damage to underlying skin tissue in mice. The broad versatility of this family of adhesives provides the foundation for numerous in vivo indications.
Keywords: adhesives; biodegradable materials; bioinspiration; biomaterials; hydrogels.
© 2021 Wiley-VCH GmbH.
Figures
Similar articles
-
Biodegradable, anti-adhesive and tough polyurethane hydrogels crosslinked by triol crosslinkers.J Biomed Mater Res A. 2019 Oct;107(10):2205-2221. doi: 10.1002/jbm.a.36730. Epub 2019 Jun 6. J Biomed Mater Res A. 2019. PMID: 31116494
-
Stretchable and Bioadhesive Gelatin Methacryloyl-Based Hydrogels Enabled by in Situ Dopamine Polymerization.ACS Appl Mater Interfaces. 2021 Sep 1;13(34):40290-40301. doi: 10.1021/acsami.1c10048. Epub 2021 Aug 19. ACS Appl Mater Interfaces. 2021. PMID: 34410697
-
Tough and On-Demand Detachable Wet Tissue Adhesive Hydrogel Made from Catechol Derivatives with a Long Aliphatic Side Chain.Adv Healthc Mater. 2023 Nov;12(29):e2301913. doi: 10.1002/adhm.202301913. Epub 2023 Aug 3. Adv Healthc Mater. 2023. PMID: 37533401
-
Specialty Tough Hydrogels and Their Biomedical Applications.Adv Healthc Mater. 2020 Jan;9(2):e1901396. doi: 10.1002/adhm.201901396. Epub 2019 Dec 17. Adv Healthc Mater. 2020. PMID: 31846228 Free PMC article. Review.
-
Bio-macromolecular design roadmap towards tough bioadhesives.Chem Soc Rev. 2022 Oct 31;51(21):9127-9173. doi: 10.1039/d2cs00618a. Chem Soc Rev. 2022. PMID: 36269075 Free PMC article. Review.
Cited by
-
Tough, Instant, and Repeatable Adhesion of Self-Healable Elastomers to Diverse Soft and Hard Surfaces.Adv Sci (Weinh). 2022 Apr;9(12):e2105742. doi: 10.1002/advs.202105742. Epub 2022 Feb 20. Adv Sci (Weinh). 2022. PMID: 35187853 Free PMC article.
-
Controlled Delivery of Corticosteroids Using Tunable Tough Adhesives.Adv Healthc Mater. 2023 Jan;12(3):e2201000. doi: 10.1002/adhm.202201000. Epub 2022 Nov 9. Adv Healthc Mater. 2023. PMID: 36285360 Free PMC article.
-
Coordinatively stiffen and toughen polymeric gels via the synergy of crystal-domain cross-linking and chelation cross-linking.Nat Commun. 2025 Jan 2;16(1):320. doi: 10.1038/s41467-024-55245-3. Nat Commun. 2025. PMID: 39746978 Free PMC article.
-
An Environmentally Stable, Biocompatible, and Multilayered Wound Dressing Film with Reversible and Strong Adhesion.Adv Healthc Mater. 2024 Dec;13(31):e2400827. doi: 10.1002/adhm.202400827. Epub 2024 Sep 12. Adv Healthc Mater. 2024. PMID: 39263787 Free PMC article.
-
Four-Dimensional Stimuli-Responsive Hydrogels Micro-Structured via Femtosecond Laser Additive Manufacturing.Micromachines (Basel). 2021 Dec 27;13(1):32. doi: 10.3390/mi13010032. Micromachines (Basel). 2021. PMID: 35056197 Free PMC article.
References
MeSH terms
Substances
Grants and funding
LinkOut - more resources
Full Text Sources
Other Literature Sources
