. 2021 Jul;27(7):776-791.
doi: 10.1111/cns.13638. Epub 2021 Mar 24.

Electroacupuncture facilitates the integration of a grafted TrkC-modified mesenchymal stem cell-derived neural network into transected spinal cord in rats via increasing neurotrophin-3

Affiliations

Electroacupuncture facilitates the integration of a grafted TrkC-modified mesenchymal stem cell-derived neural network into transected spinal cord in rats via increasing neurotrophin-3

Yang Yang et al. CNS Neurosci Ther. 2021 Jul.

Abstract

Aims: This study was aimed to investigate whether electroacupuncture (EA) would increase the secretion of neurotrophin-3 (NT-3) from injured spinal cord tissue, and, if so, whether the increased NT-3 would promote the survival, differentiation, and migration of grafted tyrosine kinase C (TrkC)-modified mesenchymal stem cell (MSC)-derived neural network cells. We next sought to determine if the latter would integrate with the host spinal cord neural circuit to improve the neurological function of injured spinal cord.

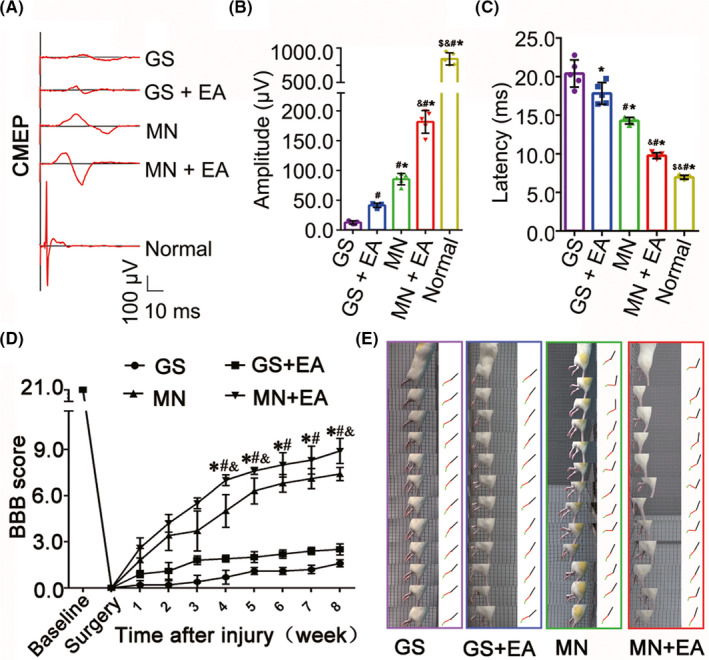
Methods: After NT-3-modified Schwann cells (SCs) and TrkC-modified MSCs were co-cultured in a gelatin sponge scaffold for 14 days, the MSCs differentiated into neuron-like cells that formed a MSC-derived neural network (MN) implant. On this basis, we combined the MN implantation with EA in a rat model of spinal cord injury (SCI) and performed immunohistochemical staining, neural tracing, electrophysiology, and behavioral testing after 8 weeks.

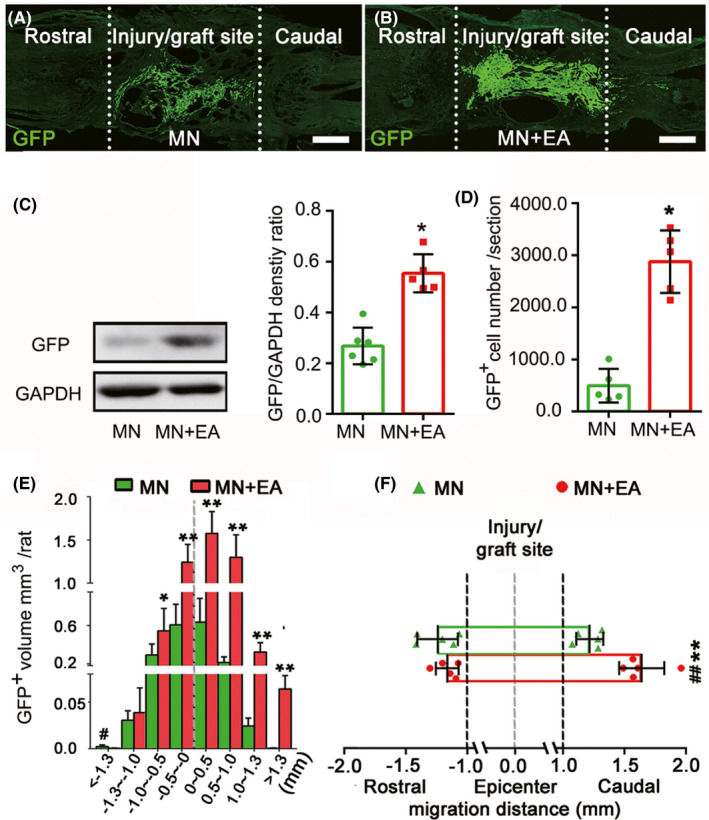
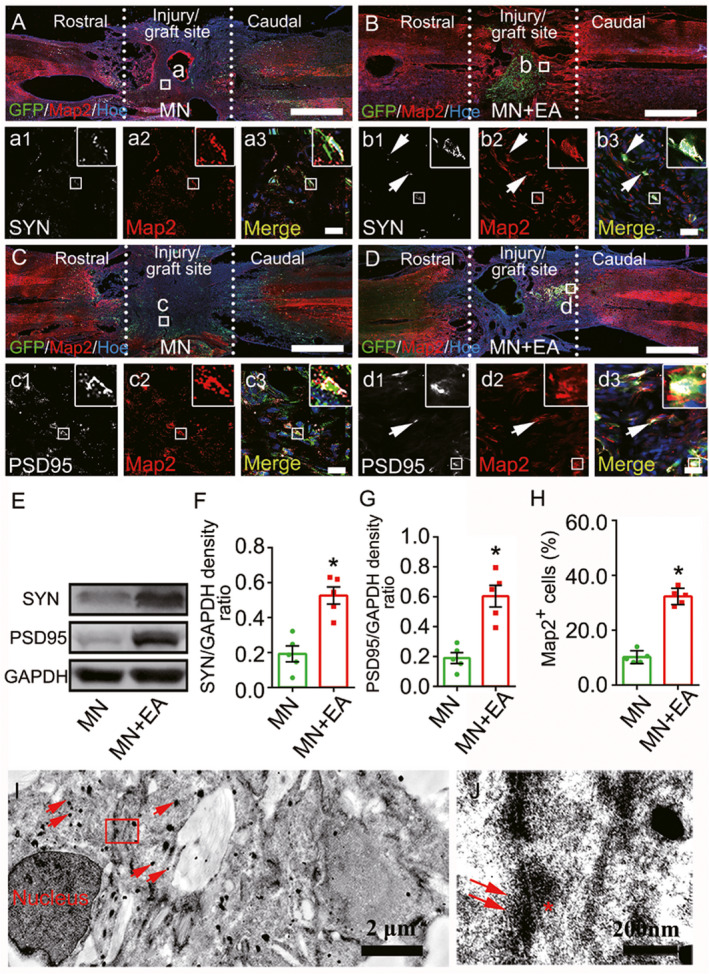
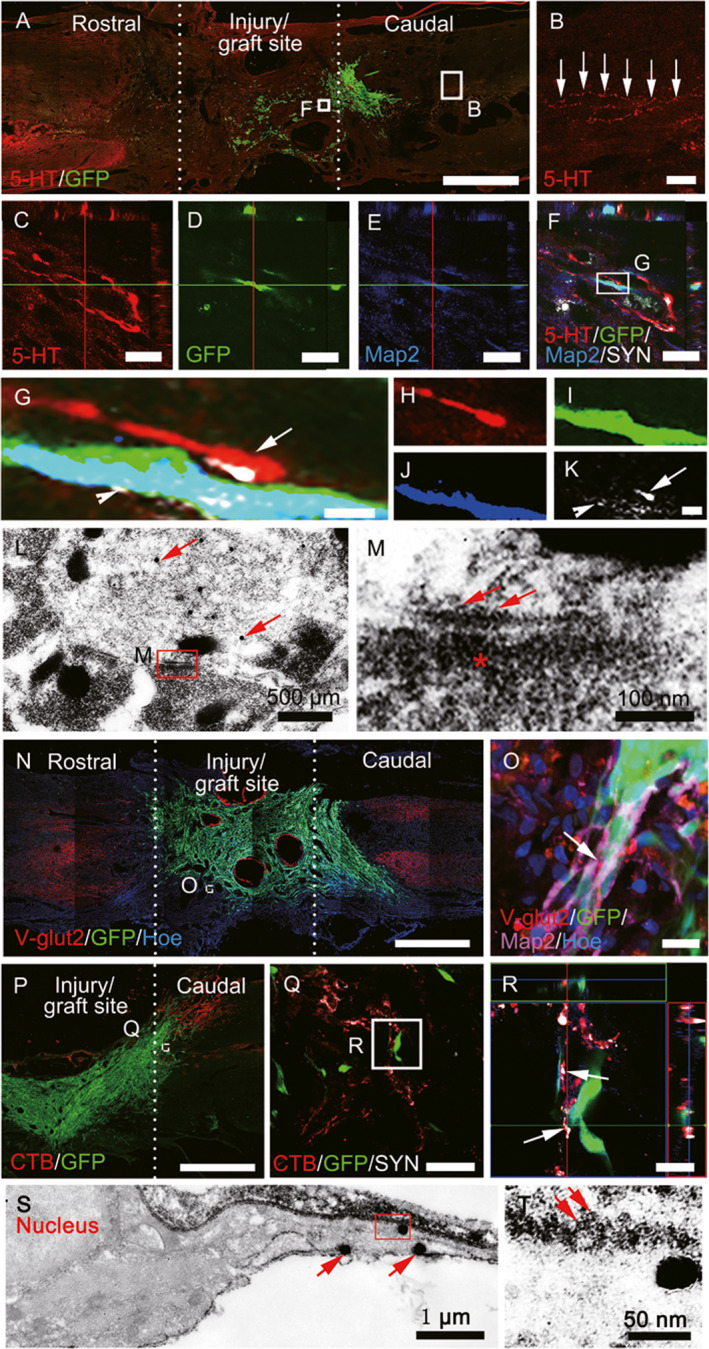
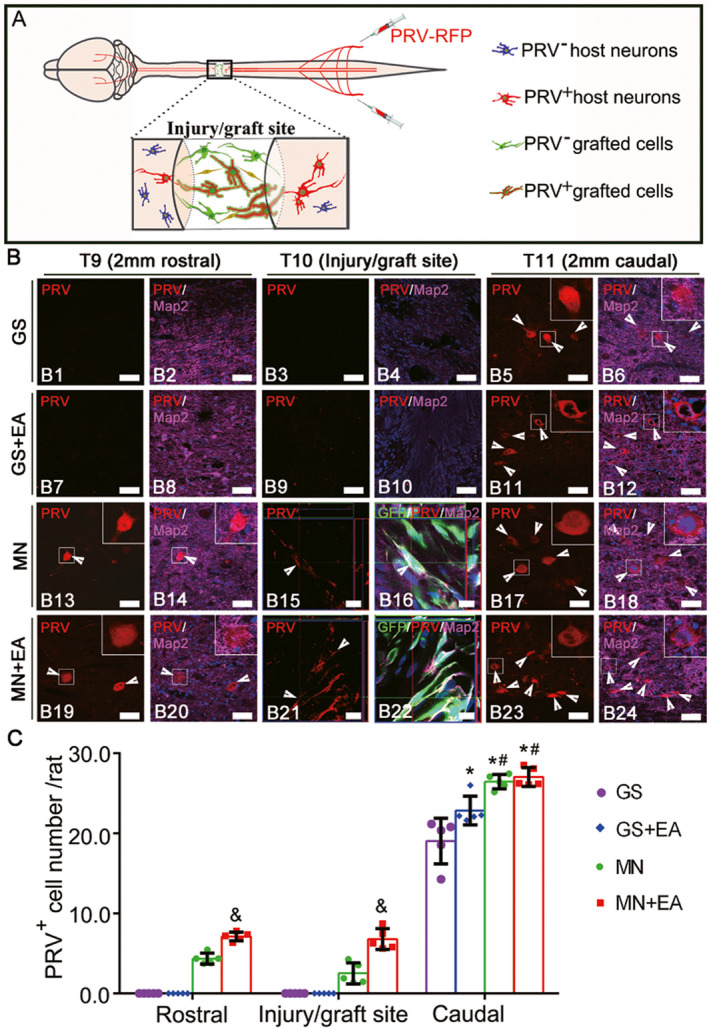
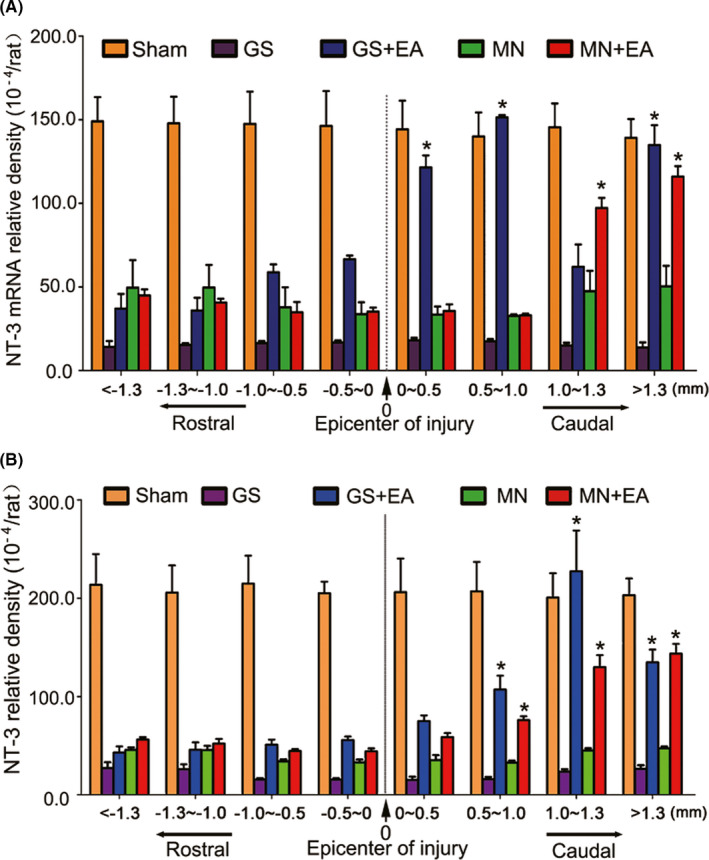
Results: Electroacupuncture application enhanced the production of endogenous NT-3 in damaged spinal cord tissues. The increase in local NT-3 production promoted the survival, migration, and maintenance of the grafted MN, which expressed NT-3 high-affinity TrkC. The combination of MN implantation and EA application improved cortical motor-evoked potential relay and facilitated the locomotor performance of the paralyzed hindlimb compared with those of controls. These results suggest that the MN was better integrated into the host spinal cord neural network after EA treatment compared with control treatment.

Conclusions: Electroacupuncture as an adjuvant therapy for TrkC-modified MSC-derived MN, acted by increasing the local production of NT-3, which accelerated neural network reconstruction and restoration of spinal cord function following SCI.

Keywords: electroacupuncture; implantation; mesenchymal stem cells; neural tracing; neurotrophin-3; spinal cord injury; tissue engineering neural network; tyrosine kinase C.


Conflict of interest statement

The authors have no financial conflicts of interest.

Figures

FIGURE 1
FIGURE 1
Electroacupuncture (EA) promoted the survival and migration of mesenchymal stem cell (MSC)‐derived cells in vivo. (A, B) Representative immunofluorescence images of injured spinal cord sections from the MSC‐derived neural network (MN, A) and MN+EA groups (B) at 8‐week post‐injury (wpi). Scale bars = 500 µm. Green fluorescent protein‐positive (GFP+) cells (green) are MSC‐derived cells from the grafted MN. (C) Western blot analysis of GFP expression in the injury/graft site in the MN+EA and MN groups at 2 wpi (n = 5/group). (D, E) Bar charts showing the number (D) and volume (E) of grafted GFP+ cells. Values represent the mean ± SD (n = 5/group, Student's t‐test, *p < 0.05). (F) Graphical representation showing the average maximum migration distance of GFP+ cells from the epicenter of grafted MN to the rostral and caudal sides in each group. The quantification of migration distance was performed using ImageJ. Values represent the mean ± SD (n = 5/group. *p < 0.05, **p < 0.01, and ## p < 0.01, determined by unpaired Student's t‐test). GAPDH, glyceraldehyde 3‐phosphate dehydrogenase
FIGURE 2
FIGURE 2
Mesenchymal stem cell (MSC)‐derived neuron‐like cells and synapse‐like structures in the graft site of the spinal cord at 8 wpi. (A–D) Representative images triple‐labeled with anti‐green fluorescent protein (GFP, green), microtubule‐associate protein (Map2, red; a2,b2,c2, and d2) and synapsin (SYN, white; a1 and b1) or postsynaptic density protein 95 (PSD95, white; c1 and d1) in the epicenter of the injury/graft site. The merged images show the GFP+ cells that colocalize with Map2/SYN (arrows, a3 and b3) or Map2/PSD95 (arrows, c3 and d3). The cell nuclei were counterstained with Hoechst33342 (Hoe). (E–G) Western blot analysis of SYN and PSD95 expression in the injury/graft site of the spinal cord. Values represent the mean ± SD (n = 5/group, *p < 0.05). (H) Bar chart showing the percentage of GFP+ cells that differentiated into Map2+ neuron‐like cells. Values represent the mean ± SEM (n = 5/group, *p < 0.05). (I, J) IEM revealed that a GFP+ cell, labeled by silver‐enhanced nanogold particles (arrows), formed a synapse‐like structure with another GFP+ cell. The structure was characterized by the presence of some synaptic vesicles (J, arrows) of varying diameters in the “presynaptic element,” electron dense material in the “postsynaptic element” (J, asterisk), and a “synaptic cleft” between the presynaptic and postsynaptic elements. Scale bars = 1 mm in (A–D); 20 µm in (a1)–(a3), (b1)–(b3), (c1)–(c3) and (d1)–(d3)
FIGURE 3
FIGURE 3
Mesenchyma stem cell (MSC)‐derived neuron‐like cells integrated into host neural circuits. (A, B) A few 5‐hydroxytryptamine (5‐HT)+ nerve fibers regenerated into the injury/graft site of the spinal cord. (C–K) Green fluorescent protein (GFP)/5‐HT/microtubule‐associated protein 2 (Map2)/synaptophysin (SYN) quadruple‐labeled immunostaining showing 5‐HT+ axon terminals in close apposition to GFP/Map2‐positive neuron‐like cells. (G–K) Representative magnified images of the boxed area in (F), quadruple‐labeled with anti‐5‐HT (red, H), GFP (green, I), Map2 (blue, J), and SYN (white, H and K), and their merged image (H). (L) Immunoelectron microscopy (IEM) revealed that 5‐HT+ axons stained with silver‐enhanced nanogold particles (arrows) formed synapse‐like structures with transplanted GFP‐positive cells (stained by 3, 3′‐diaminobenzidine [DAB]). The synapse‐like structures are characterized by the presence of some “synaptic vesicles” (arrows) of varying diameters in the cytoplasm of one of the processes in (M), electro‐dense material in the “postsynaptic element” (asterisk) in (M), and a narrow intercellular space between these elements. (N) and (O) Some vesicular glutamine transporter 2 (V‐Glut2)+ boutons (R, arrows) made contacts with GFP+/Map2+ neuron‐like cells in the injury/graft site of the spinal cord. (P–R) CTB+ ascending nerve fibers (Q) contacted GFP+ cells, featuring bouton‐like terminals (R). (S, T) IEM revealed that GFP+ cells stained with silver‐enhanced nanogold particles (S, arrows) could form synapse‐like structures with host axons (DAB+, arrows, T). Scale bars = 1 mm in (A), (N), and (P); 100 µm in (B); 50 µm in (Q); 20 µm in (C)–(F), (O), and (R); 1 µm in (G)–(K)
FIGURE 4
FIGURE 4
Pseudorabies virus (PRV) retrograde transsynaptic labeling confirmed the integration of transplanted mesenchymal stem cell (MSC)‐derived neuron‐like cells into the host spinal cord neuronal circuit. (A) A schematic diagram showing that PRV that was injected into the sciatic nerve was transported from the caudal area to the rostral area through the injury/graft site of the spinal cord. (B) Representative images showing the host neurons or MSC‐derived neuron‐like cells retrogradely labeled with PRV (red, arrowheads) in the rostral and caudal regions relative to the graft tissue of spinal cord in the GS group (B1–B6), GS+EA group (B7–B12), MN group (B13–B18) and MN+EA group (B19–B24). The cell nuclei were counterstained with Hoechst33342 (Hoe). (C) Bar chart showing the number of PRV+ neurons in the T9, T10, and T11 areas of the four groups. Values represent the mean ±SD. n = 5/group. *p < 0.05, compared with the GS group, # p < 0.05, compared with the GS+EA group, and & p < 0.05, compared with the MN group by one‐way ANOVA with LSD‐t. Green fluorescent protein (GFP, green), PRV (red), microtubule‐associated protein (Map2, white), and Hoe (blue). Scale bars =50 µm in (B1)–(B14), (B17)–(B20), (B23), and (B24); 10 µm in (B15) and (B16), (B21), and (B22). GS: gelatin sponge scaffold with no cells; GS+EA: GS combined electroacupuncture; MN: MSC‐derived neural network; MN+EA: MN combined with electroacupuncture
FIGURE 5
FIGURE 5
Outcomes of the BBB locomotion assessment, grid climb test, and electrophysiology. (A) Cortical motor‐evoked potentials (CMEPs) were obtained by electrophysiological analysis in the GS, GS+EA, MN, and MN+EA groups. (B, C) Bar charts of the amplitude (B) and latency (C) of CMEPs, showing the higher amplitudes and shorter latencies of the CMEPs in the MN+EA group compared with the GS (*p < 0.05), GS+EA (# p < 0.05), and MN (& p < 0.05) groups. Values represent the mean ±SD (n = 5/group; one‐way ANOVA with LSD‐t). (D) Comparison of Basso, Beattie, and Bresnahan (BBB) score for hindlimb locomotor function in the GS, GS+EA, MN, and MN+EA groups. Values represent the mean ± SD (n = 10/group; one‐way ANOVA). *p < 0.05 compared with the GS group, # p < 0.05 compared with the GS+EA group, and & p < 0.05 compared with the MN group, by one‐way ANOVA. (E) Grid climb test was performed in the GS, GS+EA, MN, and MN+EA groups at 8 wpi. GS: gelatin sponge scaffold with no cells; GS+EA: GS combined electroacupuncture; MN: MSC‐derived neural network; MN+EA: MN combined with electroacupuncture
FIGURE 6
FIGURE 6
The density of neurotrophin‐3 (NT‐3) mRNA and protein in the injured spinal cord. (A) Bar charts displaying the relative densities of NT‐3 mRNA in eight regions in the rostral and caudal areas relative to the injury site of the spinal cord for five groups. The density of NT‐3 mRNA was significantly increased in the caudal site compared with the rostral area in the GS+EA and MN+EA groups. Values represent the mean ±SD (n = 5/group, *p < 0.05). (B) Bar charts showing the relative densities of NT‐3 protein expression in eight regions in the rostral and caudal areas relative to the injury site of the spinal cord for five groups. The density of NT‐3 protein was significantly increased in the caudal area compared with the rostral area in the GS+EA and MN+EA groups. Values represent the mean ±SD (n = 5/group, *p < 0.05). GS: gelatin sponge scaffold with no cells; GS+EA: GS combined electroacupuncture; MN: MSC‐derived neural network; MN+EA: MN combined with electroacupuncture

References

    1. Bradbury EJ, Burnside ER. Moving beyond the glial scar for spinal cord repair. Nat Commun. 2019;10:3879. - PMC - PubMed
    1. Fan C, Li X, Zhao Y, et al. Cetuximab and taxol co‐modified collagen scaffolds show combination effects for the repair of acute spinal cord injury. Biomaterials Sci. 2018;6:1723‐1734. - PubMed
    1. Olson L. Combinatory treatments needed for spinal cord injury. Exp Neurol. 2013;248:309‐315. - PubMed
    1. Du BL, Xiong Y, Zeng CG, et al. Transplantation of artificial neural construct partly improved spinal tissue repair and functional recovery in rats with spinal cord transection. Brain Res. 2011;1400:87‐98. - PubMed
    1. Wu H, Ding L, Wang Y, et al. MiR‐615 regulates NSC differentiation in vitro and contributes to spinal cord injury repair by targeting LINGO‐1. Mol Neurobiol. 2020;57:3057‐3074. - PubMed

Publication types

MeSH terms