. 2021 Jul 19;33(6):1980-1996.
doi: 10.1093/plcell/koab090.

Cytoplasmic HYL1 modulates miRNA-mediated translational repression

Affiliations

Cytoplasmic HYL1 modulates miRNA-mediated translational repression

Xi Yang et al. Plant Cell. .

Abstract

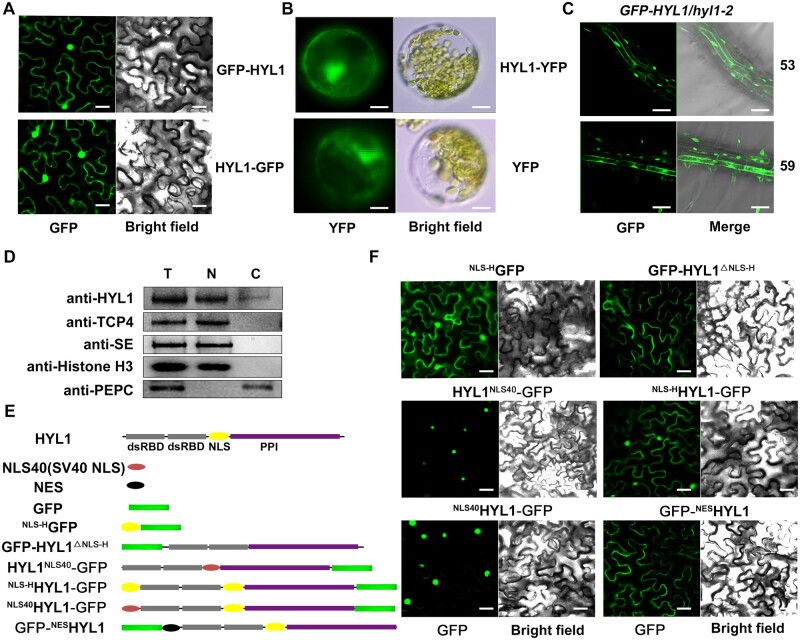
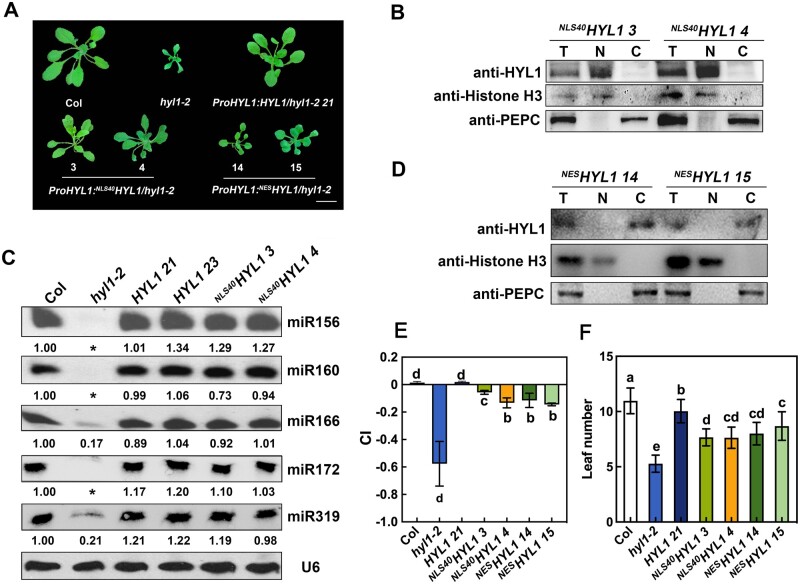
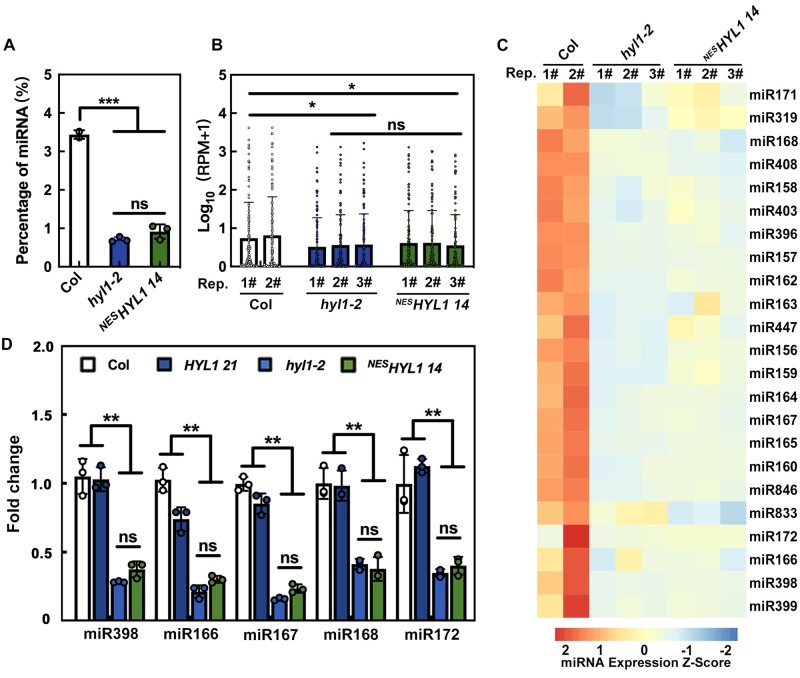
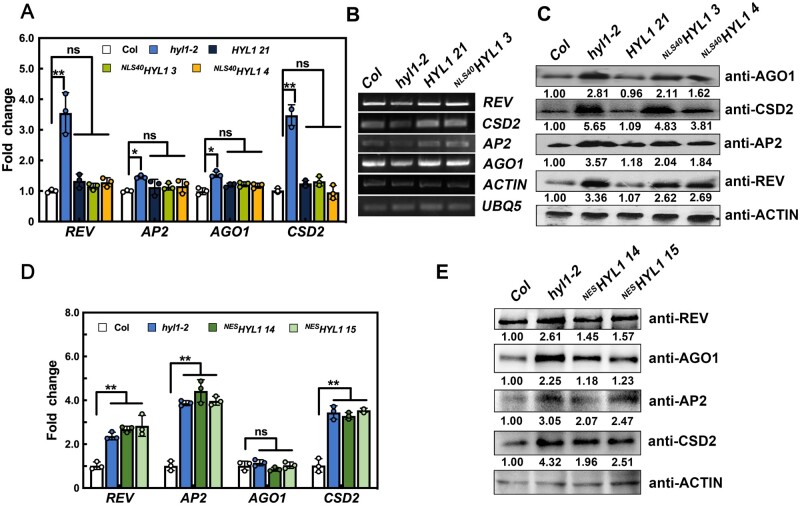
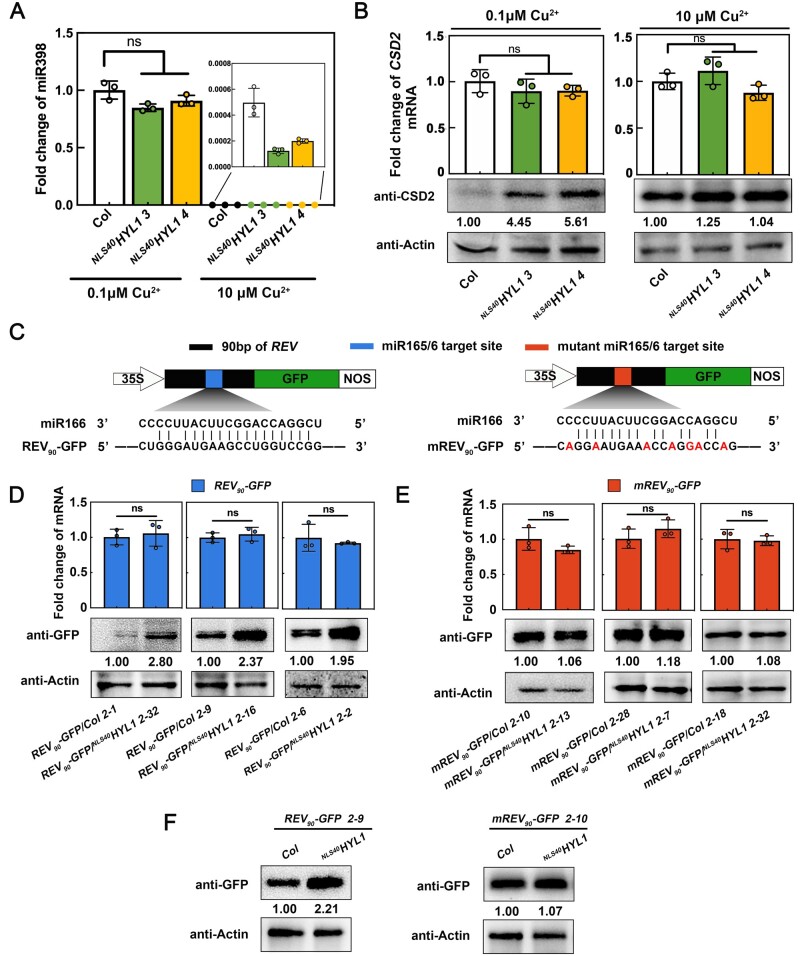
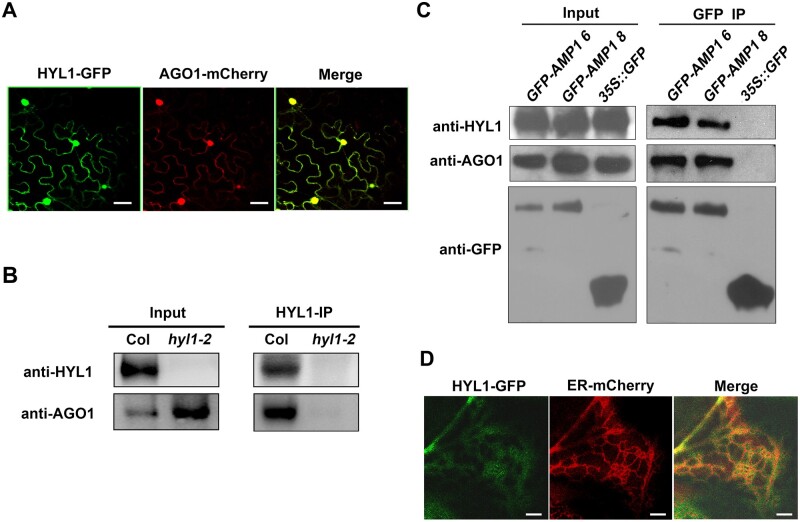
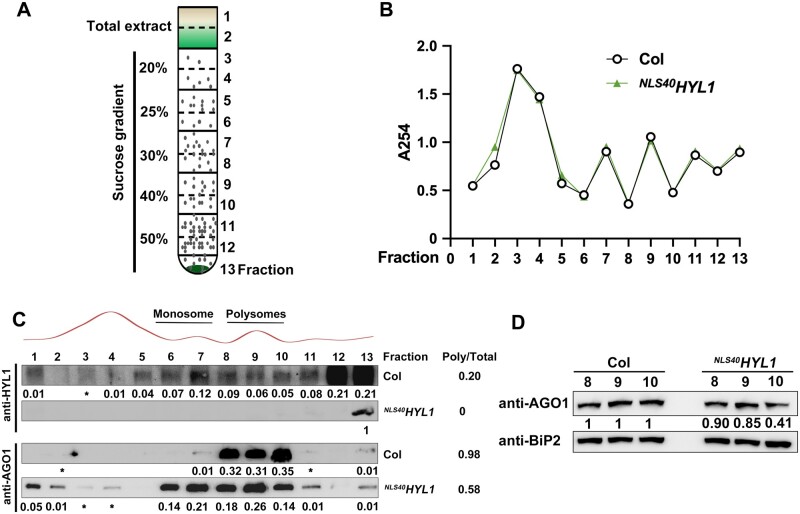
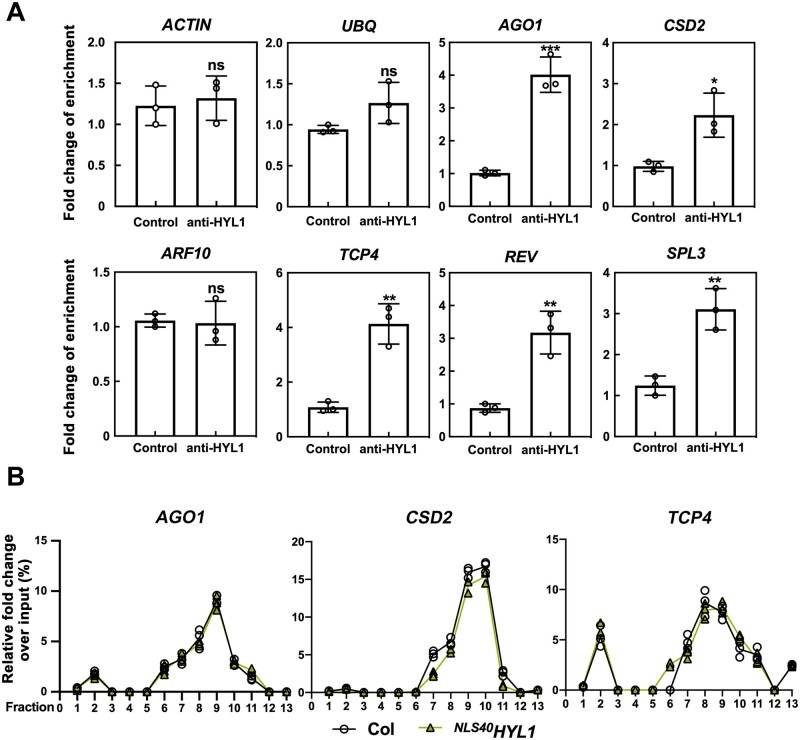
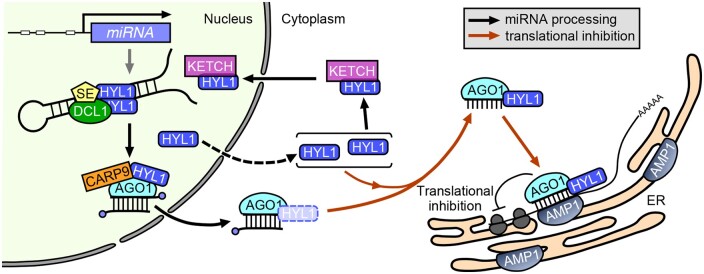
MicroRNAs (miRNAs) control various biological processes by repressing target mRNAs. In plants, miRNAs mediate target gene repression via both mRNA cleavage and translational repression. However, the mechanism underlying this translational repression is poorly understood. Here, we found that Arabidopsis thaliana HYPONASTIC LEAVES1 (HYL1), a core component of the miRNA processing machinery, regulates miRNA-mediated mRNA translation but not miRNA biogenesis when it localized in the cytoplasm. Cytoplasmic HYL1 localizes to the endoplasmic reticulum and associates with ARGONAUTE1 (AGO1) and ALTERED MERISTEM PROGRAM1. In the cytoplasm, HYL1 monitors the distribution of AGO1 onto polysomes, binds to the mRNAs of target genes, represses their translation, and partially rescues the phenotype of the hyl1 null mutant. This study uncovered another function of HYL1 and provides insight into the mechanism of plant gene regulation.


Figures

Figure 1
Figure 1
Subcellular localization of HYL1 and its various chimeric proteins. A, Subcellular localization of GFP-HYL1 and HYL1-GFP in N. benthamiana leaves. B, Subcellular localization of HYL1-YFP in Arabidopsis protoplasts. C, Subcellular localization of HYL1-GFP in the root of two independent Pro35S:GFP-HYL1/hyl1-2 transgenic lines. D, Immunoblot analysis to detect HYL1 protein in the nuclear and cytoplasmic fractions of WT plant. T, N, and C represent total, nuclear, and cytoplasmic aliquots, respectively. E, Schematic diagrams of various HYL1 chimeric proteins. Grey block, HYL1 double-stranded RNA-binding domain; Yellow oval, NLS of HYL1 (NLS-H); Purple block, PPI domain of HYL1; Red oval, NLS of SV40 (NLS40); Black oval, NES; Green block, GFP protein. F, Localization of various HYL1 fusion constructs from (E) in N. benthamiana leaves. Scale bar, 30 μm in (A) and (F); 5 μm in (B); and 100 μm in (C).
Figure 2
Figure 2
Both nuclear and cytoplasmic HYL1 partially rescue the hyl1-2 phenotype. A, Phenotypes of transgenic plants expressing different HYL1 constructs at the rosette stage. Arabic numbers represent different transgenic lines. Scale bar, 1 cm. B, Immunoblot analysis to detect HYL1 protein in the nuclear and cytoplasmic fractions from the seedling of NLS40HYL1 transgenic plants. T, N, and C represent total, nuclear, and cytoplasmic aliquots, respectively. C, Northern blotting showing the accumulation of miRNAs in WT, hyl1-2, HYL1, and NLS40HYL1 transgenic plants. Asterisks repredcsents no band was observed. D, Immunoblotting to detect HYL1 protein in the nuclear and cytoplasmic fractions from the seedling of NESHYL1 transgenic plants. E, Quantification (Mean ± SD) showing the leaf CI of transgenic plants expressing different HYL1 constructs. The sixth rosette leaves of 4-week-old WT and transgenic plants were selected for CI measurement. n = 20. F, Quantification (mean ± SD) showing the leaf number of WT and different transgenic plants. n > 15. Statistically significant differences between groups were indicated by different letters. ANOVA, P < 0.05.
Figure 3
Figure 3
Cytoplasmic HYL1 is not sufficient for miRNA biogenesis. A, The percentage of miRNA reads in total clean reads of sRNA sequencing. B, The global version of miRNA abundance in WT, hyl1-2, and NESHYL1 14 plants. C, The heat map showing the z-score (accumulation level, see “Materials and methods” section for details) of some general miRNAs in WT, hyl1-2, and NESHYL1 14 plants. D, RT-qPCR showing the relative expression levels of miRNA in WT and different transgenic plants. P-values were calculated with a two-tailed Student’s t test, *P < 0.05, **P < 0.01, ***P < 0.001. ns, no significance. Rep, replicates. Quantification is presented as mean ± SD.
Figure 4
Figure 4
Translational inhibition of miRNA-targeted genes by cytoplasmic HYL1. A, The relative expression levels of miRNA-targeted mRNAs in WT, hyl1-2, HYL1, and NLS40HYL1 transgenic plants. B, 5′ RACE RT-PCR showing the accumulation of the 3′ fragments generated by miRNA-guided cleavage of target mRNAs. UBQ5 and ACTIN were used as loading controls. C, Immunoblotting showing the levels of target proteins in WT, hyl1-2, HYL1, and NLS40HYL1 transgenic plants. D, The relative expression levels of miRNA-targeted mRNAs in WT, hyl1-2, and NESHYL1 transgenic plants. E, Immunoblotting showing the levels of target proteins in WT, hyl1-2, and NESHYL1 transgenic plants. P-values were calculated with a two-tailed Student’s t test, *P < 0.05, **P < 0.01. ns, no significance. Quantification of the RT-qPCR is presented as Mean ± SD.
Figure 5
Figure 5
Cytoplasmic HYL1 influences translational repression in a miRNA-dependent manner. A, RT-qPCR showing the relative expression levels of miR398 in WT and NLS40HYL1 plants under different Cu2+ conditions. B, The CSD2 mRNA and protein levels in WT and NLS40HYL1 plants under different Cu2+ conditions. C, The schematic diagram of reporter gene construction. Black block, 90 bp of REV; Blue block, miR165/166 target site; Red block, the mutant miR165/166 target site; White arrow, 35S promoter; Green block, GFP; White block, Terminator. D, The mRNA and protein levels of REV90-GFP in different background transgenic plants. E, The mRNA and protein levels of mREV90-GFP in different background transgenic plants. F, The protein levels of REV90-GFP or mREV90-GFP in WT or NLS40HYL1 plants carrying a transgene at the same genomic location. Quantification of the RT-qPCR is presented as Mean ± SD. P-values were calculated with two-tailed Student’s t test, *P < 0.05, **P < 0.01. ns, no significance.
Figure 6
Figure 6
Co-localization of HYL1 with AGO1 and AMP1 on the ER. A, The co-localization of HYL1-GFP and AGO1-mCherry in N. benthamiana leaves. B, Immunoblotting showing the interaction between HYL1 and AGO1 using Co-IP products from WT and hyl1-2. C, Immunoblotting showing the interactions among HYL1, AGO1, and GFP-AMP1 using Co-IP products from the transgenic lines 6 and 8 of Pro35S:GFP-AMP1/Col transgenic plants. D, The co-localization of HYL1-GFP and ER-mCherry in N. benthamiana leaves. Scale bar, 30 μm in (A) and 5 μm in (D);
Figure 7
Figure 7
Effect of cytoplasmic HYL1 on the enrichment of AGO1 in polysomes. A, A diagram showing the sucrose gradients used for the isolation of polysomes from wild-type and NLS40HYL1 plants. Sucrose gradients from 50% to 20% were injected into the tubes, and 13 fractions were collected for further analysis. B, The A254 absorption profiles of the 13 sucrose gradient fractions. C, Immunoblotting showing the accumulation of HYL1 and AGO1 proteins in the 13 sucrose gradient fractions. * indicates the intensity of the band is ˂0.01 compared to total abundance. D, Immunoblotting showing the accumulation of AGO1 proteins in fractions 8, 9, and 10 of sucrose gradients.
Figure 8
Figure 8
The binding of cytoplasmic HYL1 to miRNA-targeted mRNAs. A, RT-qPCR showing the enrichment of the mRNAs in cytoplasmic HYL1-IP product. Samples lacking antibodies were used as the controls. Quantifications are presented as Mean ± SD. P-values were calculated with two-tailed Student’s t test, *P < 0.05, **P < 0.01, ***P < 0.001. B, RT-qPCR showing the distribution of mRNAs along the sucrose gradients. Quantifications are presented as Mean ± SD.
Figure 9
Figure 9
An updated model for the functions of HYL1 in miRNA-mediated gene silencing. In plant, HYL1 functions in two distinct pathways: miRNA processing and translational repression. In the nucleus, HYL1 participates in miRNA processing along with DCL1 and SE. HYL1 protein is localized to polysomes on the ER where it associates with AGO1 and AMP1, and binds to the miRNAs and mRNAs of miRNA-targeted genes to form a miRNA-mediated effector complex.

Similar articles

Cited by

References

    1. Adam SA, Gerace L (1991) Cytosolic proteins that specifically bind nuclear location signals are receptors for nuclear import. Cell 66: 837–847 - PubMed
    1. Arteaga-Vazquez M, Caballero-Perez J, Vielle-Calzada JP (2006) A family of microRNAs present in plants and animals. Plant Cell 18: 3355–3369 - PMC - PubMed
    1. Aukerman MJ, Sakai H (2003) Regulation of flowering time and floral organ identity by a MicroRNA and its APETALA2-like target genes. Plant Cell 15: 2730–2741 - PMC - PubMed
    1. Bartel DP (2004) MicroRNAs: genomics, biogenesis, mechanism, and function. Cell 116: 281–297 - PubMed
    1. Baumberger N, Baulcombe DC (2005) Arabidopsis ARGONAUTE1 is an RNA Slicer that selectively recruits microRNAs and short interfering RNAs. Proc Natl Acad Sci USA 102: 11928–11933 - PMC - PubMed

Publication types

MeSH terms

LinkOut - more resources