. 2021 Jul;231(1):326-338.
doi: 10.1111/nph.17359. Epub 2021 May 1.

Mixotrophic growth of the extremophile Galdieria sulphuraria reveals the flexibility of its carbon assimilation metabolism

Affiliations

Mixotrophic growth of the extremophile Galdieria sulphuraria reveals the flexibility of its carbon assimilation metabolism

Gilles Curien et al. New Phytol. 2021 Jul.

Abstract

Galdieria sulphuraria is a cosmopolitan microalga found in volcanic hot springs and calderas. It grows at low pH in photoautotrophic (use of light as a source of energy) or heterotrophic (respiration as a source of energy) conditions, using an unusually broad range of organic carbon sources. Previous data suggested that G. sulphuraria cannot grow mixotrophically (simultaneously exploiting light and organic carbon as energy sources), its photosynthetic machinery being repressed by organic carbon. Here, we show that G. sulphuraria SAG21.92 thrives in photoautotrophy, heterotrophy and mixotrophy. By comparing growth, biomass production, photosynthetic and respiratory performances in these three trophic modes, we show that addition of organic carbon to cultures (mixotrophy) relieves inorganic carbon limitation of photosynthesis thanks to increased CO2 supply through respiration. This synergistic effect is lost when inorganic carbon limitation is artificially overcome by saturating photosynthesis with added external CO2 . Proteomic and metabolic profiling corroborates this conclusion suggesting that mixotrophy is an opportunistic mechanism to increase intracellular CO2 concentration under physiological conditions, boosting photosynthesis by enhancing the carboxylation activity of Ribulose-1,5-bisphosphate carboxylase-oxygenase (Rubisco) and decreasing photorespiration. We discuss possible implications of these findings for the ecological success of Galdieria in extreme environments and for biotechnological applications.

Keywords: Galdieria sulphuraria; mixotrophy; photorespiration; photosynthesis; red algae.


Figures

Fig. 1
Fig. 1
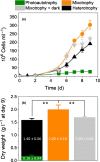
Growth enhancement of Galdieria sulphuraria SAG21.92 by reduced carbon sources is light dependent. (a) Growth curves. Data from three biological replicates ± SD. Error bars are shown when larger than the symbol size. Galdieria sulphuraria was grown in flasks at ambient CO2 in photoautotrophic (light only, 30 µmol photons m−2 s−1, green symbol), mixotrophic (30 µmol photons m−2 s−1 plus d‐sorbitol 25 mM, orange symbol) and heterotrophic (absence of light, presence of d‐sorbitol 25 mM, black symbol). The initial cell concentration was 1.5 × 10⁶ cells per milliliter. At day 5, the mixotrophic culture was split in two parts, and light was switched off in one culture (gray symbol). Growth was carried out at 42°C with shaking at 100 rpm, pH 2. (b) Dry weight estimated at day 9. Mixotrophic biomass (orange bar) exceeds the sum of photoautotrophic (green bar) and heterotrophic (black bar) biomass, highlighting the existence of a synergy under mixotrophic conditions. Data from three biological replicates ± SD. **Indicates that at the 0.01 level the means of the two populations (mixotrophy on one side; heterotrophy + photoautotrophy on the other one) means are statistically different (ANOVA test). The concentration of inorganic nitrogen was 20 mM, while that of inorganic phosphate was 5 mM.
Fig. 2
Fig. 2
In situ measurements of photosynthetic electron transfer rate (ETR) in photoautotrophic (light) and mixotrophic (light + 25 mM d‐sorbitol) Galdieria sulphuraria SAG21.92 cells and biomass production. Cells were inoculated at 3.5 × 10⁶ cell per milliliter and grown in a photobioreactor in the light (transmitted light 10 µmol photons m−2 s−1) and air before d‐sorbitol was added in the absence (heterotrophy, black) and in the presence of light (mixotrophy, orange). Light was increased every day to keep the transmitted light to a constant value of 10 µmol photons m−2 s−1. Growth was followed at 42°C and pH 2. (a, d, g) After 5 d of growth (i.e. 2 d after the addition of d‐sorbitol), ETR was measured directly on cultures within the photobioreactor, to avoid possible temperature stress. Measurements were done in air, in the absence (a, b) and presence (d, e) of respiratory inhibitors (SHAM (1 mM) and myxothiazol (10 µM), added 24 h before measurements), or in a CO2‐enriched (0.5%) atmosphere (g, h). (a, d, g) Photosynthetic electron transfer: data from three biological replicates ± SD. (b, e, h) Biomass production in photoautotrophic (green, data from 12 biological replicates ± SD), heterotrophic (black, data from eight biological replicates ± SD) and mixotrophic (orange, data from eight biological replicates ± SD) conditions, respectively. Cells were collected after 7 d of growth (i.e. 4 d after addition of d‐sorbitol). (c, f, i) Sketches representing possible CO2 sources for photosynthesis in the three examined conditions. **Indicates that at the 0.01 level the means of the two populations (mixotrophy on one side; heterotrophy + photoautotrophy on the other one) means are statistically different (ANOVA test).
Fig. 3
Fig. 3
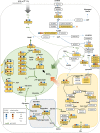
Synthesis of proteomic changes between phototrophic, mixotrophic and heterotrophic growth conditions of Galdieria sulphuraria SAG21.92. Plastid is indicated in green, cytosol in white, mitochondrion in orange and peroxisome in gray. Proteins are identified by their SwissProt accessions; boxes on top of protein names represent fold‐changes (protein average abundance in one condition was compared with the average abundance of the other two conditions – left photoautotrophy, middle mixotrophy, right heterotrophy). Proteins displaying statistically significant changes (see Methods section) are highlighted in yellow. They include proteins involved in CCM (pyruvate phosphate dikinase‐M2XY57, carbonic anhydrase‐M2XTP2, PEP carboxylase‐M2XIX2), which are much more abundant in photoautotrophic conditions than in mixotrophic or heterotrophic conditions. Enzymes involved in photorespiration – dashed arrows – (phosphoglycolate phosphatase‐M2XAQ1, glycolate oxidase‐M2WRR8, serine‐glyoxylate aminotransferase‐M2Y9J6, glycine decarboxylase P proteins‐M2X9U4, glycine/serine hydroxymethyltransferase‐M2XX08, hydroxypyruvate reductase‐M2XII5, glycerate kinase‐M2XRC5) follow the same pattern as carbon concentrating mechanism (CCM) enzymes. Conversely, pyruvate kinases (especially M2WVY6) are strongly repressed under phototrophic condition, possibly to maintain a high PEP‐oxaloacetate (OAA) pool for efficient fluxes in the carbon concentration cycle. Enzymes involved in photosynthesis are reduced under mixotrophic condition compared to photoautotrophic condition and strongly reduced under heterotrophic conditions. Mitochondrial respiratory proteins involved in the Krebs cycle or in ATP production are virtually not affected with the exception of fumarase and malic enzyme strongly reduced under phototrophic condition. Only representative proteins of the different complexes (e.g. photosynthesis, respiration) are represented. A more complete list of proteins can be found in Supporting Information Dataset S1. The complete set of proteomic data is available in Dataset S2.
Fig. 4
Fig. 4
Metabolic changes between phototrophic, mixotrophic and heterotrophic growth conditions of Galdieria sulphuraria SAG21.92. Non‐phosphorylated metabolites were analyzed by gas chromatography‐mass spectrometry (GC‐MS), phosphorylated metabolites were analyzed using ion chromatography‐mass spectrometry (IC‐MS). Quantification of metabolites is provided in Supporting Information Dataset S3. Green bar: photoautotrophy; orange bar: mixotrophy; black bar: heterotrophy. (a) Changes of metabolites involved in photorespiration. 2P‐glycolate as a photorespiration‐specific metabolite is boxed in red. Glycolate, glycine, serine and glycerate are transported between cellular compartments as indicated by dashed arrows. PGLP: phosphoglycolate phosphatase; GOX: glycolate oxidase; GGAT: glutamate:glyoxylate aminotransferase; GDC: glycine decarboxylase complex; SHMT: serine hydroxymethyltransferase; SGAT: serine:glyoxylate aminotransferase; HPR: hydroxypyruvate reductase; GLYK: glycerate kinase. (b) Metabolites involved in a putative C4‐type carbon concentrating mechanism (CCM). CA: carbonic anhydrase; PPC: phosphoenolpyruvate carboxylase; PEPCK: phosphoenolpyruvate carboxykinase; PPDK: pyruvate phosphate dikinase; PEP: phosphoenolpyruvate. (c) Metabolic changes of intermediates of upper glycolytic pathways (EMP, ED, PPP) and purine/pyrimidine metabolism. The pentose‐5P (ribulose‐5P, xylulose‐5P, ribose‐5P, marked with an asterisk) could not be distinguished and are plotted in a single boxed graph. SDH: sorbitol dehydrogenase; FRK: fructokinase; GPI: glucose‐6P isomerase; G6PD: glucose‐6P dehydrogenase; GND: 6‐phosphogluconate dehydrogenase; EBB: phosphogluconate dehydratase; EDA: KDPG aldolase; PFK: 6‐phosphofructokinase; FBPase: fructose‐1,6P bisphosphatase; FBA: fructose bisphosphate aldolase; TIM: triosephosphate isomerase; RPE: ribulose‐5P epimerase; RPI: ribulose‐5P isomerase; TKT: transketolase; TAL: transaldolase. The full list of metabolite changes can be found in Dataset S3. The Y axes in the graphs correspond to normalized peak areas and error bars represent the standard deviation of biological quadruplicates.
Fig. 5
Fig. 5
Incorporation of carbon derived from carbon‐13 (13C)‐labeled glucose into intermediates of the Calvin–Benson–Bassham (a) and tricarboxylic acid (b) cycles during mixotrophic cultivation of Galdieria sulphuraria SAG21.92 in two different CO2 concentrations. Incorporation rates are displayed as average number of labeled carbon atoms in each molecule (average exchange). Error bars represent the standard deviation of biological quadruplicates. Light orange: cells grown in ambient air (0.02% CO2). Dark orange cells grown in air supplied with 2% CO2. RuBP: ribulose 1,5‐bisphosphate; 3‐PGA: 3‐phosphoglycerate; 2‐PG: 2‐phosphoglycolate; BPG: 1,3‐bisphosphoglycerate; DHAP: dihydroxyacetone phosphate; GAP: glyceraldehyde 3‐phosphate; FBP: fructose 1,6‐bisphosphate; F6P: fructose 6‐phosphate; E4P: erythrose 4‐phosphate; Xu5P: xylulose 5‐phosphate; SBP: seduheptulose 1,7‐bisphosphate; S7P: seduheptulose 7‐phosphate; R5P: ribose 5‐phosphate; Ru5P: ribulose 5‐phosphate.

Similar articles

Cited by

References

    1. Allen GJ. 1959. Studies with Cyanidium caldarium, an anomalously pigmented chlorophyte. Archiv für Mikrobiologie 32: 270–277. - PubMed
    1. Avelange MH, Thiéry JM, Sarrey F, Gans P, Rébeillé F. 1988. Mass‐spectrometric determination of O2 and CO2 gas exchange in illuminated higher‐plant cells. Planta 183: 150–157. - PubMed
    1. Azúa‐Bustos A, González‐Silva C, Mancilla RA, Salas L, Palma RE, Wynne JJ, McKay CP, Vicuña R. 2009. Ancient photosynthetic eukaryote biofilms in an Atacama Desert coastal cave. Microbial Ecology 58: 485–496. - PubMed
    1. Barbier G, Oesterhelt C, Larson MD, Halgren RG, Wilkerson C, Garavito RM, Benning C, Weber APM. 2005. Comparative genomics of two closely related unicellular thermo‐acidophilic red algae, Galdieria sulphuraria and Cyanidioschyzon merolae, reveals the molecular basis of the metabolic flexibility of Galdieria sulphuraria and significant differences in carbohydrate metabolism of both algae. Plant Physiology 137: 460–474. - PMC - PubMed
    1. Barcyté D, Nedbalova L, Culka A, Kosek F, Jehlicka J. 2018. Burning coal spoil heaps as a new habitat for the extremophilic red alga Galdieria sulphuraria . Fottea 18: 19–29.

Publication types