. 2021 Jul;93(7):4496-4507.
doi: 10.1002/jmv.26967. Epub 2021 Apr 8.

Dissemination and evolution of SARS-CoV-2 in the early pandemic phase in South America

Affiliations

Dissemination and evolution of SARS-CoV-2 in the early pandemic phase in South America

Jonas Michel Wolf et al. J Med Virol. 2021 Jul.

Abstract

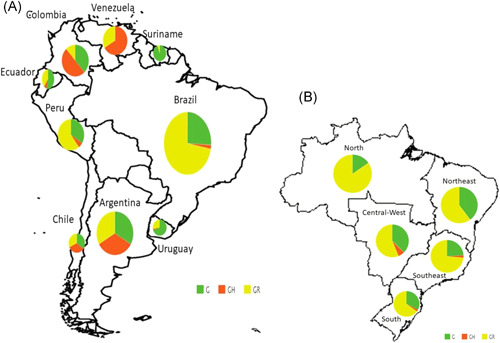
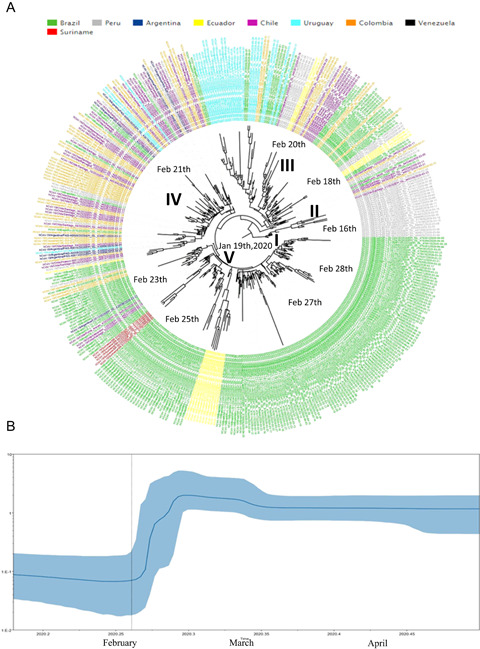
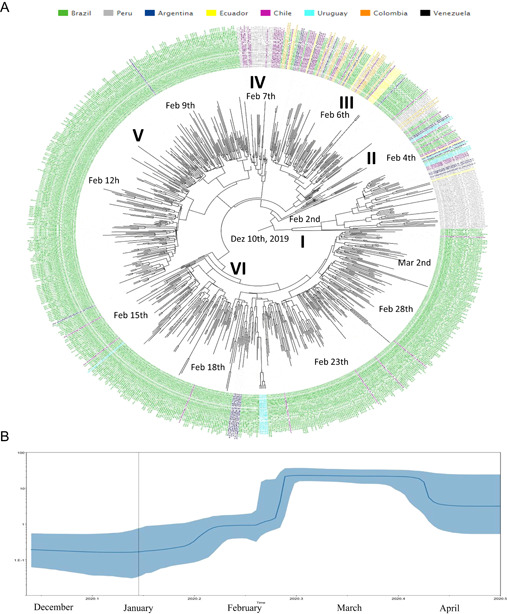
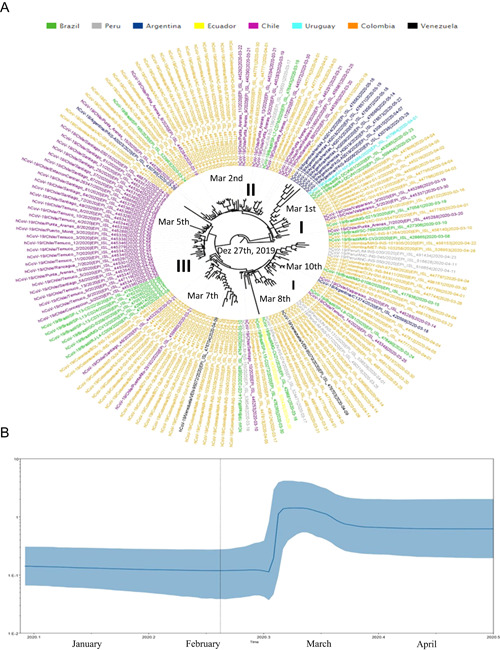
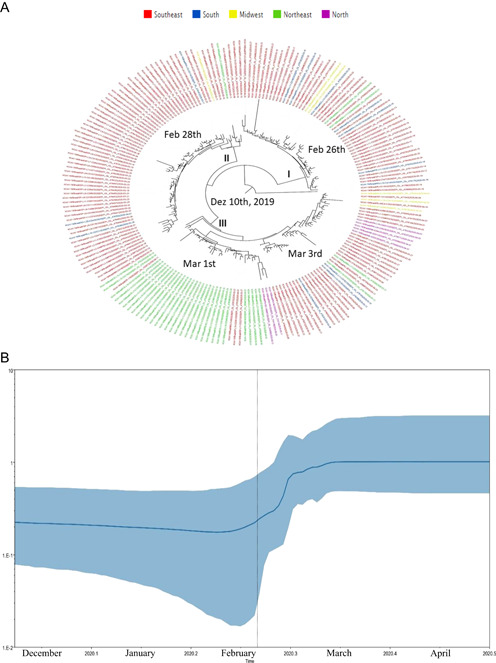
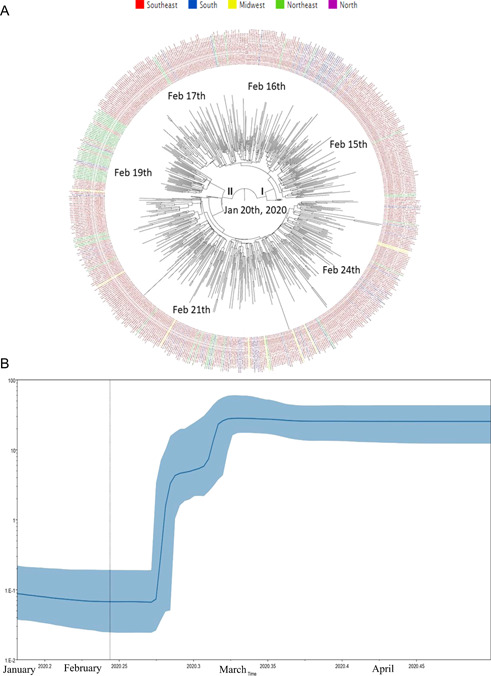
Severe acute respiratory syndrome coronavirus-2 (SARS-CoV-2) pandemic spread rapidly and this scenario is concerning in South America, mainly in Brazil with more than seven million cases of infection. Three major pandemic lineages/clades could be identified along with SARS-CoV-2 dissemination (G, GR, and GH) in the Americas. These clades differ according to their genomic characteristics, virulence, and spreading times. The present study describes the main clades and the respective temporal spreading analyses based on SARS-CoV-2 whole-genome sequences (WGS) from South America, obtained in the early pandemic phase (from March 1 to May 31 in 2020). SARS-CoV-2 WGSs with available information from country and year of sampling were obtained from different countries and the main clades were identified and analyzed independently with a Bayesian approach. The results demonstrated the prevalence of clades GR (n = 842; 54.6%), G (n = 529; 34.3%), and GH (n = 171; 11.1%). The frequencies of the clades were significantly different between South American countries. Clade G was the most prevalent in Ecuador, Suriname, and Uruguay, clade GR in Argentina, Brazil, and Peru, and clade GH in Colombia. The phylodynamic analysis indicated that all these main lineages increased viral spreading from February to early March and after an evolutionary stationary phase was observed. The decrease observed in the virus dissemination was directly associated to the reduction of social movement after March. In conclusion, these data demonstrated the current predominance of clades G, GR, and GH in South America because of the early dissemination of them in the first pandemic phase in South America.

Keywords: SARS coronavirus; dissemination; pandemic.


Conflict of interest statement

The authors declare that htere are no conflicts of interests.

Figures

Figure 1
Figure 1
Distribution of severe acute respiratory syndrome coronavirus‐2 (SARS‐CoV‐2) clades G, GR, and GH in (A) South American countries and in (B) Brazilian regions
Figure 2
Figure 2
(A) Time‐scaled maximum clade credibility tree from the evolutionary reconstruction by Bayesian analysis of SARS‐CoV‐2 clade G whole‐genome sequences from South American countries available in GISAID (from March 1 to May 31, 2020). The time of the most recent common ancestor (tMRCA) are demonstrated in the nodes with significant posterior probabilities (≥0.95). (B) Bayesian skyline plot (BSP) of SARS‐CoV‐2 clade G whole‐genome sequences obtained from GISAID. The effective number of infections is reported on the Y‐axis. The timeline is reported on the X‐axis. The colored area corresponds to the 95% credibility intervals of highest probability density (95% HPD). The vertical line indicate the 95% lower HPD (dotted) of the tree root. SARS‐CoV‐2, severe acute respiratory syndrome coronavirus‐2
Figure 3
Figure 3
(A) Time‐scaled maximum clade credibility tree from the evolutionary reconstruction by Bayesian analysis of SARS‐CoV‐2 clade GR whole‐genome sequences from South American countries available in GISAID (from 1 March to 31 May 2020). The tMRCA are demonstrated in the nodes with significant posterior probabilities (≥0.95). (B) BSP of SARS‐CoV‐2 clade GR whole‐genome sequences obtained from GISAID. The effective number of infections is reported on the Y‐axis. The timeline is reported on the X‐axis. The colored area corresponds to the 95% credibility intervals of HPD. The vertical line indicate the 95% lower HPD (dotted) of the tree root. BSP, Bayesian skyline plot; HPD, highest probability density; SARS‐CoV‐2, severe acute respiratory syndrome coronavirus‐2; tMRCA, time of the most recent common ancestor
Figure 4
Figure 4
(A) Time‐scaled maximum clade credibility tree from the evolutionary reconstruction by Bayesian analysis of SARS‐CoV‐2 clade GH whole‐genome sequences from South American countries available in GISAID (from March 1 to May 31, 2020). The tMRCA are demonstrated in the nodes with significant posterior probabilities (≥0.95). (B) BSP of SARS‐CoV‐2 clade GH whole‐genome sequences obtained from GISAID. The effective number of infections is reported on the Y‐axis. The timeline is reported on the X‐axis. The colored area corresponds to the 95% credibility intervals of HPD. The vertical line indicate the 95% lower HPD (dotted) of the tree root. BSP, Bayesian skyline plot; HPD, highest probability density; SARS‐CoV‐2, severe acute respiratory syndrome coronavirus‐2; tMRCA, time of the most recent common ancestor
Figure 5
Figure 5
Maximum clade credibility tree from the evolutionary reconstruction by Bayesian analysis of SARS‐CoV‐2 clade G (Panel A) whole‐genome sequences from Brazilian regions available in GISAID (from March 1 to May 31, 2020). The tMRCA are demonstrated in the nodes with significant posterior probabilities (≥0.95). Panel B showed BSP of SARS‐CoV‐2 whole‐genome sequences obtained from GISAID of clade G. The effective number of infections is reported on the Y‐axis. The timeline is reported on the X‐axis. The colored area corresponds to the 95% credibility intervals of HPD. The vertical line indicate the 95% lower HPD (dotted) of the tree root. BSP, Bayesian skyline plot; HPD, highest probability density; SARS‐CoV‐2, severe acute respiratory syndrome coronavirus‐2; tMRCA, time of the most recent common ancestor
Figure 6
Figure 6
Maximum clade credibility tree from the evolutionary reconstruction by Bayesian analysis of SARS‐CoV‐2 clade GR (Panel A) whole‐genome sequences from Brazilian regions available in GISAID (from March 1 to May 31, 2020). The tMRCA are demonstrated in the nodes with significant posterior probabilities (≥0.95). Panel B showed BSP of SARS‐CoV‐2 whole‐genome sequences obtained from GISAID of clade GR. The effective number of infections is reported on the Y‐axis. The timeline is reported on the X‐axis. The colored area corresponds to the 95% credibility intervals of HPD. The vertical line indicate the 95% lower HPD (dotted) of the tree root. BSP, Bayesian skyline plot; HPD, highest probability density; SARS‐CoV‐2, severe acute respiratory syndrome coronavirus‐2; tMRCA, time of the most recent common ancestor

Similar articles

Cited by

References

    1. Zhu N, Zhang D, Wang W, et al. China Novel Coronavirus Investigating and Research Team . A novel coronavirus from patients with pneumonia in China, 2019. N Engl J Med. 2020;382(8):727‐733. 10.1056/NEJMoa2001017 - DOI - PMC - PubMed
    1. Li X, Wang W, Zhao X, et al. Transmission dynamics and evolutionary history of 2019‐nCoV. J Med Virol. 2020;92(5):501‐511. 10.1002/jmv.25701 - DOI - PMC - PubMed
    1. Li Q, Guan X, Wu P, et al. Early transmission dynamics in Wuhan, China, of novel coronavirus‐infected pneumonia. N Engl J Med. 2020;382(13):1199‐1207. 10.1056/NEJMoa2001316 - DOI - PMC - PubMed
    1. GISAID Initiative. COVID‐19 dashboard by the Center for Systems Science and Engineering (CSSE) at John Hopkins University. 2020. https://gisanddata.maps.arcgis.com/apps/opsdashboard/index.html#/bda7594.... Accessed November 12, 2020.
    1. Castells M, Lopez‐Tort F, Colina R, Cristina J. Evidence of increasing diversification of emerging severe acute respiratory syndrome coronavirus 2 strains. J Med Virol. 2020;92(10):2165‐2172. 10.1002/jmv.26018 - DOI - PMC - PubMed

Publication types