

PTP-MEG2 regulates quantal size and fusion pore opening through two distinct structural bases and substrates
- PMID: 33764618
- PMCID: PMC8097337
- DOI: 10.15252/embr.202052141
PTP-MEG2 regulates quantal size and fusion pore opening through two distinct structural bases and substrates
Abstract
Tyrosine phosphorylation of secretion machinery proteins is a crucial regulatory mechanism for exocytosis. However, the participation of protein tyrosine phosphatases (PTPs) in different exocytosis stages has not been defined. Here we demonstrate that PTP-MEG2 controls multiple steps of catecholamine secretion. Biochemical and crystallographic analyses reveal key residues that govern the interaction between PTP-MEG2 and its substrate, a peptide containing the phosphorylated NSF-pY83 site, specify PTP-MEG2 substrate selectivity, and modulate the fusion of catecholamine-containing vesicles. Unexpectedly, delineation of PTP-MEG2 mutants along with the NSF binding interface reveals that PTP-MEG2 controls the fusion pore opening through NSF independent mechanisms. Utilizing bioinformatics search and biochemical and electrochemical screening approaches, we uncover that PTP-MEG2 regulates the opening and extension of the fusion pore by dephosphorylating the DYNAMIN2-pY125 and MUNC18-1-pY145 sites. Further structural and biochemical analyses confirmed the interaction of PTP-MEG2 with MUNC18-1-pY145 or DYNAMIN2-pY125 through a distinct structural basis compared with that of the NSF-pY83 site. Our studies thus provide mechanistic insights in complex exocytosis processes.
Keywords: PTP-MEG2; catecholamine; exocytosis; structure; tyrosine phosphorylation.
© 2021 The Authors.
Conflict of interest statement
The authors declare that they have no conflict of Interest.
Figures
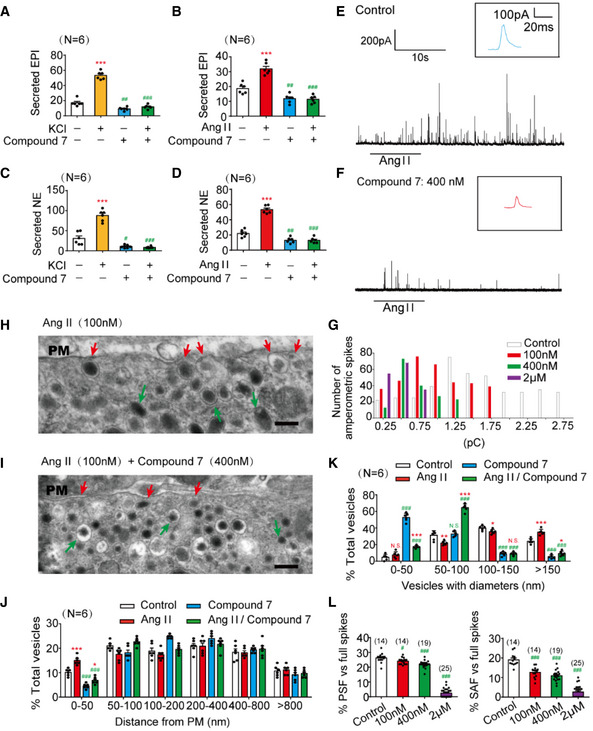
- A–D
The epinephrine (A, B) or norepinephrine (C, D) secreted from the adrenal medulla was measured by ELISA method after stimulation with high KCl (70 mM) (A, C) or angiotensin II (AngII, 100 nM) (B, D) for 1 min, with or without pre‐incubation with a specific PTP‐MEG2 inhibitor (400 nM) for 1 h.
- E, F
Amperometric spikes of primary mouse chromaffin cells induced by AngII (100 nM) were determined by electrochemical experiments after incubation with PTP‐MEG2 inhibitor at different concentrations.
- G
The distribution of the quantal size of AngII (100 nM)‐induced amperometric spikes by primary chromaffin cells after incubation with different concentrations of PTP‐MEG2 inhibitor. Histograms show the number of amperometric spikes of different quantal sizes.
- H, I
Secretory vesicles of primary chromaffin cells were examined by transmission electron microscopy after 100 nM AngII stimulation, with or without pre‐incubation with 400 nM Compound 7. Scale bars: (H, I), 150 nm. Red arrows indicate morphologically docked LDCVs, and green arrows stand for undocked LDCVs. PM represents plasma membrane.
- J
Vesicle numbers according to different distances from the plasma membrane were calculated in the presence or absence of 100 nM AngII or 400 nM Compound 7. PM represents plasma membrane.
- K
The percentage of vesicles with different diameters was measured after 100 nM AngII stimulation or incubation with 400 nM Compound 7. Compound 7 significantly decreased vesicle size under AngII stimulation.
- L
The percentage of pre‐spike foot (PSF) (left panel) and stand‐alone foot (SAF) (right panel) was calculated after incubation with the indicated concentrations of Compound 7.
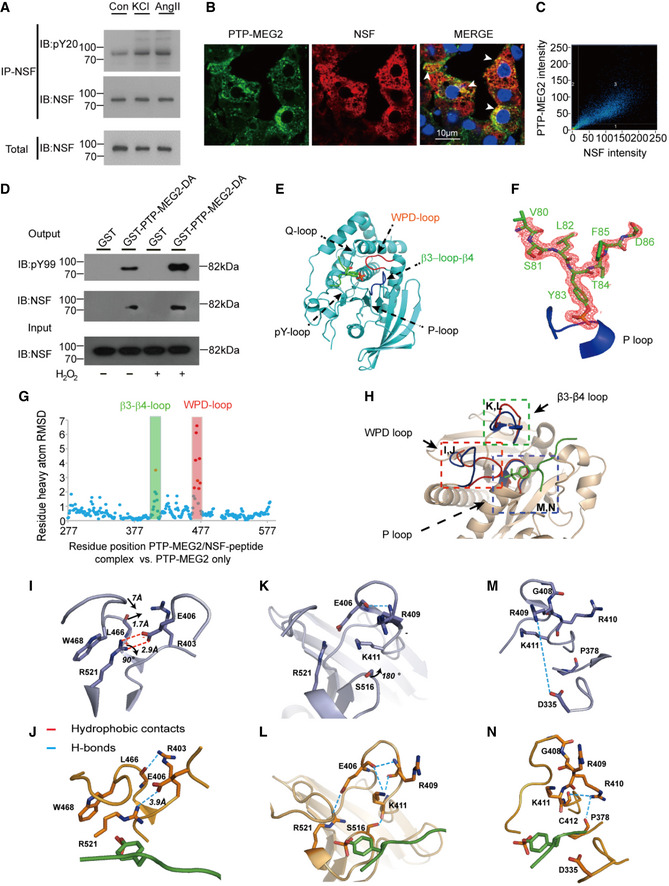
- A
NSF was phosphorylated after stimulation with AngII or KCl. Adrenal medulla cells were stimulated with 100 nM AngII or 70 mM KCl for 5 min and lysed. NSF was immunoprecipitated with a specific NSF antibody coated with Protein A/G beads. A pan‐phospho‐tyrosine antibody pY20 was used in Western blot to detect the tyrosine‐phosphorylated NSF in the adrenal medulla under different conditions.
- B
NSF was co‐localized with PTP‐MEG2 in the adrenal medulla. After stimulation with 100 nM AngII, NSF and PTP‐MEG2 in the adrenal medulla were visualized with immunofluorescence. White arrow stands for co‐localization of the PTP‐MEG2 and NSF.
- C
Analysis of PTP‐MEG2 and NSF fluorescence intensities by Pearson’s correlation analysis. Pearson’s correlation coefficient was 0.7.
- D
Phosphorylated NSF interacted with PTP‐MEG2. PC12 cells were transfected with FLAG‐NSF. After stimulation of the cells with 100nM AngII in the presence or absence of 100 μM H2O2 for 5 min (H2O2 was exploited to increase the overall tyrosine phosphorylation of the cellular proteins), the potential PTP‐MEG2 substrate in cell lysates was pulled down with GST‐PTP‐MEG2‐D470A or GST control.
- E
The overall structure of PTP‐MEG2‐C515A/D470A in complex with the NSF‐pY83 phospho‐segment.
- F
The 2Fo‐Fc annealing omit map (contoured at 1.0σ) around the NSF‐pY83 phospho‐segment. The P‐loop was highlighted in blue.
- G
Plot of distance RMSDs of individual residues between the crystal structures of the PTP‐MEG2/NSF‐pY83 phospho‐peptide complex (PDB: 6KZQ) and the PTP‐MEG2 native protein (PDB: 2PA5).
- H
Superposition of the PTP‐MEG2/NSF‐pY83 phospho‐peptide complex structure (red) on the PTP‐MEG2 native protein structure (PDB: 2PA5, blue). The structural rearrangement of the WPD loop and β3‐loop‐β4 is highlighted.
- I, J
The closure of the WPD loop and corresponding conformational changes in the inactive state (I) and the active state (J) of PTP‐MEG2. The rotation of R521 leads to the movement of W468 and a corresponding 7 Å movement of the WPD loop.
- K, L
The structural rearrangement of β3‐loop‐β4 of PTP‐MEG2 in the active state (L) compared with the inactive state (K). The disruption of the salt bridge between E406 and R521 contributed to the new conformational state of the N‐terminal of β3‐loop‐β4.
- M, N
The conformational change of the P‐loop of the inactive state (M) and the active state of PTP‐MEG2 in response to NSF‐pY83 segment binding (N). The disruption of the charge interaction between R409 and D335 resulted in the movement of the main chain from G408 to K411.
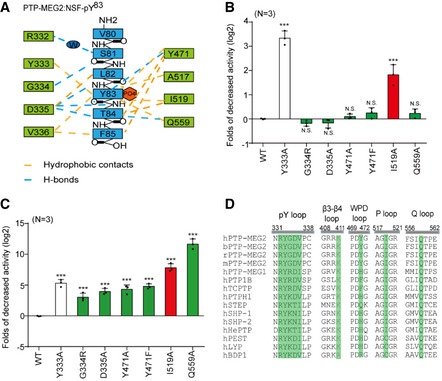
Schematic representation of interactions between PTP‐MEG2 and the NSF‐pY83 site.
Relative values of the decreased phosphatase activities of different PTP‐MEG2 mutants toward pNPP (p‐Nitrophenyl phosphate) compared with wild‐type PTP‐MEG2.
Fold change decreases in the phosphatase activities of different PTP‐MEG2 mutants toward the NSF‐pY83 phospho‐segment compared with wild‐type PTP‐MEG2.
Sequence alignment of PTP‐MEG2 from different species and with other PTP members. Important structural motifs participating in phosphatase catalysis or the recognition of the NSF‐pY83 site are shown, and key residues contributing to the substrate specificity are highlighted.
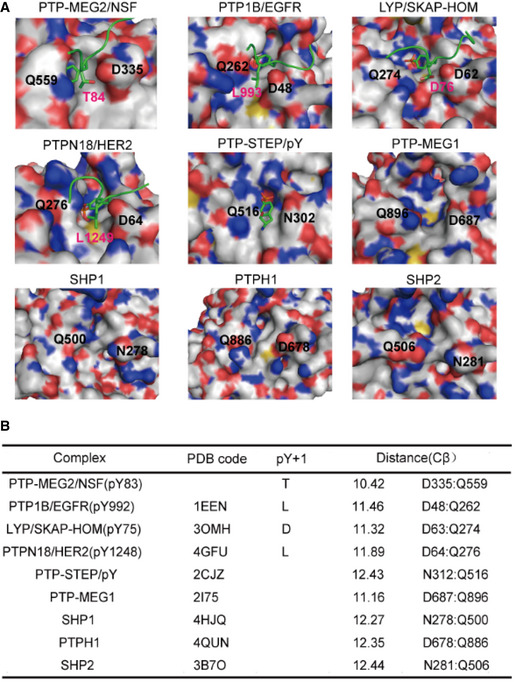
Surface representations of the complex structures of PTP‐MEG2‐C515A/D470A/NSF‐pY83, PTP1B‐C215A/EGFR‐pY992 (PDB: 1EEN), LYP‐C227S/SKAP‐HOM‐pY75 (PDB: 3OMH), PTPN18‐C229S/HER2‐pY1248 (PDB: 4GFU), and PTP‐STEP/pY (PDB: 2CJZ). Crystal structures of PTP‐MEG1 (PDB: 2I75), SHP1 (PDB: 4HJQ), PTPH1 (PDB: 4QUN), and SHP2 (PDB: 3B7O). The pY + 1 sites are highlighted.
Summary of the distance between the Cβ atoms of D335 and Q559 (corresponding to PTP‐MEG2 number) of the pY + 1 pocket in PTP‐MEG2 and other classical non‐receptor PTPs bearing the same residues at similar positions.
- A
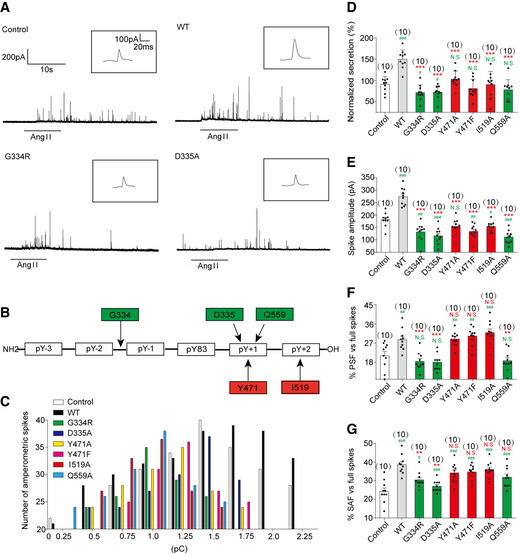
Primary mouse chromaffin cells were transduced with a lentivirus containing the gene for wild‐type PTP‐MEG2 or different mutants with a GFP tag at the C‐terminus. Positive transfected cells were confirmed with green fluorescence and selected for electrochemical analysis. Typical amperometric current traces evoked by AngII (100 nM for 10 s) in the control (transduced with control vector) (top left panel), WT (top right panel), G334R (bottom left panel), and D335A (bottom right panel) are shown.
- B
The schematic diagram shows key residues of PTP‐MEG2 defining the substrate specificity adjacent to the pY83 site of NSF.
- C
The distribution of the quantal size of chromaffin cells transduced with lentivirus containing the genes encoding different PTP‐MEG2 mutants.
- D
Statistical diagram of the quantal size in Fig 5A and Appendix Fig S6A–D. The secretion amount of each group was standardized with respect to the control group.
- E–G
Calculated parameters of secretory dynamics, including the spike amplitude (E), PSF frequency (F), and SAF frequency (G).
- A
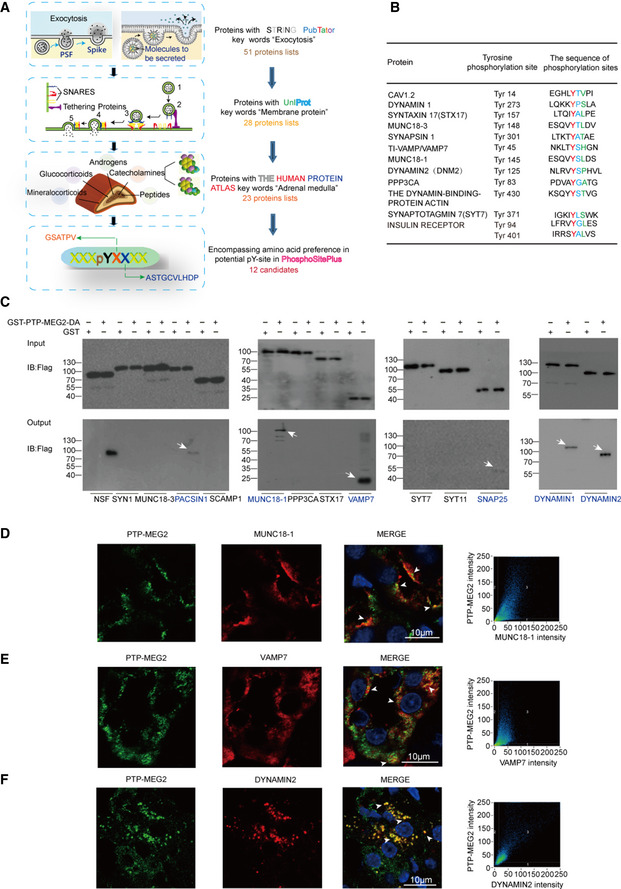
Flowchart for the workflow to predict the candidate substrates of PTP‐MEG2 during fusion pore initiation and expansion. A total of 51 proteins were enriched with the functional protein association network STRING and the text mining tool PubTator by searching the keywords “fusion pore”, “secretory vesicle” and “tyrosine phosphorylation”. These proteins were filtered with UniProt by selecting proteins located only in the membrane or vesicle, which resulted in 28 candidates. The Human Protein Atlas database was then applied to exclude proteins with no expression in the adrenal gland. Finally, we used the post‐translational‐motif database PhosphoSitePlus to screen candidate proteins with potential phospho‐sites that matched our sequence motif prediction at the pY + 1 or pY + 2 positions.
- B
After the bioinformatics analysis, a total of 12 candidate PTP‐MEG2 substrates that may participate in fusion pore initiation and expansion and their potential phospho‐sites were displayed.
- C
The GST pull‐down assay suggested that PACSIN1, MUNC18‐1, VAMP7, SNAP25, DYNAMIN1, and DYNAMIN2 directly interact with PTP‐MEG2. PC12 cells were transfected with plasmids of candidate substrates, including SYN1, MUNC18‐3, PACSIN1, SCAMP1, MUNC18‐1, PPP3CA, STX17, VAMP7, SYT7, SYT11, SNAP25, DYNAMIN1, and DYNAMIN2 stimulated with 100 nM AngII. The tyrosine phosphorylation of these proteins was verified by specific anti‐pY antibodies (Appendix Fig S8A–E). The potential substrates of PTP‐MEG2 in cell lysates were pulled down with a GST‐PTP‐MEG2‐D470A trapping mutant and then detected by Western blot. White arrow stands for Western blot band consistent with the predicted molecular weight of the potential PTP‐MEG2 substrate.
- D–F
Co‐immunostaining assays of PTP‐MEG2 with potential substrates in the adrenal medulla. MUNC18‐1, VAMP7, and DYNAMIN2 all showed strong co‐localization with PTP‐MEG2 after 100 nM AngII stimulation in the adrenal medulla. White arrow stands for co‐localization of PTP‐MEG2 with MUNC18‐1, VAMP7, or DYNAMIN2. Pearson’s correlation coefficients for (D, E, and F) were 0.61, 0.65, and 0.79 respectively. The co‐immunostaining results of PTP‐MEG2 with other potential substrates are shown in Appendix Fig S7.
- A
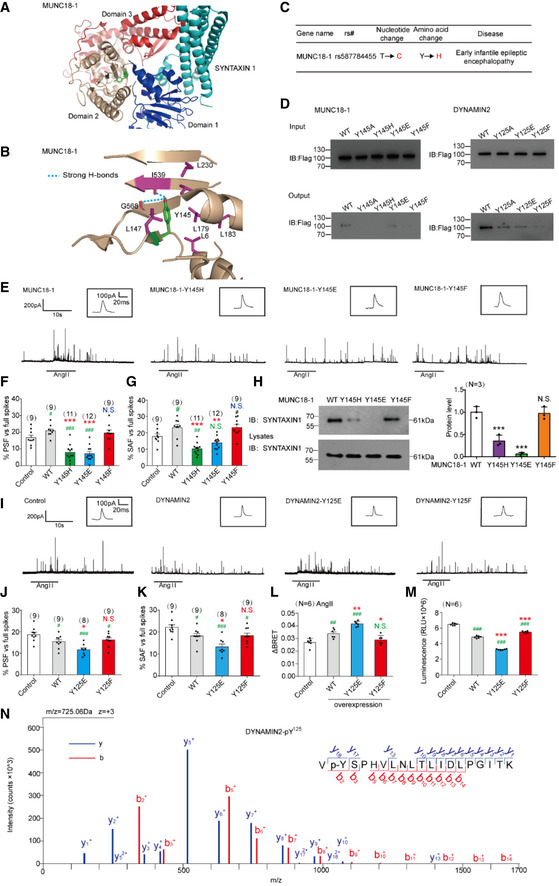
Structural representation and location of MUNC18‐1‐Y145 in the complex structure of MUNC18‐1‐SYNTAXIN1 (PDB: 3PUJ).
- B
Detailed structural representation of MUNC18‐1‐Y145 and its interactive residues. Y145 of MUNC18‐1 interacts with the main chain carboxylic oxygen of residues I539 and G568 and forms hydrophobic interactions with L6, I539, L147, L179, L183, and L230 to tether the arc shape of the three domains of MUNC18‐1 (PDB: 3PUJ).
- C
Association analysis of SNPs of MUNC18‐1 with human disease.
- D
Interactions of the PTP‐MEG2‐trapping mutants with the MUNC18‐1‐Y145 mutants and DYNAMIN2‐Y125 mutants. PC12 cells were transfected with FLAG‐MUNC18‐1‐Y145, FLAG‐DYNAMIN2‐Y125 and different mutations of the FLAG‐MUNC18‐1‐Y145A, Y145H, Y145E or Y145F, FLAG‐DYNAMIN2‐Y125A, Y125E, Y125F, 24 h before stimulation with 100 nM AngII, respectively. The cell lysates were then incubated with GST beads‐PTP‐MEG2‐D470A complex for 2 h with constant rotation. The potential PTP‐MEG2 substrates were pulled down by GST beads, and their levels were examined by the FLAG antibody with Western blot.
- E
Primary chromaffin cells were transduced with lentivirus containing the gene encoding wild‐type MUNC18‐1 or different mutants. These cells were stimulated with 100 nM AngII. The amperometric spikes were detected with electrochemical experiments. Typical amperometric traces are shown.
- F, G
The percentages of pre‐spike foot (F) and stand‐alone foot (G) for wild‐type MUNC18‐1 or different mutants were calculated.
- H
The MUNC18‐1‐Y145 mutations decreased the interaction between MUNC18‐1 and SYNTAXIN1. PC12 cells were transfected with plasmid encoding SYNTAXIN‐1. The proteins in cell lysates were pulled down with purified GST beads‐MUNC18‐1‐Y145 complex and the GST‐MUNC18‐1‐Y145H/E/F, and detected with SYNTAXIN1 antibody. The right histogram shows the quantified protein levels.
- I
Primary chromaffin cells were transduced with lentivirus containing the gene encoding wild‐type DYNAMIN2 or different mutants. These cells were stimulated with 100 nM AngII. The amperometric spikes were detected with electrochemical experiments. Typical amperometric traces are shown.
- J, K
The percentages of pre‐spike foot (J) and stand‐alone foot (K) for wild‐type DYNAMIN2 or different mutants were calculated.
- L
Plasmids encoding DYNAMIN2 (DYNAMIN2‐WT, DYNAMIN2‐Y125E or DYNAMIN2‐Y125F) and LYN‐YFP, AT1aR‐C‐RLUC were co‐transferred into HEK293 cells at 1:1:1 ratio. The BRET experiment was performed to monitor the mutation effects of DYNAMIN2 on AT1aR endocytosis in response to AngII (1 μM) stimulation.
- M
The GTPase assay was performed to detect the GTPase activity of the DYNAMIN2‐WT, DYNAMIN2‐Y125E, and DYNAMIN2‐Y125F. Purified DYNAMIN2 proteins were incubated with 5 μM GTP in the presence of 500 μM DTT for 90 min, followed by addition of GTPase‐Glo™ Reagent and detection reagent. The luminescence was measured after 37‐min incubation.
- N
Phosphorylated Y125 of DYNAMIN2 was identified by LC‐MS/MS. The PTP‐MEG2‐D470A trapping mutant was used to pull down potential PTP‐MEG2 substrates from the adrenal lysates after AngII stimulation. Trypsin‐digested potential PTP‐MEG2 substrates were subjected to LC‐MS/MS analysis. The doubly charged peptide with m/z 725.06 matches VYSPHVLNLTLIDLPGITK of DYNAMIN2 with Y125 phosphorylation.
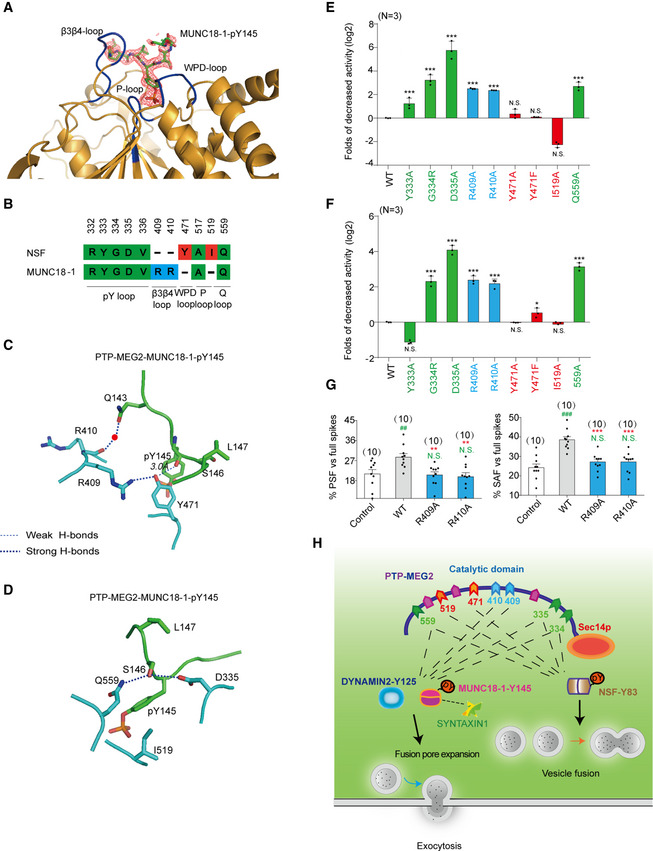
The 2Fo‐Fc annealing omit map (contoured at 1.0σ) around MUNC18‐1‐pY145 phospho‐segment.
Comparison of residues of PTP‐MEG2 interacting with NSF and MUNC18‐1. Amino acid residues of NSF and MUNC18‐1 are colored as follows: green, residues interacting with both NSF and MUNC18‐1; red, residues specifically contributing to NSF recognition; and blue, residues selectively contributing to MUNC18‐1 interaction.
The structural alteration of the interactions surrounding Y471 of PTP‐MEG2 with the MUNC18‐1‐pY145 site.
The structural alteration of the interactions surrounding I519 of PTP‐MEG2 with the MUNC18‐1‐pY145 site.
Relative phosphatase activities of different PTP‐MEG2 mutants toward the MUNC18‐1‐pY145 phospho‐segment compared with wild‐type PTP‐MEG2.
Relative phosphatase activities of different PTP‐MEG2 mutants toward the DYNAMIN 2‐pY125 phospho‐segment compared with wild‐type PTP‐MEG2.
The percentages of PSF and SAF for PTP‐MEG2‐R409A or R410A were calculated.
Schematic illustration of the PTP‐MEG2‐regulated processes of vesicle fusion and secretion in chromaffin cells via the dephosphorylation of different substrates with distinct structural basis. PTP‐MEG2 regulates vesicle fusion and vesicle size during the catecholamine secretion of adrenal gland by modulating the phosphorylation state of the pY83 site of NSF, which relies on the key residues G334, D335 (pY loop), Y471 (WPD loop), I519 (P‐loop), and Q559 (Q loop). PTP‐MEG2 regulates the fusion pore initiation and expansion procedures of catecholamine secretion by the adrenal gland (also designated as foot probability) by modulating the newly identified substrate MUNC18‐1 at its pY145 site and DYNAMIN2 at its pY125, through distinct structural basis from that of its regulation of NSF phosphorylation.
Similar articles
-
Control of vesicle fusion by a tyrosine phosphatase.Nat Cell Biol. 2004 Sep;6(9):831-9. doi: 10.1038/ncb1164. Epub 2004 Aug 22. Nat Cell Biol. 2004. PMID: 15322554
-
Tyrosine phosphatase PTP-MEG2 negatively regulates vascular endothelial growth factor receptor signaling and function in endothelial cells.Am J Physiol Cell Physiol. 2012 Sep 1;303(5):C548-53. doi: 10.1152/ajpcell.00415.2011. Epub 2012 Jul 3. Am J Physiol Cell Physiol. 2012. PMID: 22763125 Free PMC article.
-
Purification and characterization of protein tyrosine phosphatase PTP-MEG2.J Cell Biochem. 2002;86(1):79-89. doi: 10.1002/jcb.10195. J Cell Biochem. 2002. PMID: 12112018
-
Protein Tyrosine Phosphatases as Potential Regulators of STAT3 Signaling.Int J Mol Sci. 2018 Sep 11;19(9):2708. doi: 10.3390/ijms19092708. Int J Mol Sci. 2018. PMID: 30208623 Free PMC article. Review.
-
Mechanistic studies on protein tyrosine phosphatases.Prog Nucleic Acid Res Mol Biol. 2003;73:171-220. doi: 10.1016/s0079-6603(03)01006-7. Prog Nucleic Acid Res Mol Biol. 2003. PMID: 12882518 Review.
Cited by
-
Dual-Specificity Phosphatase 11 Is a Prognostic Biomarker of Intrahepatic Cholangiocarcinoma.Front Oncol. 2021 Sep 29;11:757498. doi: 10.3389/fonc.2021.757498. eCollection 2021. Front Oncol. 2021. PMID: 34660327 Free PMC article.
-
Hereditable variants of classical protein tyrosine phosphatase genes: Will they prove innocent or guilty?Front Cell Dev Biol. 2023 Jan 23;10:1051311. doi: 10.3389/fcell.2022.1051311. eCollection 2022. Front Cell Dev Biol. 2023. PMID: 36755664 Free PMC article. Review.
References
-
- Alonso A, Sasin J, Bottini N, Friedberg I, Friedberg I, Osterman A, Godzik A, Hunter T, Dixon J, Mustelin T (2004) Protein tyrosine phosphatases in the human genome. Cell 117: 699–711 - PubMed
-
- Alvarez de Toledo G, Fernandez‐Chacon R, Fernandez JM (1993) Release of secretory products during transient vesicle fusion. Nature 363: 554–558 - PubMed
-
- Ballif BA, Carey GR, Sunyaev SR, Gygi SP (2008) Large‐scale identification and evolution indexing of tyrosine phosphorylation sites from murine brain. J Proteome Res 7: 311–318 - PubMed
Publication types
MeSH terms
Substances
Associated data
- Actions
- Actions
Grants and funding
- Z200019/Key Research Project of the Natural Science Foundation of Beijing
- 2020M682190/China Postdoctoral Science Foundation
- 81825022/NSFC|National Science Fund for Distinguished Young Scholars (National Science Foundation for Distinguished Young Scholars)
- 2020XGB02/COVID-19 Emergency Tackling Research Program of Shandong University
- ZR2020ZD39/Natural Science Foundation of Shandong Province (Natural Science Foundation of Shandong)
- 2018YFC1003600/National Key Basic Research Program of China Grant
- 2019QL009/Academic promotion programme of Shandong First Medical University
- 2017JQ02/Fundamental Research Funds of Shandong University
- 81773704/National Natural Science Foundation of China (NSFC)
- 2020QNQT002/Shandong University Multidisciplinary Research and Innovation Team of Young Scholars
- 82072676/National Natural Science Foundation of China (NSFC)
- R01 CA069202/CA/NCI NIH HHS/United States
- ZR2017BC045/Shandong Provincial Natural Science Foundation
- 31701230/National Natural Science Foundation of China (NSFC)
- 81822008/National Science Fund for Excellent Young Scholars
- 81700473/National Natural Science Foundation of China (NSFC)
- 2017JQ02/SDU|Fundamental Research Fund of Shandong University
- CA69202/HHS|National Institutes of Health (NIH)
LinkOut - more resources
Full Text Sources
Other Literature Sources
