

Zinc-finger E-box-binding homeobox 1 (ZEB1) plays a crucial role in the maintenance of lung cancer stem cells resistant to gefitinib
- PMID: 33764690
- PMCID: PMC8107025
- DOI: 10.1111/1759-7714.13937
Zinc-finger E-box-binding homeobox 1 (ZEB1) plays a crucial role in the maintenance of lung cancer stem cells resistant to gefitinib
Abstract
Background: Zinc-finger E-box-binding homeobox 1 (ZEB1) is an important regulator of epithelial-mesenchymal transition (EMT) and is involved in the maintenance of cancer stem cells (CSCs) via miR-200c and BMI1 pathway. Recent studies revealed that ZEB1 contributes to the EMT-mediated acquired resistance to gefitinib in EGFR-mutant non-small cell lung cancer (NSCLC). However, the precise role of ZEB1 in the maintenance of lung CSCs that lead to acquired resistance to gefitinib remains unclear.
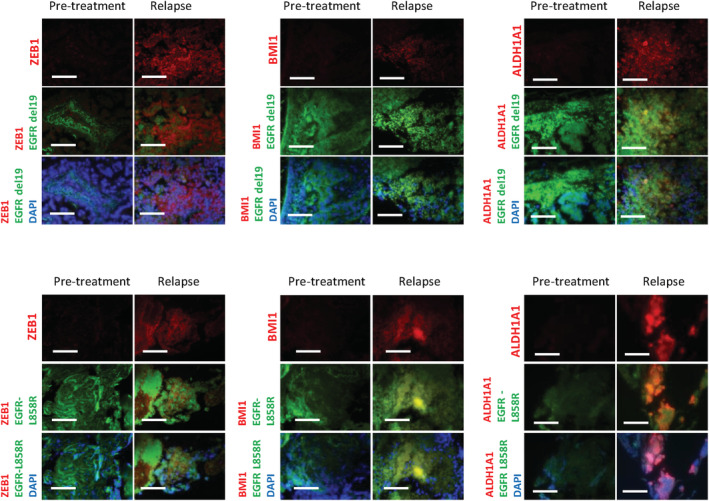
Methods: PC9 and HCC827 NSCLC cell lines were treated with high concentrations of gefitinib, and surviving cells were referred to as "gefitinib-resistant persisters" (GRPs). ZEB1 knockdown or overexpression was performed to determine the biological significance of ZEB1 in the CSC features of GRPs, and animal models were studied for in vivo validation. Expression of ZEB1, BMI1, and ALDH1A1 was analyzed by immunohistochemistry in tumor specimens from NSCLC patients with acquired resistance to gefitinib.
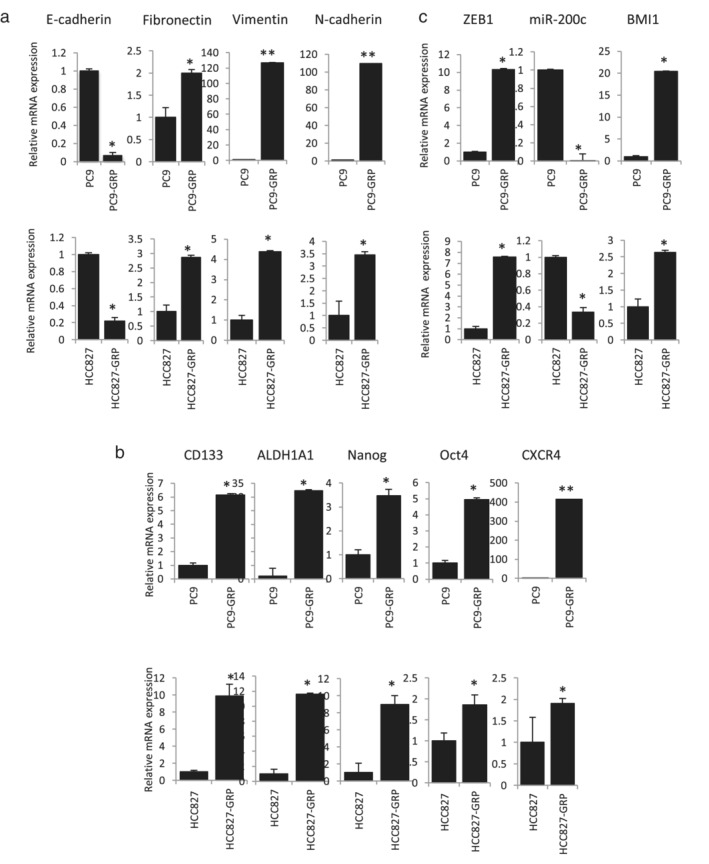
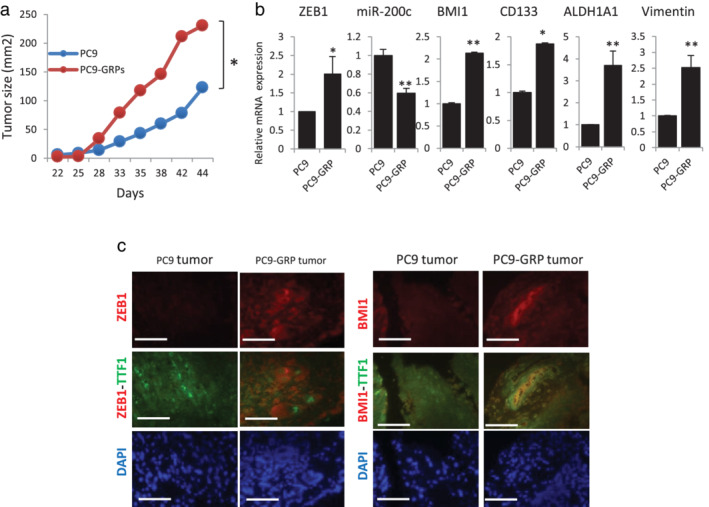
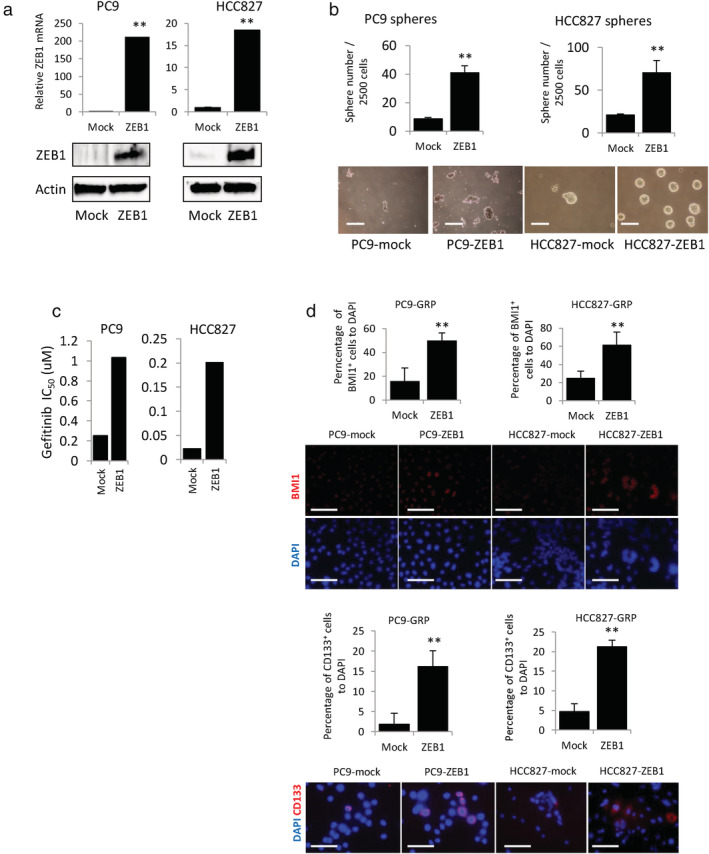
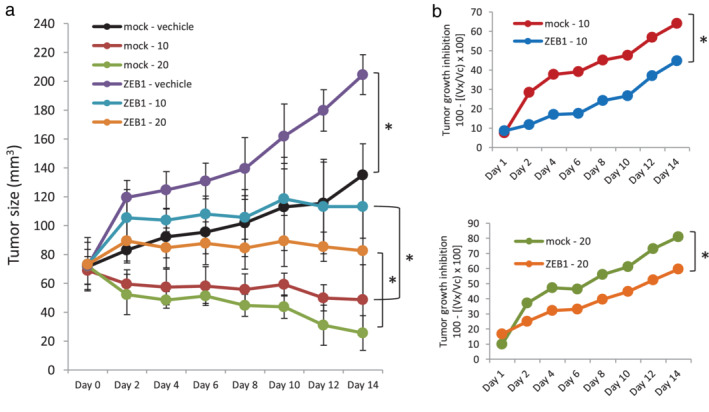
Results: GRPs had characteristic features of mesenchymal and CSC phenotypes with high expression of ZEB1 and BMI1, and decreased miR-200c, in vitro and in vivo. ZEB1 silencing attenuated the suppression of miR-200c, resulting in the reduction in BMI1 and reversed the mesenchymal and CSC features of GRPs. Furthermore, ZEB1 overexpression induced EMT and increased the levels of CD133- and BMI1-positive GRPs in vitro and gefitinib resistance in vivo. Finally, ZEB1, BMI1, and ALDH1A1 were highly expressed in tumor specimens from EGFR-mutant NSCLC patients with gefitinib resistance.
Conclusions: ZEB1 plays an important role in gefitinib-resistant lung CSCs with EMT features via regulation of miR-200c and BMI1.
Keywords: ZEB1; cancer stem cells; epithelial-mesenchymal transition; gefitinib resistance; lung cancer.
© 2021 The Authors. Thoracic Cancer published by China Lung Oncology Group and John Wiley & Sons Australia, Ltd.
Conflict of interest statement
Kazuhisa Takahashi and Fumiyuki Takahashi received research funding from Chugai Pharm, Ono Pharma, Taiho Pharm, Nippon Boehringer Ingelheim, AstraZeneca, Pfizer, MSD, and Lilly Japan, outside the submitted work. The remaining authors declare that they have no conflicts of interest relevant to the subject of this manuscript.
Figures


Similar articles
-
Role of FBXW7 in the quiescence of gefitinib-resistant lung cancer stem cells in EGFR-mutant non-small cell lung cancer.Bosn J Basic Med Sci. 2019 Nov 8;19(4):355-367. doi: 10.17305/bjbms.2019.4227. Bosn J Basic Med Sci. 2019. PMID: 31202256 Free PMC article.
-
Oct4 plays a crucial role in the maintenance of gefitinib-resistant lung cancer stem cells.Biochem Biophys Res Commun. 2016 Apr 22;473(1):125-132. doi: 10.1016/j.bbrc.2016.03.064. Epub 2016 Mar 17. Biochem Biophys Res Commun. 2016. PMID: 26996130
-
Hypoxia increases gefitinib-resistant lung cancer stem cells through the activation of insulin-like growth factor 1 receptor.PLoS One. 2014 Jan 28;9(1):e86459. doi: 10.1371/journal.pone.0086459. eCollection 2014. PLoS One. 2014. PMID: 24489728 Free PMC article.
-
miR-200c: a versatile watchdog in cancer progression, EMT, and drug resistance.J Mol Med (Berl). 2016 Jun;94(6):629-44. doi: 10.1007/s00109-016-1420-5. Epub 2016 Apr 20. J Mol Med (Berl). 2016. PMID: 27094812 Review.
-
The Transcription Factors Zeb1 and Snail Induce Cell Malignancy and Cancer Stem Cell Phenotype in Prostate Cells, Increasing Androgen Synthesis Capacity and Therapy Resistance.Adv Exp Med Biol. 2022;1393:51-64. doi: 10.1007/978-3-031-12974-2_2. Adv Exp Med Biol. 2022. PMID: 36587301 Review.
Cited by
-
Investigating the biology of microRNA links to ALDH1A1 reveals candidates for preclinical testing in acute myeloid leukemia.Int J Oncol. 2024 Dec;65(6):115. doi: 10.3892/ijo.2024.5703. Epub 2024 Nov 8. Int J Oncol. 2024. PMID: 39513593 Free PMC article. Review.
-
Therapeutic Targeting of Cancer Stem Cells in Lung, Head and Neck, and Bladder Cancers.Cancers (Basel). 2021 Oct 12;13(20):5098. doi: 10.3390/cancers13205098. Cancers (Basel). 2021. PMID: 34680249 Free PMC article. Review.
-
A miRNA-Based Prognostic Model to Trace Thyroid Cancer Recurrence.Cancers (Basel). 2022 Aug 26;14(17):4128. doi: 10.3390/cancers14174128. Cancers (Basel). 2022. PMID: 36077665 Free PMC article.
-
Exosomal epidermal growth factor receptor is involved in HPV-16 E7-induced epithelial-mesenchymal transition of non-small cell lung cancer cells: A driver of signaling in vivo.Cancer Biol Ther. 2022 Dec 31;23(1):1-13. doi: 10.1080/15384047.2022.2133332. Cancer Biol Ther. 2022. PMID: 36224722 Free PMC article.
References
-
- Engelman JA, Zejnullahu K, Mitsudomi T, Song Y, Hyland C, Park JO, et al. MET amplification leads to gefitinib resistance in lung cancer by activating ERBB3 signaling. Science. 2007;316:1039–43. - PubMed
Publication types
MeSH terms
Substances
Grants and funding
LinkOut - more resources
Full Text Sources
Other Literature Sources
Medical
Research Materials
Miscellaneous
