

US Public Health Neglected: Flat Or Declining Spending Left States Ill Equipped To Respond To COVID-19
- PMID: 33764801
- PMCID: PMC9890672
- DOI: 10.1377/hlthaff.2020.01084
US Public Health Neglected: Flat Or Declining Spending Left States Ill Equipped To Respond To COVID-19
Abstract
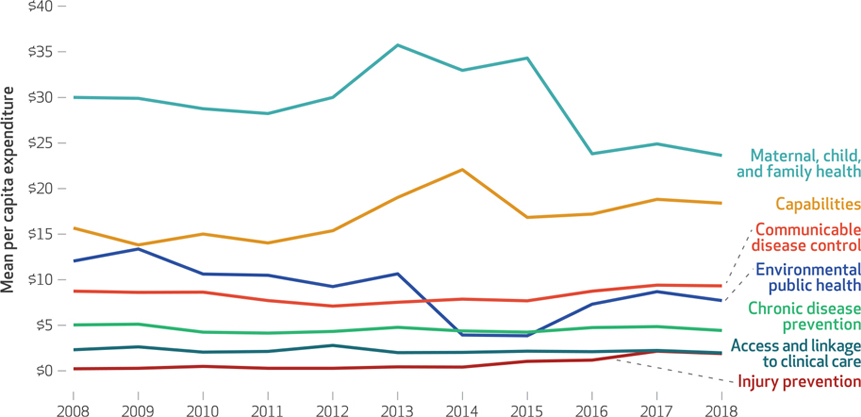
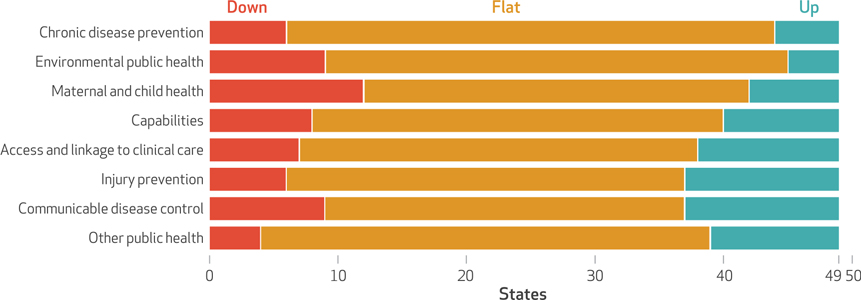
The COVID-19 pandemic has prompted concern about the integrity of the US public health infrastructure. Federal, state, and local governments spend $93 billion annually on public health in the US, but most of this spending is at the state level. Thus, shoring up gaps in public health preparedness and response requires an understanding of state spending. We present state spending trends in eight categories of public health activity from 2008 through 2018. We obtained data from the Census Bureau for all states except California and coded the data by public health category. Although overall national health expenditures grew by 4.3 percent in this period, state governmental public health spending saw no statistically significant growth between 2008 and 2018 except in injury prevention. Moreover, state spending levels on public health were not restored after cuts experienced during the Great Recession, leaving states ill equipped to respond to COVID-19 and other emerging health needs.
Figures
References
-
- Oh J, Lee JK, Schwarz D, Ratcliffe HL, Markuns JF, Hirschhorn LR. National response to COVID-19 in the Republic of Korea and lessons learned for other countries. Health Syst Reform. 2020;6(1):e1753464. - PubMed
-
- James A, Hendy SC, Plank MJ, Steyn N. Suppression and mitigation strategies for control of COVID-19 in New Zealand. medRxiv [serial on the Internet]. 2020. Mar 30 [cited 2021 Feb 9]. Available from: https://www.medrxiv.org/content/10.1101/2020.03.26.20044677v1 - DOI
Publication types
MeSH terms
Grants and funding
LinkOut - more resources
Full Text Sources
Other Literature Sources
Medical