. 2021 May 10;6(9):e139785.
doi: 10.1172/jci.insight.139785.

DMV extrasynaptic NMDA receptors regulate caloric intake in rats

DMV extrasynaptic NMDA receptors regulate caloric intake in rats

Courtney Clyburn et al. JCI Insight. .

Abstract

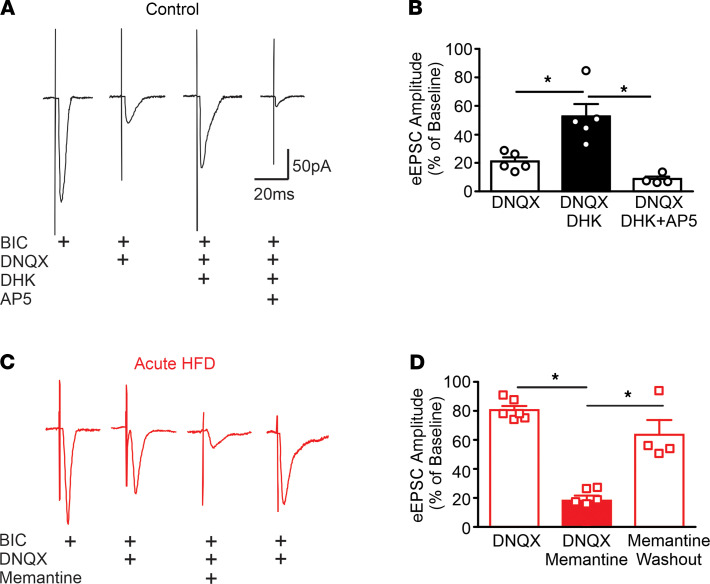
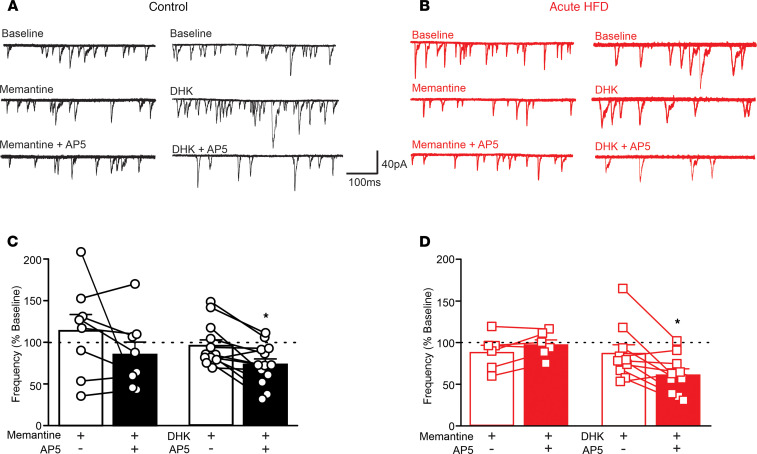
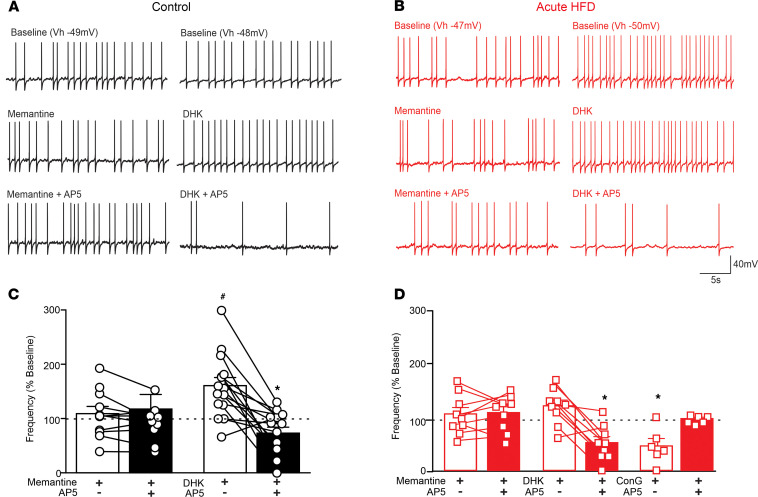
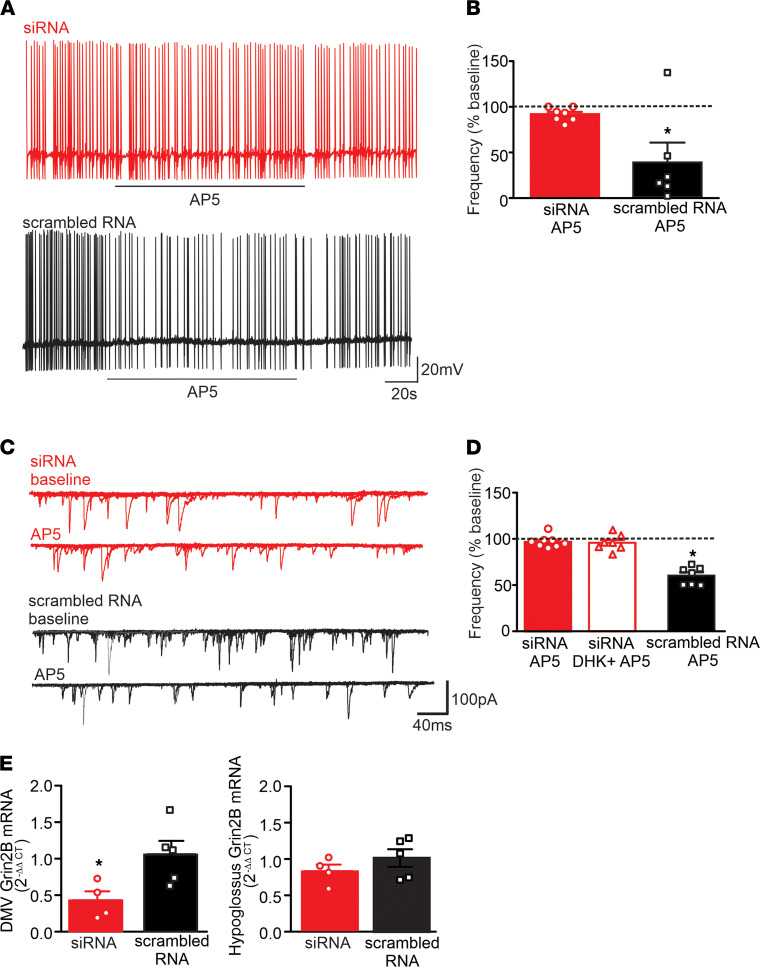
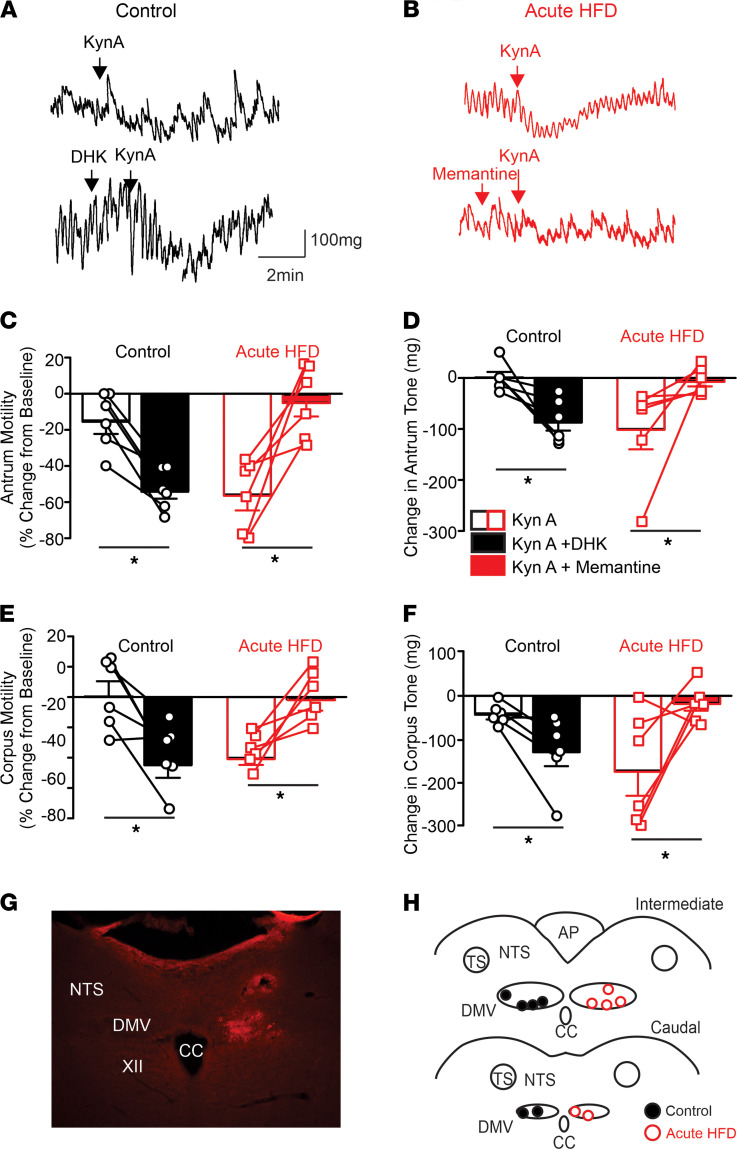
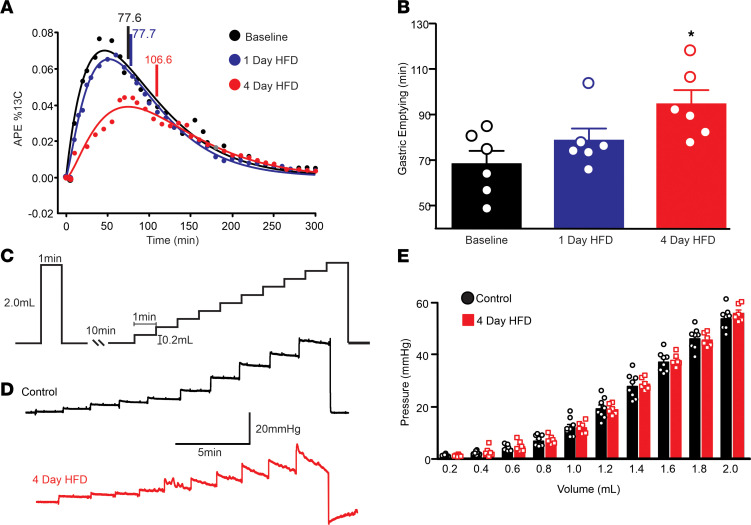
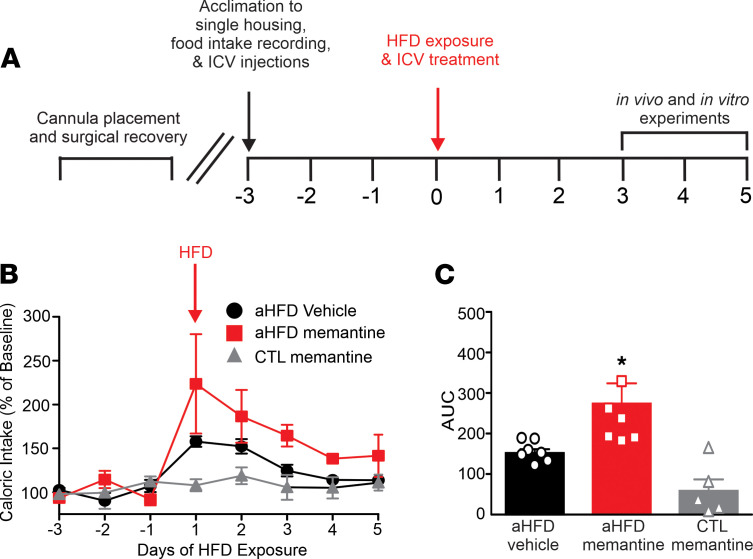
Acute high-fat diet (aHFD) exposure induces a brief period of hyperphagia before caloric balance is restored. Previous studies have demonstrated that this period of regulation is associated with activation of synaptic N-methyl-D-aspartate (NMDA) receptors on dorsal motor nucleus of the vagus (DMV) neurons, which increases vagal control of gastric functions. Our aim was to test the hypothesis that activation of DMV synaptic NMDA receptors occurs subsequent to activation of extrasynaptic NMDA receptors. Sprague-Dawley rats were fed a control or high-fat diet for 3-5 days prior to experimentation. Whole-cell patch-clamp recordings from gastric-projecting DMV neurons; in vivo recordings of gastric motility, tone, compliance, and emptying; and food intake studies were used to assess the effects of NMDA receptor antagonism on caloric regulation. After aHFD exposure, inhibition of extrasynaptic NMDA receptors prevented the synaptic NMDA receptor-mediated increase in glutamatergic transmission to DMV neurons, as well as the increase in gastric tone and motility, while chronic extrasynaptic NMDA receptor inhibition attenuated the regulation of caloric intake. After aHFD exposure, the regulation of food intake involved synaptic NMDA receptor-mediated currents, which occurred in response to extrasynaptic NMDA receptor activation. Understanding these events may provide a mechanistic basis for hyperphagia and may identify novel therapeutic targets for the treatment of obesity.

Keywords: Gastroenterology; Ion channels; Neuroscience; Obesity; Synapses.


Conflict of interest statement

Conflict of interest: The authors have declared that no conflict of interest exists.

Figures

Figure 1
Figure 1. Activation of extrasynaptic NMDARs is required for the activation of synaptic NMDARs observed after aHFD exposure.(A and C) Representative traces (averaged from 6–10 raw traces) of eEPSCs from control (A) and aHFD (C) gastric-projecting DMV neurons voltage-clamped at –50mV.
In control conditions (A), application of DNQX significantly reduced eEPSC amplitude, which was recovered after application of DHK. This NMDA-mediated current was then reduced by application of AP5. After aHFD (C), application of DNQX did not significantly affect eEPSC amplitude. The remaining NMDA-mediated current was significantly and reversibly decreased after application of memantine. (B and D) Graphical summary of the effects of DNQX, DHK, memantine, and AP5 on eEPSC amplitude in control (B) and aHFD (D) gastric-projecting DMV neurons (B; n = 5 cells, 3 rats) (D; n = 6 cells, 3 rats). In controls, application of DNQX (left; open bars) significantly reduced eEPSC amplitude. Subsequent application of DHK increased eEPSC amplitude (middle; black bar), and this synaptic NMDA-mediated current was reduced after subsequent application of AP5 (right; open bars). After aHFD (D), application of DNQX (left; open bar) did not alter eEPSC amplitude. Subsequent application of memantine significantly reduced eEPSC amplitude (middle; red bar), which was reversed after washout (right; open bar). *P < 0.05 (1-way ANOVA with post hoc Bonferroni test).
Figure 2
Figure 2. Inhibition of extrasynaptic NMDARs attenuates the synaptic-mediated decrease in glutamatergic currents observed after aHFD exposure, whereas stimulation of extrasynaptic NMDARs uncovers this effect in control conditions.
(A and B) Six overlapping consecutive traces from gastric-projecting control (A) and aHFD (B) DMV neurons voltage-clamped at –50mV illustrating mEPSCs. In controls (A), application of memantine (30 μM; left, middle) or AP5– (25 μM; left, bottom) had no effect on mEPSC frequency. Application of DHK (30 μM; right, middle), however, uncovered an AP5-mediated decrease (25 μM; right, bottom) in mEPSC frequency. After aHFD (B), memantine (30 μM; middle) attenuated the AP5-mediated decrease (25 μM; bottom) in mEPSC frequency. Application of DHK had no significant effect on mEPSC frequency (30 μM; right, middle) and did not affect the AP5-mediated decrease in mEPSC frequency. (C and D) Graphical summary of the effects of memantine (C; left; n = 8 cells, 5 rats) (D; left; n = 6 cells, 3 rats) and DHK (C; right; n = 12 cells, 4 rats) (D; right; n = 10 cells, 3 rats) on the AP5-mediated changes in mEPSC frequency in control conditions (C) and after aHFD (D). In controls (C), memantine (left) had no significant effect on AP5-mediated changes mEPSC frequency in control conditions (left). DHK (middle), however, uncovered a significant AP5-mediated decrease in mEPSC frequency. Note that AP5 alone had no significant effect on frequency of mEPSCs in controls (n = 6 cells, 3 rats). After aHFD exposure (D), DHK (right) had no effect on the AP5-mediated decrease in mEPSC frequency. Memantine (left), however, significantly attenuated the AP5-mediated decrease normally observed after aHFD exposure. Note that the effect size of AP5 alone was similar to that of AP5 following DHK (right; n = 6 cells, 3 rats). Baseline represented by dashed line (100%). *P < 0.05 versus DHK or memantine alone or versus baseline (Student’s paired t test).
Figure 3
Figure 3. Extrasynaptic NMDAR activation is required for the synaptic NMDAR–mediated decrease in action potential firing rate.
(A and B) Representative traces from gastric-projecting control (A) and aHFD (B) DMV neurons current-clamped at a potential to allow action potential firing at approximately 1 Hz. In controls (A), perfusion with memantine (30 μM; left, middle) or AP5 (25 μM; left, bottom) had no effect on action potential firing rate. Perfusion with DHK, however, increased action potential firing rate (30 μM; right, middle) and uncovered an AP5-mediated decrease in action potential firing rate (right, bottom). In aHFD neurons (B), perfusion with memantine (30 μM; left, middle) had no effect on action potential firing rate but blocked the subsequent AP5-mediated decrease (25 μM; left, bottom) and perfusion with DHK (30 μM; right, middle) had no effect on action potential firing rate and did not affect the observed AP5-mediated decrease (right, bottom). (C and D) Graphical summary of the effects of memantine (C; left, n = 11 cells, 5 rats) (D; left, n = 9 cells, 4 rats), DHK (C; right; n = 16 cells, 6 rats) (D; middle; n = 9 cells, 3 rats), and AP5 on action potential firing rate in control (C) and aHFD (D) DMV neurons. In controls (C), application of memantine and AP5 had no effect on action potential firing rate. Application of DHK, however, significantly increased action potential firing rate in control conditions, which uncovered an AP5-mediated decrease in action potential firing rate. After aHFD exposure (D), application of memantine (left) and ConG (right; n = 6 cells, 3 rats) attenuated the AP5-mediated decrease in action potential firing rate observed after aHFD exposure. Application of DHK had no significant effect on action potential firing rate and did not affect the AP5-mediated decrease observed normally. *P < 0.05 versus DHK #P < 0.05 versus baseline (Student’s paired t test).
Figure 4
Figure 4. siRNA-mediated knockdown of GRIN2B prevents the activation of synaptic NMDARs.
(A) Representative traces from gastric-projecting aHFD DMV neurons after microinjection of siRNA targeted against GRIN2B (red, upper) or scrambled RNA controls (black, lower). Neurons were current-clamped at a potential that allowed action potential firing of approximately 1 Hz. Perfusion with AP5 (25 μM) had no effect on action potential firing rate in siRNA rats, but decreased action potential firing rate in scrambled RNA rats. (B) Graphical summary of the effects of AP5 on action potential firing GRIN2B siRNA rats (red; n = 7 cells, 3 rats) and scrambled RNA rats (black; n = 6 cells, 3 rats) after aHFD exposure. Neurons were current-clamped at a potential that allowed for action potential firing of approximately 1 Hz. AP5 had no effect on action potential firing rate in siRNA rats (red; left), but decreased action potential firing rate in scrambled RNA rats. *P < 0.05 versus baseline (Student’s paired t test). (C) Six overlapping consecutive traces from gastric-projecting aHFD DMV neurons voltage-clamped at –50mV illustrating mEPSCs in siRNA (red, upper) or scrambled RNA (black, lower) microinjected rats. Perfusion with AP5 (25 μM) decreased mEPSC frequency in scrambled but not siRNA rats. (D) Graphical summary of the effects of AP5 on mEPSC frequency in siRNA and scrambled RNA rats. AP5 had no effect on mEPSC frequency in siRNA rats (red, left), even after perfusion with DHK (red open, middle). Conversely, AP5 decreased mEPSC frequency in scrambled RNA rats (black, right). *P < 0.05 versus baseline (1-way ANOVA followed by post hoc Dunnett’s multiple-comparison test). (E) Graphical summary of GRIN2B gene expression measured by qPCR in the DMV (left) and hypoglossus (right; control region) in aHFD rats microinjected with siRNA (n = 4 rats) or scrambled RNA (n = 5 rats). Each experiment had 2 replicates. The siRNA injection reduced GRIN2B mRNA by approximately 60% in the DMV with no effect in hypoglossus. Data were normalized to β-actin and expressed as fold change using the 2–ΔΔCT method. *P < 0.05 versus scrambled RNA (Student’s unpaired t test).
Figure 5
Figure 5. The synaptic NMDAR–mediated decrease in gastric motility and tone observed after aHFD exposure is dependent upon activation of extrasynaptic NMDARs.
(A and B) Representative gastric motility traces from control (A) and aHFD (B) rats. In control conditions (A), DVC microinjection of the nonselective glutamate receptor antagonist, kynurenic acid (KynA; 100 pmol/60 nL) had no effect on antrum tone and motility (upper trace). In contrast, DVC microinjection of KynA after fourth ventricular application of the glutamate reuptake inhibitor, dihydrokinate (DHK; 1 mM in 2 μL; lower trace) decreased gastric tone and motility. After aHFD (B), DVC microinjection KynA; (100 pmol/60 mL) decreased gastric tone and motility (upper trace). In contrast, DVC microinjection of KynA after fourth ventricular application of memantine (50 mM in 2 μL; lower trace) had no significant effect on gastric tone or motility. (CF) Graphical representation of the effects of brainstem microinjection of KynA, DHK, and memantine on antrum (C and D) and corpus (E and F) motility (C and E) and tone (D and F) in control (left; n = 6) and aHFD (right; n = 6) rats. (G) Photomicrograph illustrating a brainstem microinjection (arrow) in the intermediate DVC. XII = hypoglossus; NTS = nucleus of the tractus solitarius; DMV = dorsal motor nucleus of the vagus; CC = central canal. (H) Map illustrating all brainstem microinjection sites, divided into intermediate (top) and caudal (lower) areas. For the sake of clarity, injections are marked bilaterally (control; left, HFD; right), although all microinjections were made into the left DVC since recordings of motility and tone were made from the ventral stomach. *P < 0.05 versus KynA alone (Student’s paired t test).
Figure 6
Figure 6. aHFD exposure significantly delays gastric emptying and does not affect compliance.
(A) Representative gastric emptying curves in atomic percentage excess (APE; %13C). Half emptying times (T1/2) are indicated by vertical bars. T1/2 was significantly delayed after 4 days of HFD exposure (red) compared with baseline (black) and 1 day of HFD exposure (blue). (B) Graphical summary of gastric emptying (T1/2; min) in rats (n = 6) throughout exposure to HFD. Gastric emptying was significantly delayed after 4 days of HFD exposure (red) compared with baseline (black) and 1 day of HFD exposure (blue). *P > 0.05; 1-way ANOVA followed by post hoc Dunnett’s multiple-comparison test. (C) Schematic diagram illustrating the balloon inflation protocol for gastric compliance experiments. (D) Representative sample traces of gastric compliance in control (black; top) and aHFD (red; bottom) rats. There is no significant difference in compliance between control and aHFD traces. (E) Graphical summary of balloon pressure in response to increased volume in control (black) and aHFD (red) rats. There is no significant difference between control and 4-day HFD at any volume. *P > 0.05 (2-way ANOVA).
Figure 7
Figure 7. Homeostatic regulation of caloric intake during aHFD exposure is attenuated by chronic fourth ventricular application of memantine.
(A) Schematic diagram of the experimental timeline. (B) Graphical summary of caloric intake after exposure to aHFD. Note that fourth ventricular application of memantine (n = 6 rats) attenuated the homeostatic regulation of caloric intake observed in vehicle-treated animals (n = 7 rats) upon exposure to HFD; memantine had no effect on caloric intake in control rats (n = 5 rats). (C) Graphical summary of caloric intake represented as AUC. HFD rats treated with chronic fourth ventricular memantine (n = 6 rats) consumed significantly more than vehicle treated (n = 7 rats) and control (n = 5) rats. *P < 0.05 versus vehicle and #P < 0.05 versus aHFD (1-way ANOVA followed by post hoc Dunnett’s multiple-comparison test).

Similar articles

Cited by

References

    1. Hammond RA, Levine R. The economic impact of obesity in the United States. Diabetes Metab Syndr Obes. 2010;3:285–295. doi: 10.2147/DMSO.S7384. - DOI - PMC - PubMed
    1. Levin BE. Metabolic imprinting: critical impact of the perinatal environment on the regulation of energy homeostasis. Philos Trans R Soc Lond B Biol Sci. 2006;361(1471):1107–1121. doi: 10.1098/rstb.2006.1851. - DOI - PMC - PubMed
    1. Levin BE. Developmental gene x environment interactions affecting systems regulating energy homeostasis and obesity. Front Neuroendocrinol. 2010;31(3):270–283. doi: 10.1016/j.yfrne.2010.02.005. - DOI - PMC - PubMed
    1. Levin BE. Interaction of perinatal and pre-pubertal factors with genetic predisposition in the development of neural pathways involved in the regulation of energy homeostasis. Brain Res. 2010;1350:10–17. doi: 10.1016/j.brainres.2009.12.085. - DOI - PMC - PubMed
    1. Tamashiro KL, Moran TH. Perinatal environment and its influences on metabolic programming of offspring. Physiol Behav. 2010;100(5):560–566. doi: 10.1016/j.physbeh.2010.04.008. - DOI - PMC - PubMed

Publication types

MeSH terms