. 2021 Mar 26;70(12):431-436.
doi: 10.15585/mmwr.mm7012e1.

County-Level COVID-19 Vaccination Coverage and Social Vulnerability - United States, December 14, 2020-March 1, 2021

County-Level COVID-19 Vaccination Coverage and Social Vulnerability - United States, December 14, 2020-March 1, 2021

Michelle M Hughes et al. MMWR Morb Mortal Wkly Rep. .

Abstract

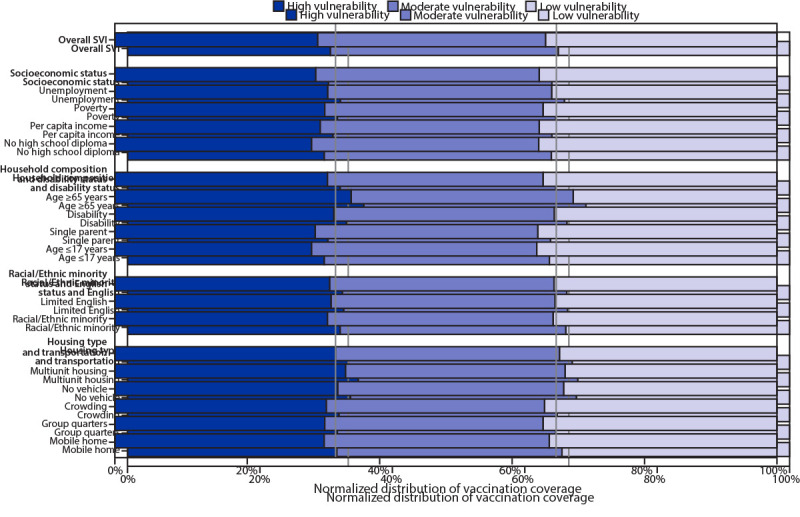
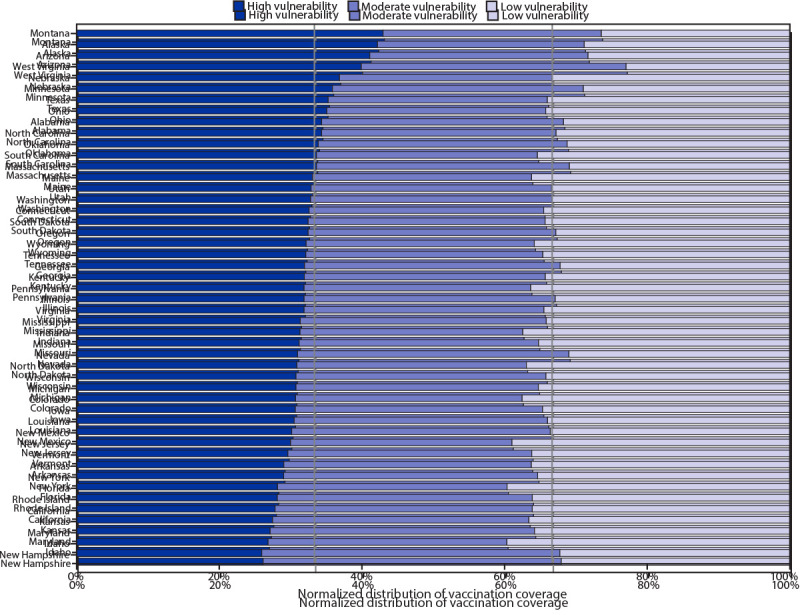
The U.S. COVID-19 vaccination program began in December 2020, and ensuring equitable COVID-19 vaccine access remains a national priority.* COVID-19 has disproportionately affected racial/ethnic minority groups and those who are economically and socially disadvantaged (1,2). Thus, achieving not just vaccine equality (i.e., similar allocation of vaccine supply proportional to its population across jurisdictions) but equity (i.e., preferential access and administra-tion to those who have been most affected by COVID-19 disease) is an important goal. The CDC social vulnerability index (SVI) uses 15 indicators grouped into four themes that comprise an overall SVI measure, resulting in 20 metrics, each of which has national and state-specific county rankings. The 20 metric-specific rankings were each divided into lowest to highest tertiles to categorize counties as low, moderate, or high social vulnerability counties. These tertiles were combined with vaccine administration data for 49,264,338 U.S. residents in 49 states and the District of Columbia (DC) who received at least one COVID-19 vaccine dose during December 14, 2020-March 1, 2021. Nationally, for the overall SVI measure, vaccination coverage was higher (15.8%) in low social vulnerability counties than in high social vulnerability counties (13.9%), with the largest coverage disparity in the socioeconomic status theme (2.5 percentage points higher coverage in low than in high vulnerability counties). Wide state variations in equity across SVI metrics were found. Whereas in the majority of states, vaccination coverage was higher in low vulnerability counties, some states had equitable coverage at the county level. CDC, state, and local jurisdictions should continue to monitor vaccination coverage by SVI metrics to focus public health interventions to achieve equitable coverage with COVID-19 vaccine.


Conflict of interest statement

All authors have completed and submitted the International Committee of Medical Journal Editors form for disclosure of potential conflicts of interest. No potential conflicts of interest were disclosed.

Figures

FIGURE 1
FIGURE 1
Distribution of county-level COVID-19 vaccination coverage among persons who received at least one vaccine dose (N = 49,264,338), by social vulnerability index (SVI) metric and tertile — United States, December 14, 2020–March 1, 2021 * Counties were assigned to tertiles (low, moderate, and high) for overall SVI. Data are presented as a 100% stacked bar chart (normalized across states), with the length of each bar segment representing the proportion of total vaccination coverage for each SVI tertile. When proportions of vaccination coverage are equal among SVI tertiles, each proportion represents 0.33, represented by the vertical lines. When proportions of vaccination coverage estimates are not equally distributed among SVI tertiles, then proportions do not align with threshold lines representing 0.33. Vaccines administered to residents of 49 U.S. states (excluding Hawaii) and the District of Columbia during December 14, 2020–March 1, 2021, and reported to CDC by March 6, 2021. § SVI ranks counties according to 15 social factors (indicators): 1) percentage of persons with incomes below poverty threshold, 2) percentage of civilian population (aged ≥16 years) that is unemployed, 3) per capita income, 4) percentage of persons aged ≥25 years with no high school diploma, 5) percentage of persons aged ≥65 years, 6) percentage of persons aged ≤17 years, 7) percentage of civilian noninstitutionalized population with a disability, 8) percentage of single-parent households with children aged <18 years, 9) percentage of persons who are racial/ethnic minorities (i.e., all persons except those who are non-Hispanic White), 10) percentage of persons aged ≥5 years who speak English “less than well,” 11) percentage of housing in structures with ≥10 units (multiunit housing), 12) percentage of housing structures that are mobile homes, 13) percentage households with more persons than rooms (crowding), 14) percentage of households with no vehicle available, and 15) percentage of persons in group quarters. Estimates are created using 2014–2018 (5-year) data from the American Community Survey. The 15 indicators are categorized into four themes: 1) socioeconomic status (indicators 1–4), 2) household composition and disability (indicators 5–8), 3) racial/ethnic minority status and language (indicators 9 and 10), and 4) housing type and transportation (indicators 11–15). Overall SVI includes all 15 indicators as a composite measure.
FIGURE 2
FIGURE 2
Distribution of county-level COVID-19 vaccination coverage among persons who received at least one vaccine dose (N = 49,019,117), by state and overall social vulnerability index (SVI) tertile — United States, December 14, 2020–March 1, 2021 * Counties were assigned to tertiles (low, moderate, and high) for overall SVI. Data are presented as a 100% stacked bar chart (normalized across states), with the length of each bar segment representing the proportion of total vaccination coverage for each SVI tertile. When proportions of vaccination coverage are equal among SVI tertiles, each proportion represents 0.33, represented by the vertical lines. When proportions of vaccination coverage estimates are not equally distributed among SVI tertiles, then proportions do not align with threshold lines representing 0.33. Vaccines administered to residents of 48 U.S. states (excluding Delaware, the District of Columbia, and Hawaii) during December 14, 2020–March 1, 2021, and reported to CDC by March 6, 2021.

Similar articles

Cited by

References

    1. Lopez L 3rd, Hart LH 3rd, Katz MH. Racial and ethnic health disparities related to COVID-19. JAMA 2021;325:719–20. 10.1001/jama.2020.26443 - DOI - PubMed
    1. Chen JT, Testa C, Waterman P, et al. Intersectional inequities in COVID-19 mortality by race/ethnicity and education in the United States, January 1, 2020. –January 31, 2021. Boston, MA: The Harvard Center for Population and Development Studies; 2021. https://cdn1.sph.harvard.edu/wp-content/uploads/sites/1266/2021/02/21_Ch...
    1. Gayle HD, Childress JF. Race, racism, and structural injustice: equitable allocation and distribution of vaccines for the COVID-19. Am J Bioeth 2021;21:4–7. 10.1080/15265161.2021.1877011 - DOI - PubMed
    1. Painter EM, Ussery EN, Patel A, et al. Demographic characteristics of persons vaccinated during the first month of the COVID-19 vaccination program—United States, December 14, 2020–January 14. MMWR Morb Mortal Wkly Rep 2021;70:174–7. 10.15585/mmwr.mm7005e1 - DOI - PMC - PubMed
    1. Kim SJ, Bostwick W. Social vulnerability and racial inequality in COVID-19 deaths in Chicago. Health Educ Behav 2020;47:509–13. 10.1177/1090198120929677 - DOI - PMC - PubMed

MeSH terms

Substances