. 2021 Mar 25;16(3):e0248783.
doi: 10.1371/journal.pone.0248783. eCollection 2021.

Identifying optimal COVID-19 testing strategies for schools and businesses: Balancing testing frequency, individual test technology, and cost

Affiliations

Identifying optimal COVID-19 testing strategies for schools and businesses: Balancing testing frequency, individual test technology, and cost

Gregory D Lyng et al. PLoS One. .

Abstract

Background: COVID-19 test sensitivity and specificity have been widely examined and discussed, yet optimal use of these tests will depend on the goals of testing, the population or setting, and the anticipated underlying disease prevalence. We model various combinations of key variables to identify and compare a range of effective and practical surveillance strategies for schools and businesses.

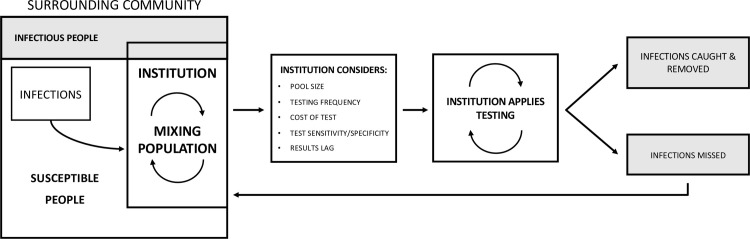
Methods: We coupled a simulated data set incorporating actual community prevalence and test performance characteristics to a susceptible, infectious, removed (SIR) compartmental model, modeling the impact of base and tunable variables including test sensitivity, testing frequency, results lag, sample pooling, disease prevalence, externally-acquired infections, symptom checking, and test cost on outcomes including case reduction and false positives.

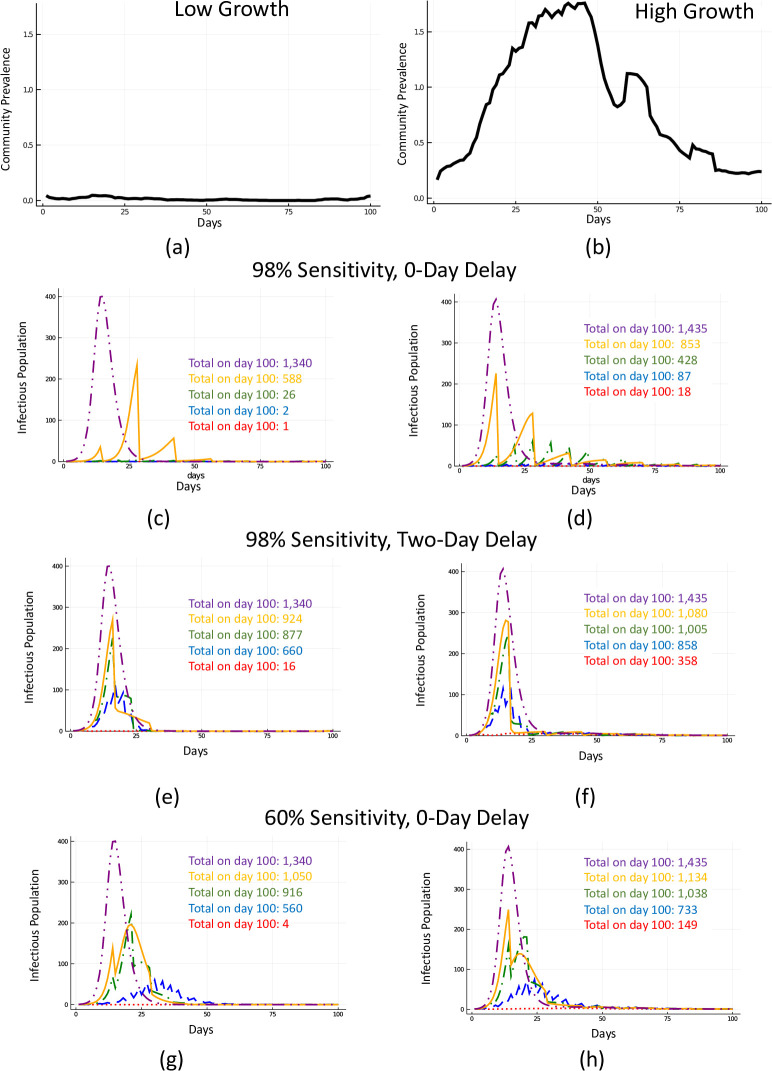
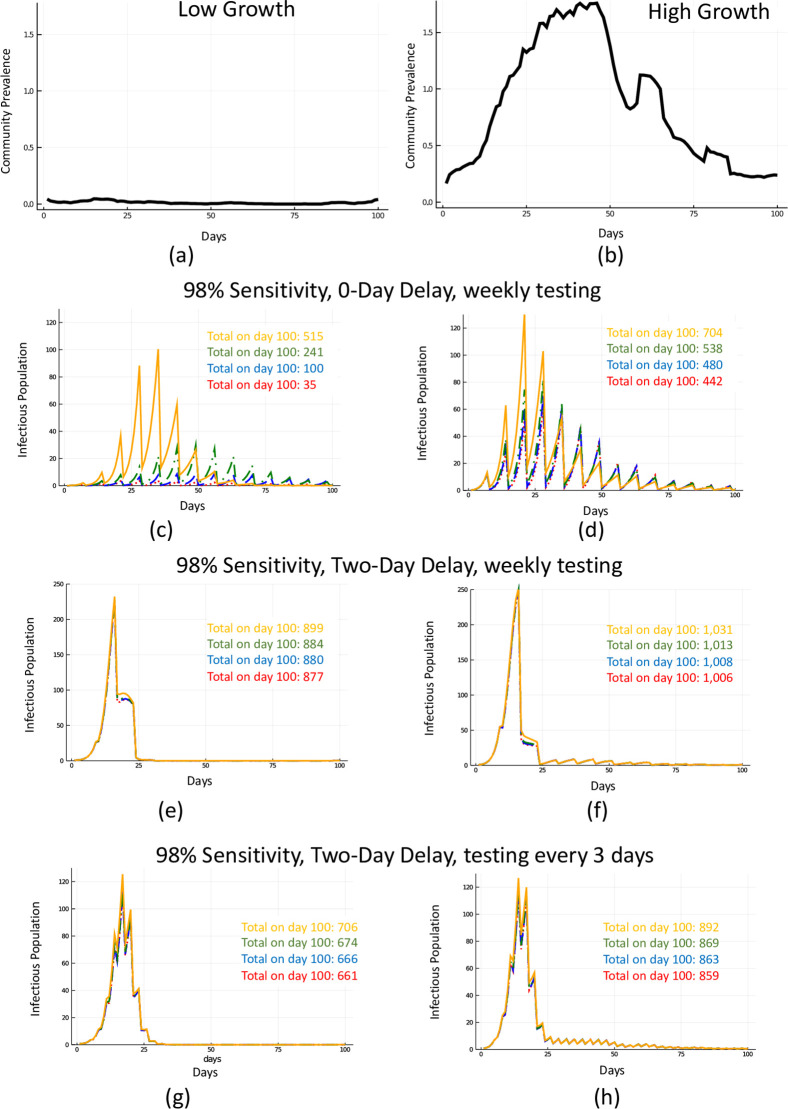
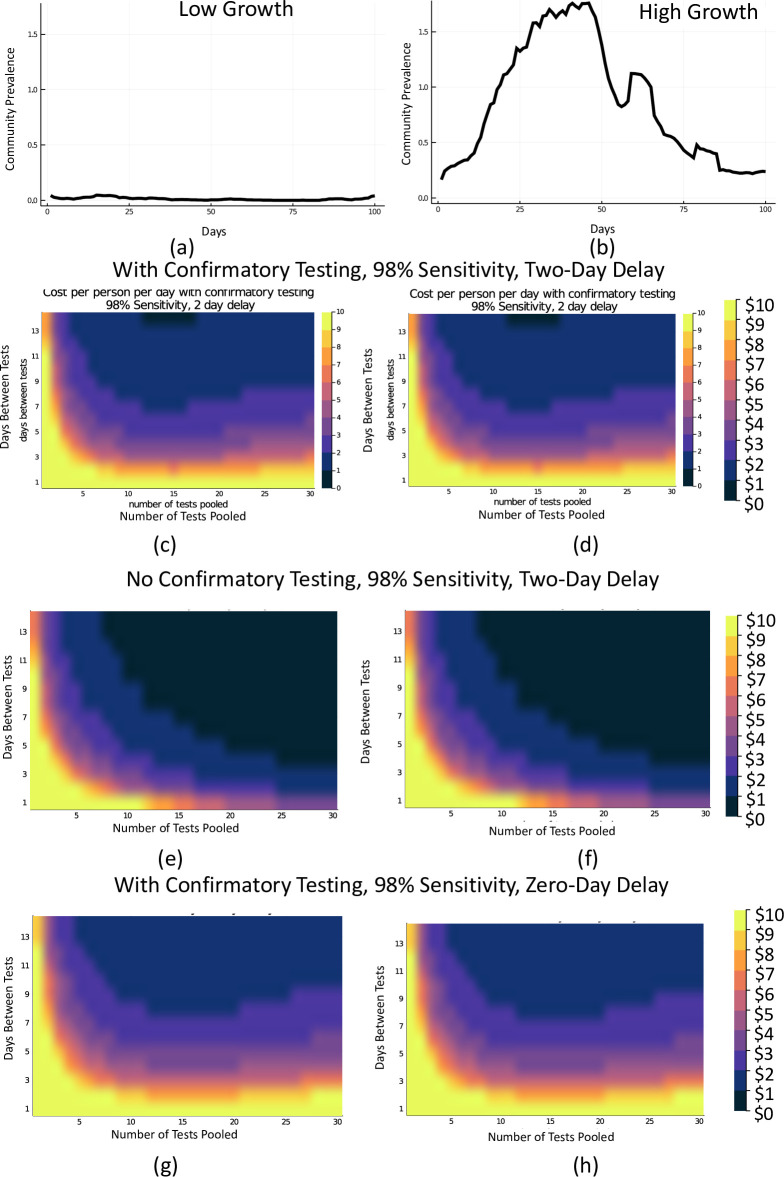
Findings: Increasing testing frequency was associated with a non-linear positive effect on cases averted over 100 days. While precise reductions in cumulative number of infections depended on community disease prevalence, testing every 3 days versus every 14 days (even with a lower sensitivity test) reduces the disease burden substantially. Pooling provided cost savings and made a high-frequency approach practical; one high-performing strategy, testing every 3 days, yielded per person per day costs as low as $1.32.

Interpretation: A range of practically viable testing strategies emerged for schools and businesses. Key characteristics of these strategies include high frequency testing with a moderate or high sensitivity test and minimal results delay. Sample pooling allowed for operational efficiency and cost savings with minimal loss of model performance.


Conflict of interest statement

Authors [GL, NS, CK, DG, EB] are employees of UnitedHealth Group; GL, NS, CK, and EB own stock in the company. DG is employed as the Senior Infectious Disease Fellow at UnitedHealth Group, Inc and serves as the Chief of Infectious Diseases for ProHealth NY an Optum Company. This does not alter our adherence to PLOS ONE policies on sharing data and materials.

Figures

Fig 1
Fig 1. Schematic representation of the model.
The model simulates testing for a common group of people who mix continuously in an institution (i.e., in a school or office) and are subject to the introduction of infection from the surrounding unmonitored community. The framework couples regular testing, described by a handful of tunable parameters, to a disease model. The disease model is dynamic in time, and infections may originate both from inside-the-institution mixing and from the surrounding community at varying rates depending on prevalence.
Fig 2
Fig 2. Impact of testing frequency.
Two scenarios for community prevalence corresponding, relatively, to low and high rates of imported infections (Panels (a) and (b)). Testing with a test with 98% sensitivity with 0-day resulting delay amidst high and low community prevalence (Panels (c) and (d)). Testing with a test with 98% sensitivity with 2-day resulting delay amidst high and low community prevalence (Panels (e) and (f)). Testing with a test with 60% sensitivity with 0-day resulting delay amidst high and low community prevalence (Panels (g) and (h)). Purple (dash-dot-dot) corresponds to no testing, orange (solid) to testing every two weeks with daily symptom tracking, green for testing every week with daily symptom tracking (dash-dot), blue (dash) for testing every 3 days with daily symptom tracking, and red (dot) for daily testing and symptom tracking.
Fig 3
Fig 3. Effect of pool size.
Two scenarios for community prevalence corresponding, relatively, to low and high rates of imported infections (Panels (a) and (b)). Testing weekly with a test with 98% sensitivity with 0-day resulting delay with daily symptom tracking amidst high and low community prevalence (Panels (c) and (d)). Testing weekly with a test with 98% sensitivity with 2-day resulting delay with daily symptom tracking amidst high and low community prevalence (Panels (e) and (f)). Testing every 3 days with a test with 98% sensitivity with 2-day resulting delay with daily symptom tracking amidst high and low community prevalence (Panels (g) and (h)). Orange lines (solid) correspond to 30 samples pooled, green (dash-dot) to ten samples pooled, blue (dash) to five samples pooled, and red (dot) to 2 samples pooled.
Fig 4
Fig 4. Cost comparison map for various pooling and frequency scenarios with and without confirmatory testing.
Use case of a test with 98% sensitivity and 99.5% specificity with a 2-day result delay costing $100 and a 98% sensitive test with 99.5% specificity and a 0 day result delay costing $120 with free daily symptom tracking. In (c, d, g, h) every person in a positive pool is retested for confirmation and in (e, f) no confirmatory testing is done. We assume all confirmatory tests cost $100. Colors correspond to cost per person per day in dollars.

References

    1. Service RF. Coronavirus antigen tests: quick and cheap, but too often wrong? Science | AAAS. 2020. Available from: https://www.sciencemag.org/news/2020/05/coronavirus-antigen-tests-quick-...
    1. Corman VM, Rabenau HF, Adams O, Oberle D, Funk MB, Keller‐Stanislawski B, et al.. SARS-CoV-2 asymptomatic and symptomatic patients and risk for transfusion transmission. Transfusion. 2020;60(6):1119–22. 10.1111/trf.15841 - DOI - PMC - PubMed
    1. FDA. Emergency Use Authorization. FDA. 2020. Available from: https://www.fda.gov/emergency-preparedness-and-response/mcm-legal-regula...
    1. Marca AL, Capuzzo M, Paglia T, Roli L, Trenti T, Nelson SM. Testing for SARS-CoV-2 (COVID-19): a systematic review and clinical guide to molecular and serological in-vitro diagnostic assays. Reprod Biomed Online. 2020. September 1;41(3):483–99. 10.1016/j.rbmo.2020.06.001 - DOI - PMC - PubMed
    1. Abdalhamid B, Bilder CR, McCutchen EL, Hinrichs SH, Koepsell SA, Iwen PC. Assessment of specimen pooling to conserve SARS-CoV-2 testing resources. Am J Clin Pathol. 2020. May 5;153(6):715–8. 10.1093/ajcp/aqaa064 - DOI - PMC - PubMed