

App-based symptom tracking to optimize SARS-CoV-2 testing strategy using machine learning
- PMID: 33765050
- PMCID: PMC7993758
- DOI: 10.1371/journal.pone.0248920
App-based symptom tracking to optimize SARS-CoV-2 testing strategy using machine learning
Abstract
Background: Tests are scarce resources, especially in low and middle-income countries, and the optimization of testing programs during a pandemic is critical for the effectiveness of the disease control. Hence, we aim to use the combination of symptoms to build a predictive model as a screening tool to identify people and areas with a higher risk of SARS-CoV-2 infection to be prioritized for testing.
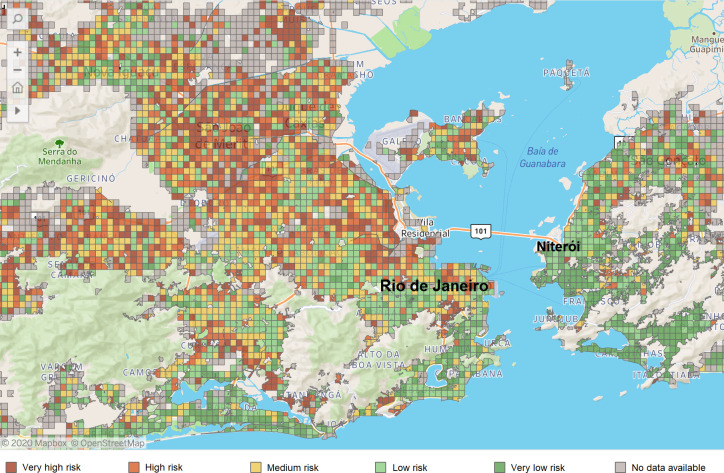
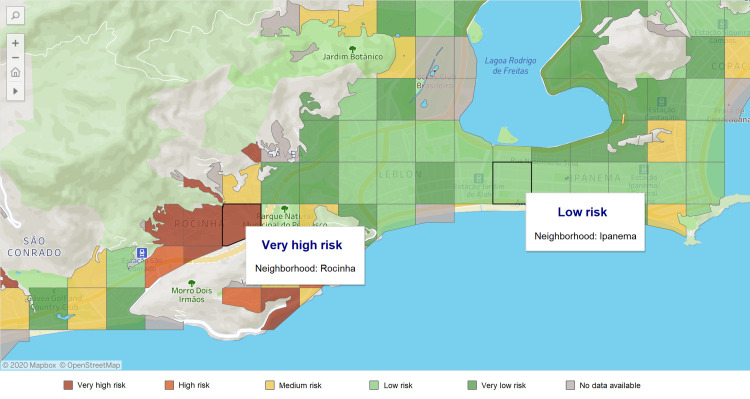
Materials and methods: We performed a retrospective analysis of individuals registered in "Dados do Bem," a Brazilian app-based symptom tracker. We applied machine learning techniques and provided a SARS-CoV-2 infection risk map of Rio de Janeiro city.
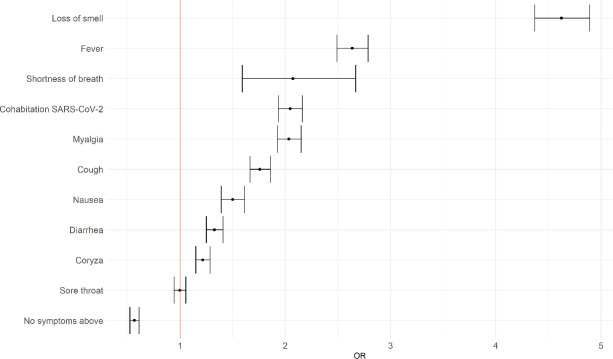
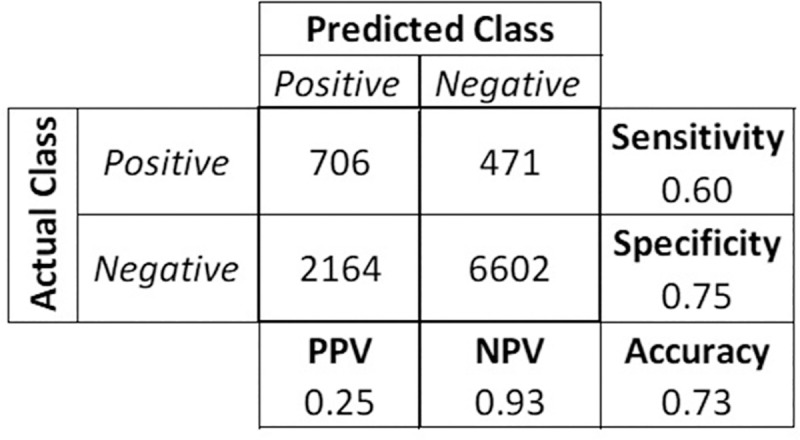
Results: From April 28 to July 16, 2020, 337,435 individuals registered their symptoms through the app. Of these, 49,721 participants were tested for SARS-CoV-2 infection, being 5,888 (11.8%) positive. Among self-reported symptoms, loss of smell (OR[95%CI]: 4.6 [4.4-4.9]), fever (2.6 [2.5-2.8]), and shortness of breath (2.1 [1.6-2.7]) were independently associated with SARS-CoV-2 infection. Our final model obtained a competitive performance, with only 7% of false-negative users predicted as negatives (NPV = 0.93). The model was incorporated by the "Dados do Bem" app aiming to prioritize users for testing. We developed an external validation in the city of Rio de Janeiro. We found that the proportion of positive results increased significantly from 14.9% (before using our model) to 18.1% (after the model).
Conclusions: Our results showed that the combination of symptoms might predict SARS-Cov-2 infection and, therefore, can be used as a tool by decision-makers to refine testing and disease control strategies.
Conflict of interest statement
The authors have declared that no competing interests exist.
Figures
References
-
- Coronavirus Update (Live). [cited 7 Jul 2020]. Available: https://www.worldometers.info/coronavirus/
-
- Zhu G, Li J, Meng Z, Yu Y, Li Y, Tang X, et al. Learning from Large-Scale Wearable Device Data for Predicting Epidemics Trend of COVID-19. Discrete Dynamics in Nature and Society. 2020;2020: 1–8. 10.1155/2020/6152041 - DOI
Publication types
MeSH terms
LinkOut - more resources
Full Text Sources
Other Literature Sources
Medical
Miscellaneous
