. 2021 Mar 25;16(3):e0249037.
doi: 10.1371/journal.pone.0249037. eCollection 2021.

A statistical analysis of the novel coronavirus (COVID-19) in Italy and Spain

Affiliations

A statistical analysis of the novel coronavirus (COVID-19) in Italy and Spain

Jeffrey Chu. PLoS One. .

Abstract

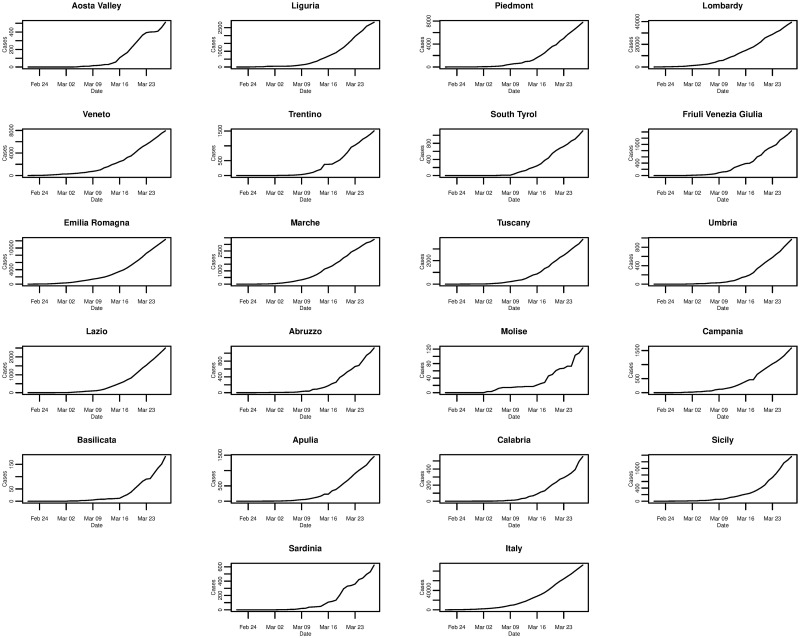
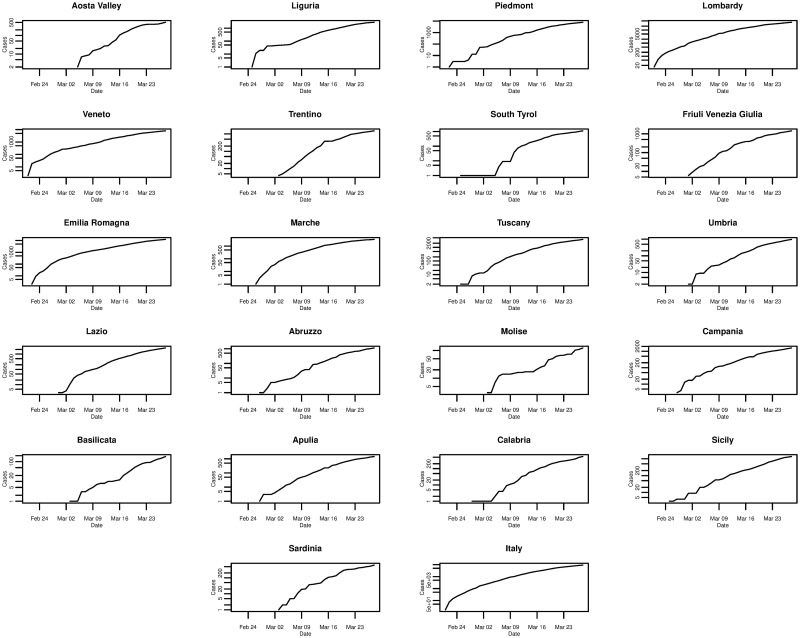
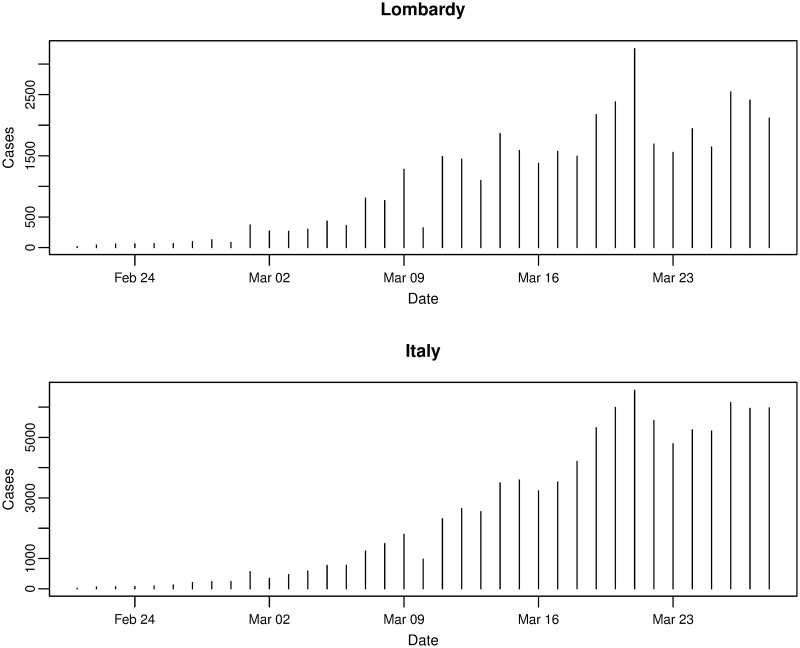
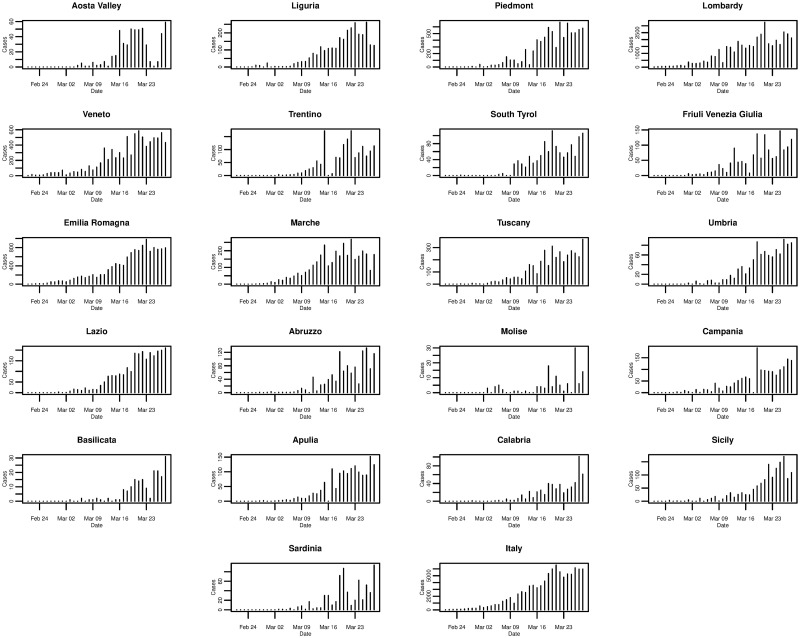
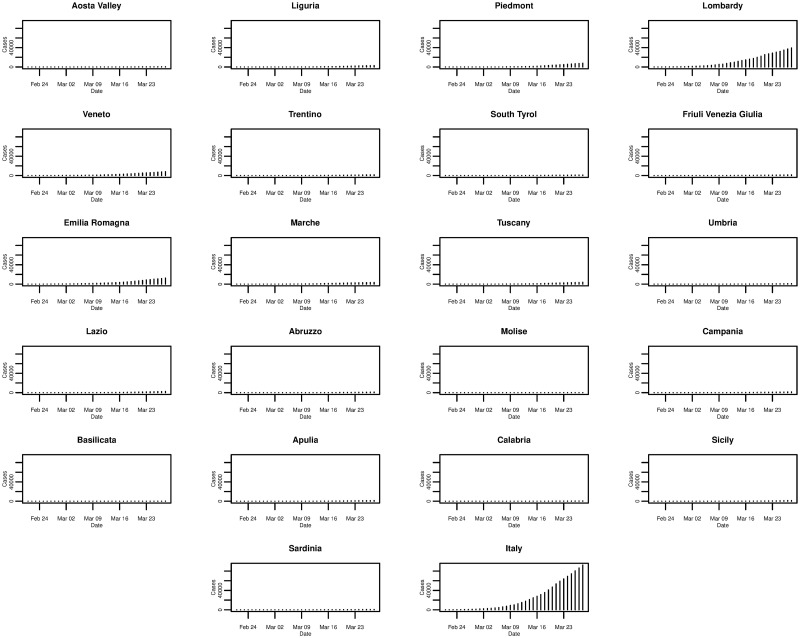
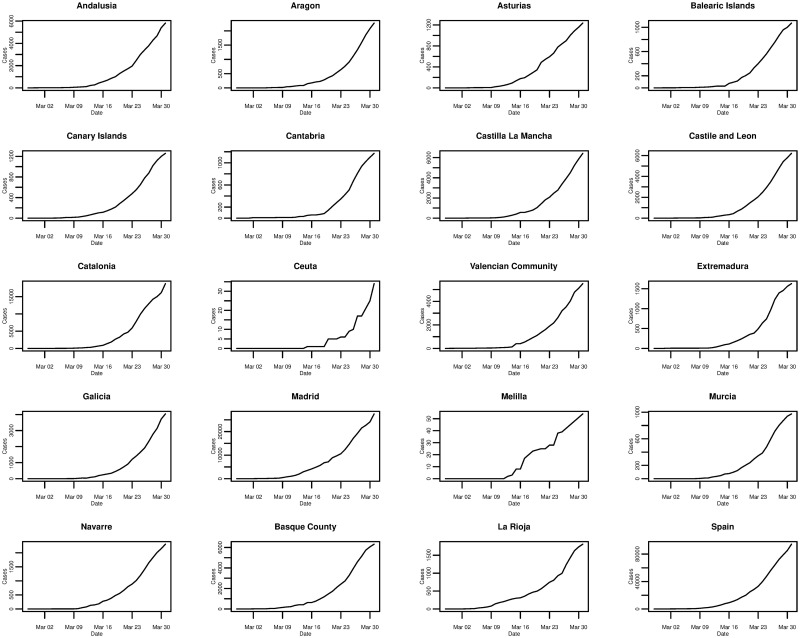
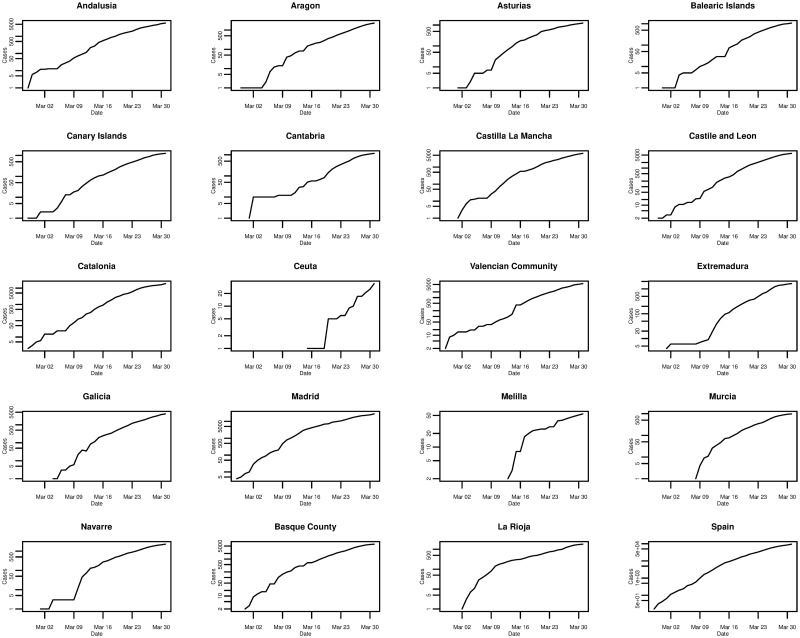
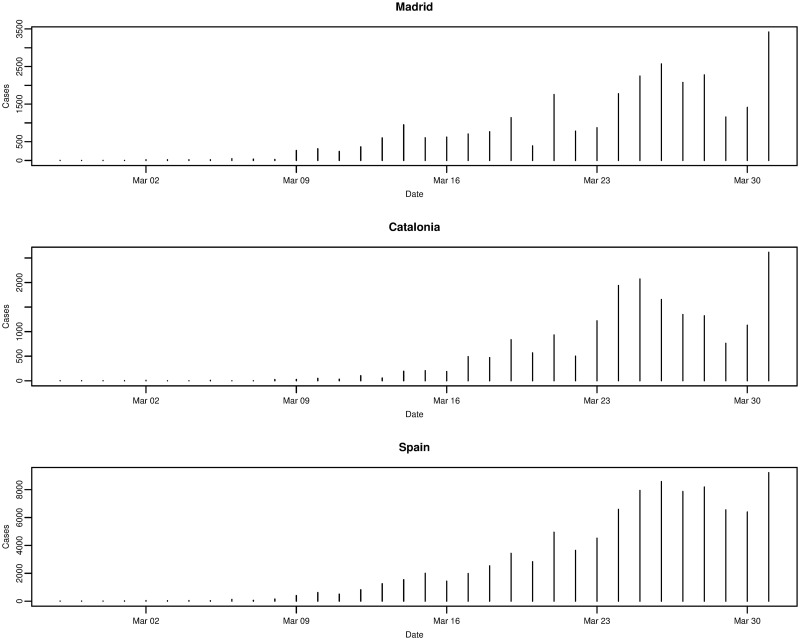
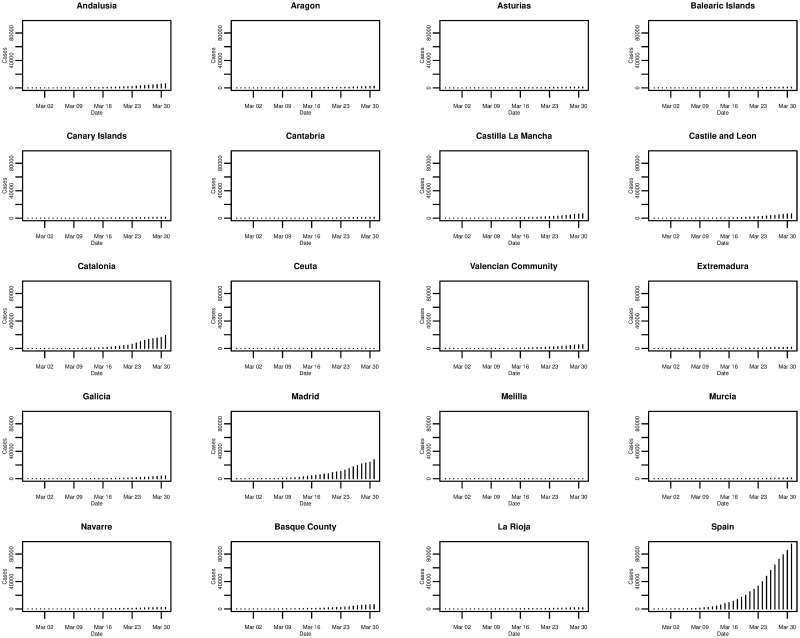
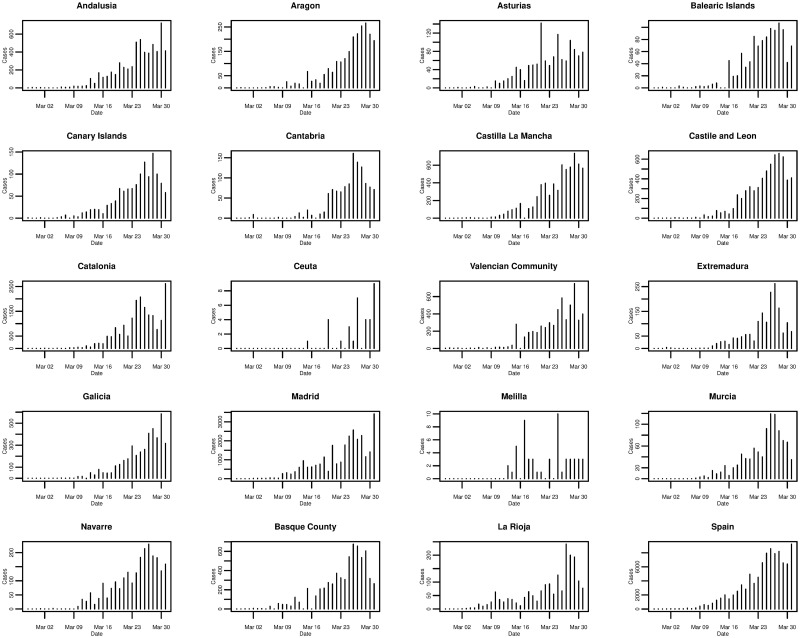
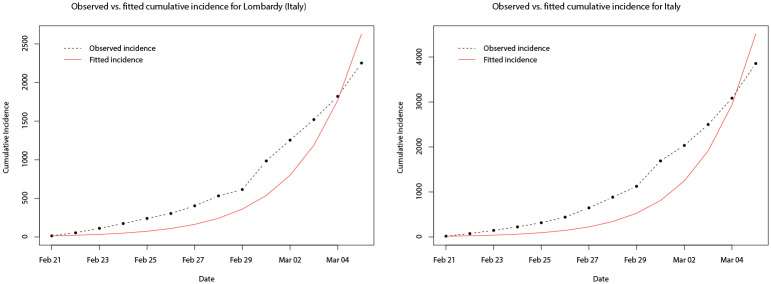
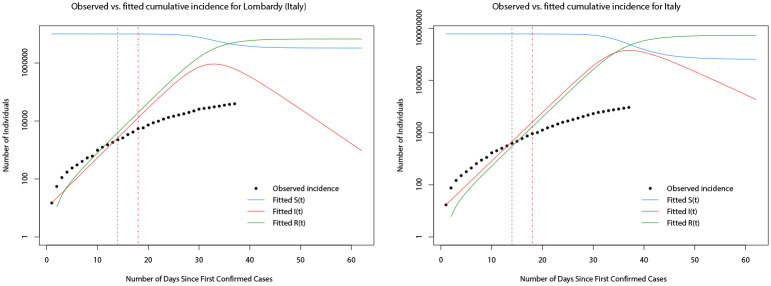
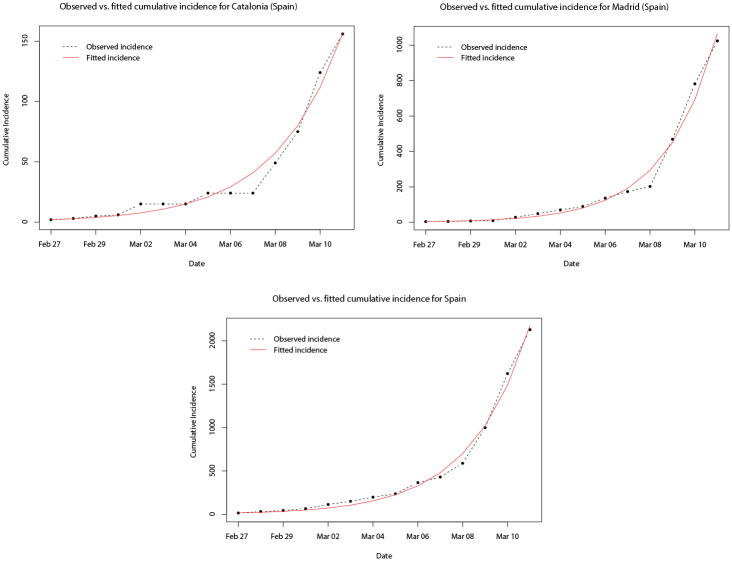
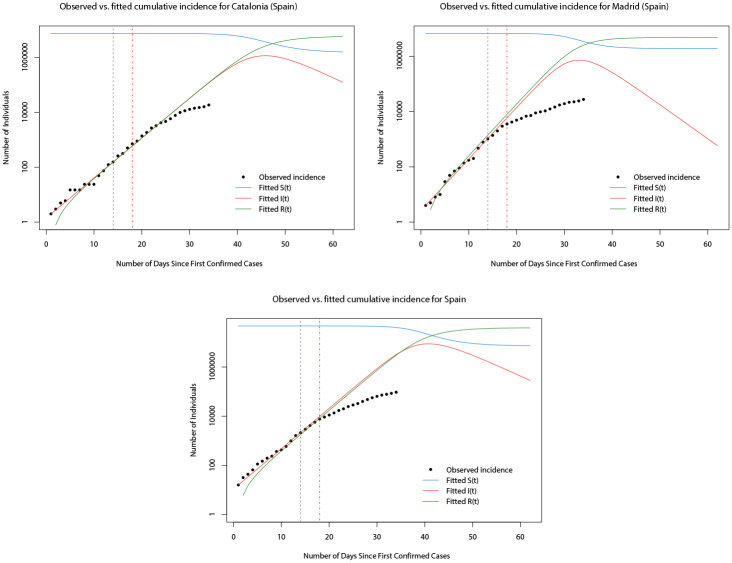
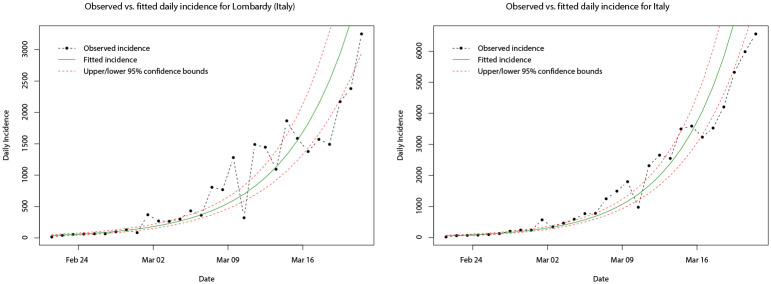
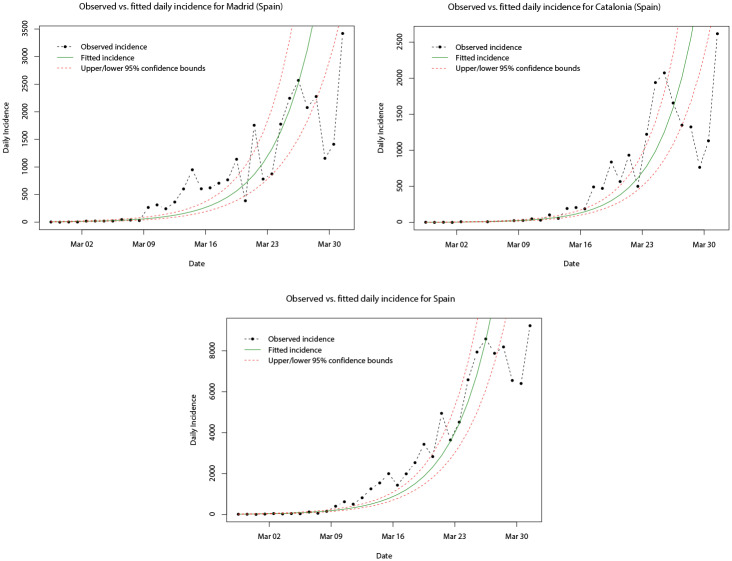
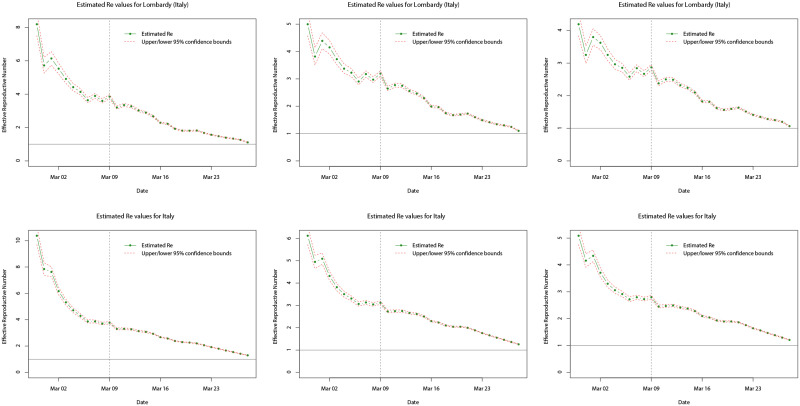
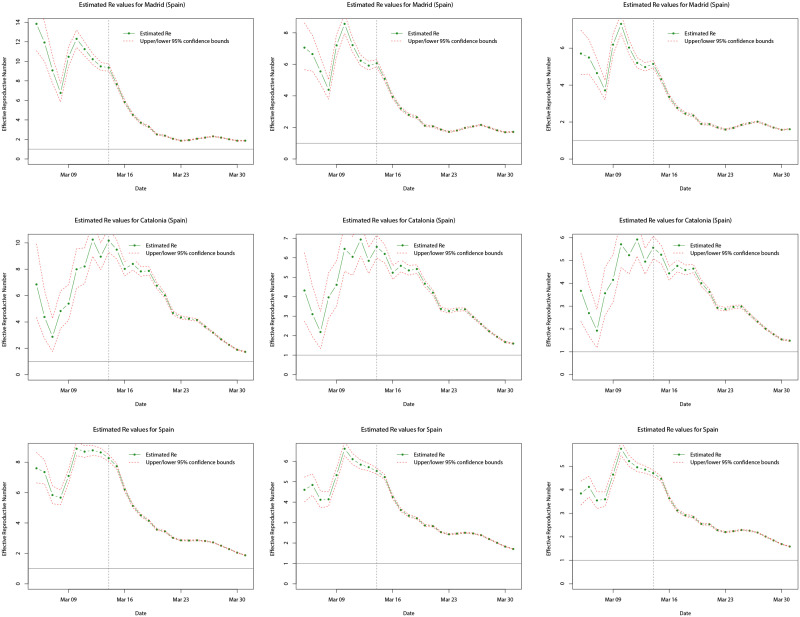
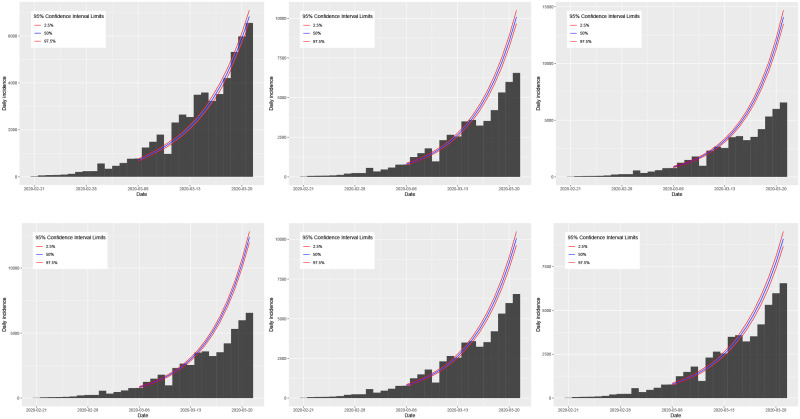
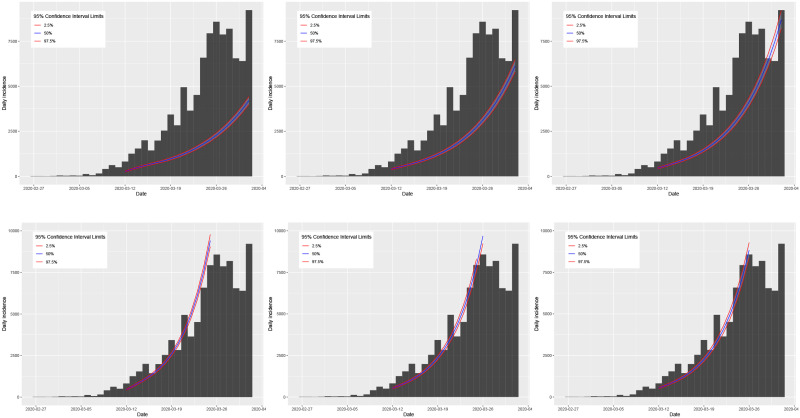
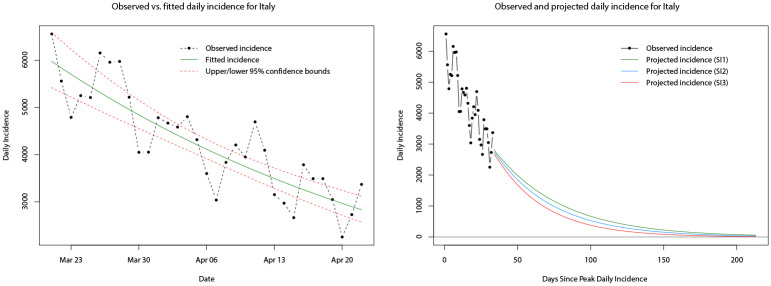
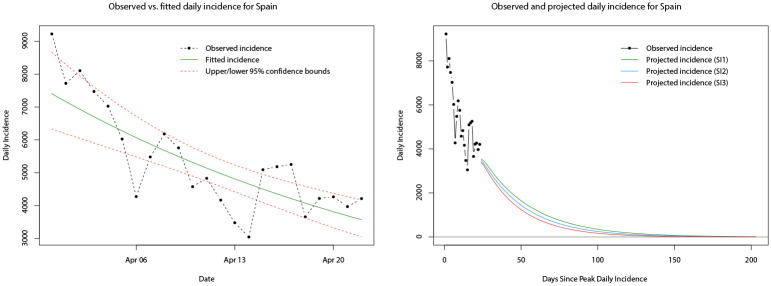
The novel coronavirus (COVID-19) that was first reported at the end of 2019 has impacted almost every aspect of life as we know it. This paper focuses on the incidence of the disease in Italy and Spain-two of the first and most affected European countries. Using two simple mathematical epidemiological models-the Susceptible-Infectious-Recovered model and the log-linear regression model, we model the daily and cumulative incidence of COVID-19 in the two countries during the early stage of the outbreak, and compute estimates for basic measures of the infectiousness of the disease including the basic reproduction number, growth rate, and doubling time. Estimates of the basic reproduction number were found to be larger than 1 in both countries, with values being between 2 and 3 for Italy, and 2.5 and 4 for Spain. Estimates were also computed for the more dynamic effective reproduction number, which showed that since the first cases were confirmed in the respective countries the severity has generally been decreasing. The predictive ability of the log-linear regression model was found to give a better fit and simple estimates of the daily incidence for both countries were computed.


Conflict of interest statement

The authors have declared that no competing interests exist.

Figures

Fig 1
Fig 1. Daily cumulative incidence of the 21 Italian regions and Italy for the period of 21/02/2020 to 28/03/2020, inclusive.
Fig 2
Fig 2. Daily cumulative incidence (log scale) of the 21 Italian regions and Italy for the period of 21/02/2020 to 28/03/2020, inclusive.
Fig 3
Fig 3. Daily incremental incidence of the Lombardy region and Italy for the period of 21/02/2020 to 28/03/2020, inclusive.
Fig 4
Fig 4. Daily incremental incidence of the 21 Italian regions and Italy for the period of 21/02/2020 to 28/03/2020, inclusive.
Fig 5
Fig 5. Daily incremental incidence (common scale) of the 21 Italian regions and Italy for the period of 21/02/2020 to 28/03/2020, inclusive.
Fig 6
Fig 6. Daily cumulative incidence of the 19 Spanish regions and Spain for the period of 27/02/2020 to 31/03/2020, inclusive.
Fig 7
Fig 7. Daily cumulative incidence (log scale) of the 19 Spanish regions and Spain for the period of 27/02/2020 to 31/03/2020, inclusive.
Fig 8
Fig 8. Daily incremental incidence of the Madrid and Catalonia regions, and Spain for the period of 27/02/2020 to 31/03/2020, inclusive.
Fig 9
Fig 9. Daily incremental incidence (common scale) of the 19 Spanish regions and Spain for the period of 27/02/2020 to 31/03/2020, inclusive.
Fig 10
Fig 10. Daily incremental incidence of the 19 Spanish regions and Spain for the period of 27/02/2020 to 31/03/2020, inclusive.
Fig 11
Fig 11. Plots of the observed (dot-dashed black line) and fitted (solid red line) cumulative incidence for Lombardy and Italy, for the 14 days after the first confirmed cases.
Fig 12
Fig 12. Plots of the observed cumulative incidence (solid black points) for Lombardy and Italy, and the fitted values of S(t) (solid blue line), I(t) (solid red line), and R(t) (solid green line) for the two months after the first confirmed cases.
Fig 13
Fig 13. Plots of the observed (dot-dashed black line) and fitted (solid red line) cumulative incidence for Madrid, Catalonia, and Spain, for the 14 days after the first confirmed cases.
Fig 14
Fig 14. Plots of the observed cumulative incidence (solid black points) for Madrid, Catalonia, and Spain, and the fitted values of S(t) (solid blue line), I(t) (solid red line), and R(t) (solid green line) for the two months after the first confirmed cases.
Fig 15
Fig 15. Plots of the observed cumulative incidence (dot-dashed black line) for Lombardy and Italy, and the fitted log-linear model (solid green line) for their respective growth phases.
Upper and lower limits of the 95% confidence intervals are indicated by the dashed red lines.
Fig 16
Fig 16. Plots of the observed cumulative incidence (dot-dashed black line) for Madrid, Catalonia, and Spain, and the fitted log-linear model (solid green line) for their respective growth phases.
Upper and lower limits of the 95% confidence intervals are indicated by the dashed red lines.
Fig 17
Fig 17. Plots of the estimated mean Re values (dot-dashed green line) for Lombardy (top row) and Italy (bottom row) over the whole sample period, using serial interval distributions SI1 (left), SI2 (middle), and SI3 (right).
Upper and lower limits of the 95% confidence intervals for the mean are indicated by the red dashed lines, and the grey dotted line indicates the date at which the national lock down becomes effective.
Fig 18
Fig 18. Plots of the estimated mean Re values (dot-dashed green line) for Madrid (top row), Catalonia (middle row), and Spain (bottom row) over the whole sample period, using serial interval distributions SI1 (left), SI2 (middle), and SI3 (right).
Upper and lower limits of the 95% confidence intervals for the mean are indicated by the red dashed lines, and the grey dotted line indicates the date at which the national lock down becomes effective.
Fig 19
Fig 19. Plots of the observed daily incidence (histograms) in Italy during its growth phase and the predicted daily incidence (purple solid line) estimated using the SIR model (top row) and log-linear model (bottom row) assuming serial interval distributions of SI1 (left), SI2 (middle), and SI3 (right).
95% confidence intervals for the predicted incidence are indicated by the shaded light purple regions.
Fig 20
Fig 20. Plots of the observed daily incidence (histograms) in Spain during its growth phase and the predicted daily incidence (purple solid line) estimated using the SIR model (top row) and log-linear model (bottom row) assuming serial interval distributions of SI1 (left), SI2 (middle), and SI3 (right).
95% confidence intervals for the predicted incidence are indicated by the shaded light purple regions.
Fig 21
Fig 21. Plots of the observed (dot-dashed black line) and fitted daily incidence (solid green line) for Italy during its decay phase, with upper and lower limits of the 95% confidence interval indicated by the red dashed lines (left).
Plots of the observed (dot-dashed black line) and projected daily incidence for the next 180 days using the log-linear model and serial interval distributions SI1 (green line), SI2 (blue line), and SI3 (red line) (right).
Fig 22
Fig 22. Plots of the observed (dot-dashed black line) and fitted daily incidence (solid green line) for Spain during its decay phase, with upper and lower limits of the 95% confidence interval indicated by the red dashed lines (left).
Plots of the observed (dot-dashed black line) and projected daily incidence for the next 180 days using the log-linear model and serial interval distributions SI1 (green line), SI2 (blue line), and SI3 (red line) (right).

References

    1. Center for Systems Science and Engineering (CSSE) at Johns Hopkins University (JHU), 2020. Coronavirus COVID-19 (2019-nCoV). Available at: https://gisanddata.maps.arcgis.com/apps/opsdashboard/index.html#/bda7594....
    1. Wu J.T., Leung K., Bushman M., Kishore N., Niehus R., de Salazar P.M., et al. 2020a. Estimating clinical severity of COVID-19 from the transmission dynamics in Wuhan, China. Nature Medicine, 26, pp. 506–510. 10.1038/s41591-020-0822-7 - DOI - PMC - PubMed
    1. Li Q., Guan X., Wu P., Wang X., Zhou L., Tong Y., et al. 2020. Early Transmission Dynamics in Wuhan, China, of Novel Coronavirus–Infected Pneumonia. The New England Journal of Medicine, 382, pp. 1199–1207. 10.1056/NEJMoa2001316 - DOI - PMC - PubMed
    1. Wu J.T., Leung K. and Leung G.M., 2020c. Nowcasting and forecasting the potential domestic and international spread of the 2019-nCoV outbreak originating in Wuhan, China: a modelling study. The Lancet, 395, pp. 689–697. 10.1016/S0140-6736(20)30260-9 - DOI - PMC - PubMed
    1. Zhu N., Zhang D., Wang W., Li X., Yang B., Song J., et al. 2020. A Novel Coronavirus from Patients with Pneumonia in China, 2019. The New England Journal of Medicine, 382, pp. 727–733. 10.1056/NEJMoa2001017 - DOI - PMC - PubMed