

An examination of five theoretical foundations associated with localized thermosensory testing
- PMID: 33765169
- PMCID: PMC8192324
- DOI: 10.1007/s00421-021-04670-z
An examination of five theoretical foundations associated with localized thermosensory testing
Abstract
Purpose: To assess five theoretical foundations underlying thermosensory testing using local thermal stimuli.
Methods: Thermal sensation, discomfort and the confidence of thermal sensation scores were measured in 9 female and 8 male volunteers in response to 17 physical contact temperature stimuli, ranging between 18-42 °C. These were applied to their dorsal forearm and lateral torso, across two sessions.
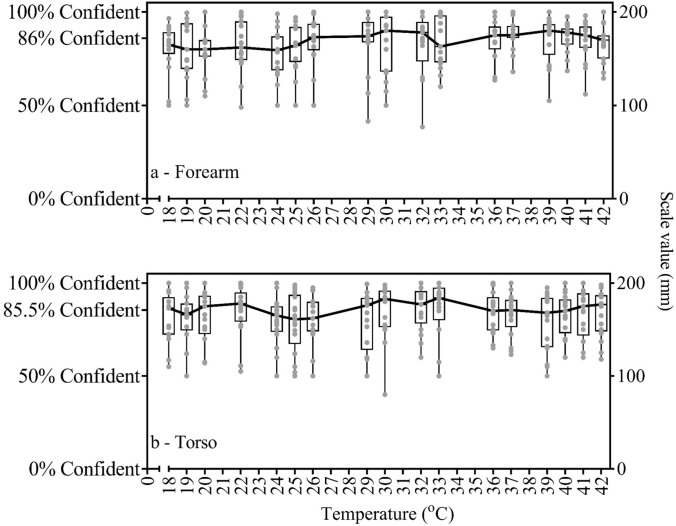
Results: Thermal sensation to physical temperature relationships followed a positive linear and sigmoidal fit at both forearm (r2 = 0.91/r2 = 0.91, respectively) and lateral torso (r2 = 0.90/ r2 = 0.91, respectively). Thermal discomfort to physical temperature relationships followed second and third-order fits at both forearm (r2 = 0.33/r2 = 0.34, respectively) and lateral torso (r2 = 0.38/r2 = 0.39, respectively) test sites. There were no sex-related or regional site differences in thermal sensation and discomfort across a wide range of physical contact temperatures. The median confidence of an individual's thermal sensation rating was measured at 86%.
Conclusion: The relation between thermal sensation and physical contact temperature was well described by both linear and sigmoidal models, i.e., the distance between the thermal sensation anchors is close to equal in terms of physical temperatures changes for the range studied. Participants rated similar thermal discomfort level in both cold and hot thermal stimuli for a given increase or decrease in physical contact temperature or thermal sensation. The confidence of thermal sensation rating did not depend on physical contact temperature.
Keywords: Confidence; Experimental design; Thermal discomfort; Thermal sensation; Thermosensory.
Conflict of interest statement
The authors declare that they have no conflicts of interests.
Figures


References
-
- Bertaux E, Lewandowski M, Derler S. Relationship between friction and tactile properties for woven and knitted fabrics. Text Res J. 2007;77:387–396. doi: 10.1177/0040517507074165. - DOI
-
- Cabanac M. Plaisir ou déplaisir de la sensation thermique et homeothermie. Physiol Behav. 1969;4:359–364. doi: 10.1016/0031-9384(69)90189-9. - DOI
-
- Cândido C, de Dear R, Ohba M. Effects of artificially induced heat acclimatization on subjects’ thermal and air movement preferences. Build Environ. 2012;49:251–258. doi: 10.1016/j.buildenv.2011.09.032. - DOI
MeSH terms
LinkOut - more resources
Full Text Sources
Other Literature Sources
