. 2021 Jun;64(6):1358-1374.
doi: 10.1007/s00125-021-05435-1. Epub 2021 Mar 25.

The hepatokine fetuin-A disrupts functional maturation of pancreatic beta cells

Affiliations

The hepatokine fetuin-A disrupts functional maturation of pancreatic beta cells

Felicia Gerst et al. Diabetologia. 2021 Jun.

Abstract

Aims/hypothesis: Neonatal beta cells carry out a programme of postnatal functional maturation to achieve full glucose responsiveness. A partial loss of the mature phenotype of adult beta cells may contribute to a reduction of functional beta cell mass and accelerate the onset of type 2 diabetes. We previously found that fetuin-A, a hepatokine increasingly secreted by the fatty liver and a determinant of type 2 diabetes, inhibits glucose-stimulated insulin secretion (GSIS) of human islets. Since fetuin-A is a ubiquitous fetal glycoprotein that declines peripartum, we examined here whether fetuin-A interferes with the functional maturity of beta cells.

Methods: The effects of fetuin-A were assessed during in vitro maturation of porcine neonatal islet cell clusters (NICCs) and in adult human islets. Expression alterations were examined via microarray, RNA sequencing and reverse transcription quantitative real-time PCR (qRT-PCR), proteins were analysed by western blotting and immunostaining, and insulin secretion was quantified in static incubations.

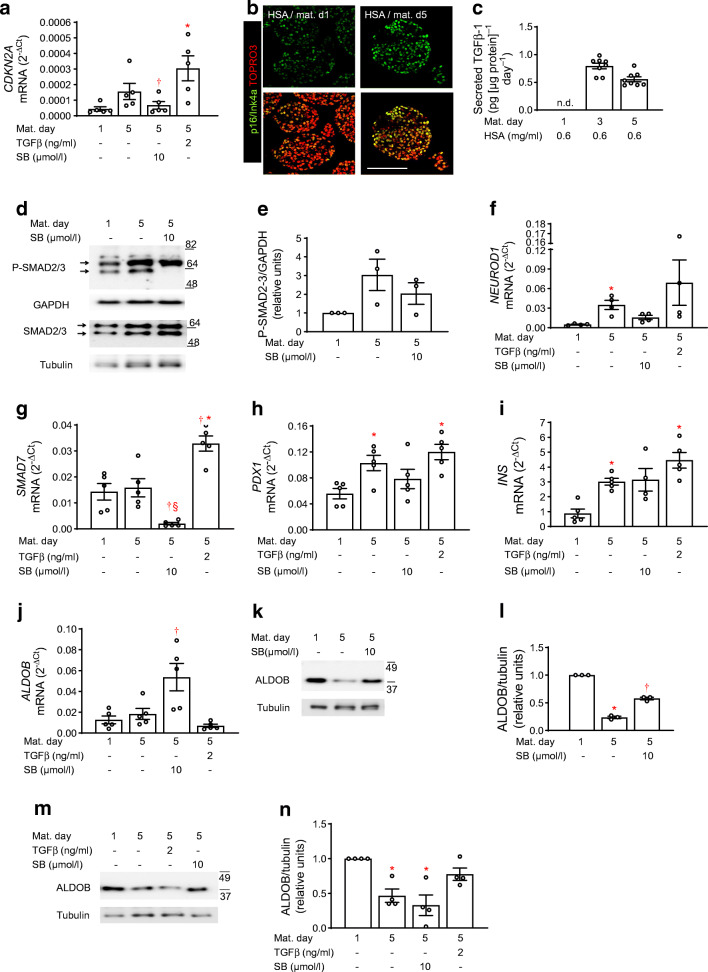
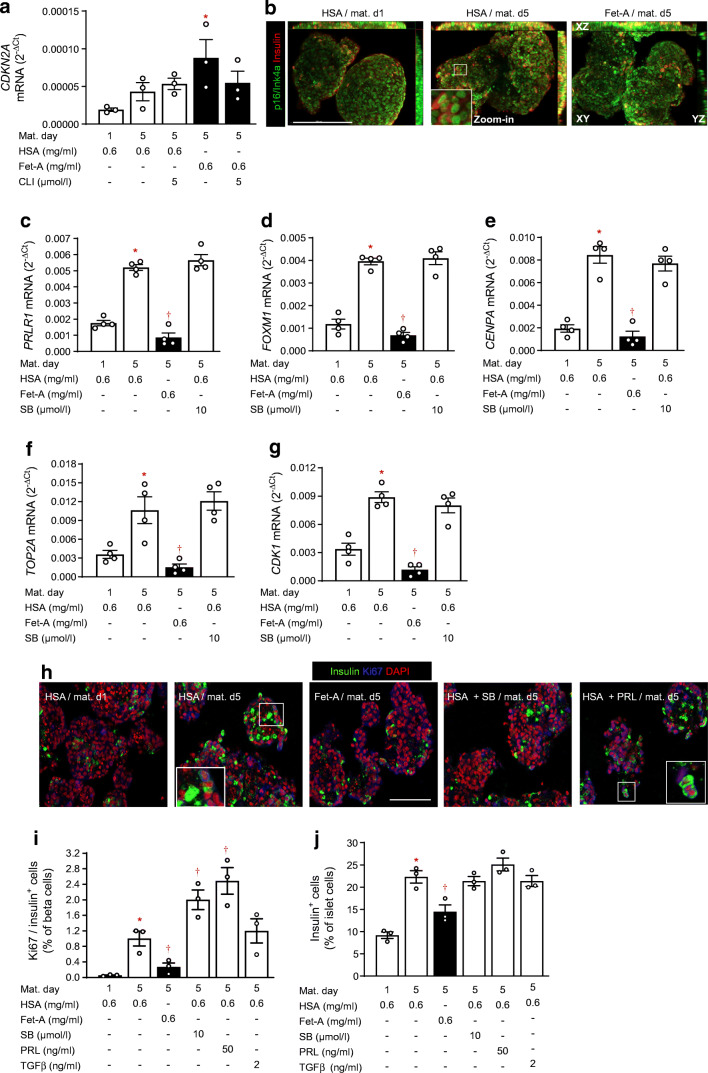
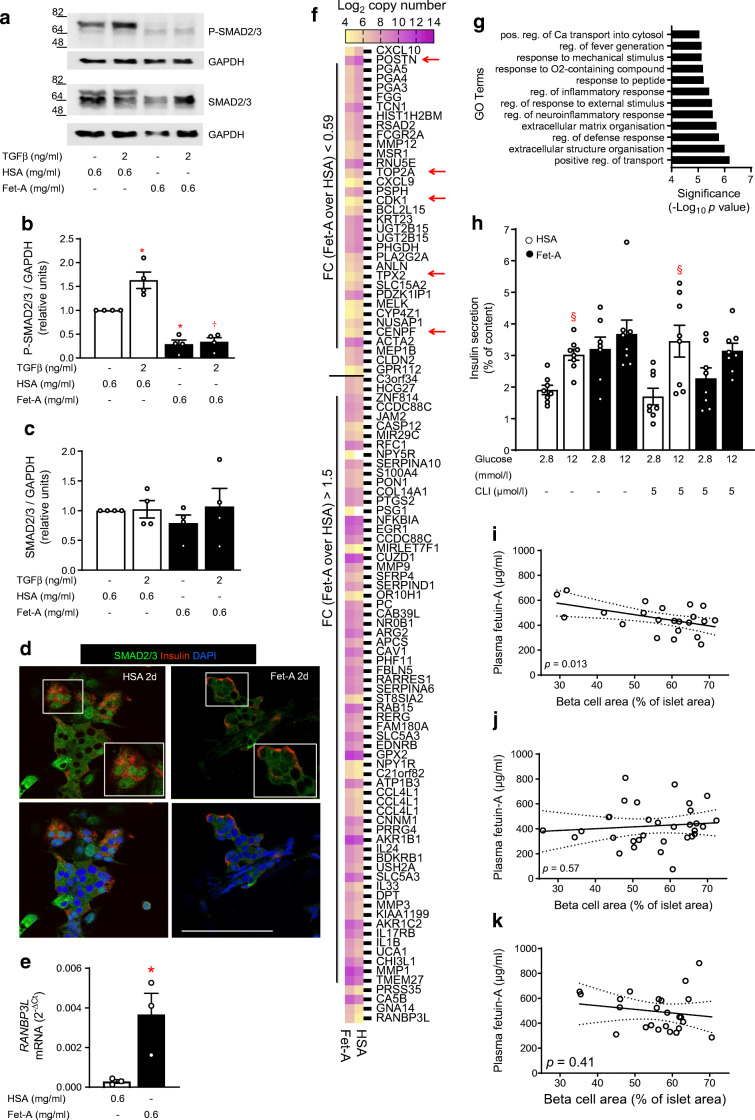
Results: NICC maturation was accompanied by the gain of glucose-responsive insulin secretion (twofold stimulation), backed up by mRNA upregulation of genes governing beta cell identity and function, such as NEUROD1, UCN3, ABCC8 and CASR (Log2 fold change [Log2FC] > 1.6). An active TGFβ receptor (TGFBR)-SMAD2/3 pathway facilitates NICC maturation, since the TGFBR inhibitor SB431542 counteracted the upregulation of aforementioned genes and de-repressed ALDOB, a gene disallowed in mature beta cells. In fetuin-A-treated NICCs, upregulation of beta cell markers and the onset of glucose responsiveness were suppressed. Concomitantly, SMAD2/3 phosphorylation was inhibited. Transcriptome analysis confirmed inhibitory effects of fetuin-A and SB431542 on TGFβ-1- and SMAD2/3-regulated transcription. However, contrary to SB431542 and regardless of cMYC upregulation, fetuin-A inhibited beta cell proliferation (0.27 ± 0.08% vs 1.0 ± 0.1% Ki67-positive cells in control NICCs). This effect was sustained by reduced expression (Log2FC ≤ -2.4) of FOXM1, CENPA, CDK1 or TOP2A. In agreement, the number of insulin-positive cells was lower in fetuin-A-treated NICCs than in control NICCs (14.4 ± 1.2% and 22.3 ± 1.1%, respectively). In adult human islets fetuin-A abolished glucose responsiveness, i.e. 1.7- and 1.1-fold change over 2.8 mmol/l glucose in control- and fetuin-A-cultured islets, respectively. In addition, fetuin-A reduced SMAD2/3 phosphorylation and suppressed expression of proliferative genes. Of note, in non-diabetic humans, plasma fetuin-A was negatively correlated (p = 0.013) with islet beta cell area.

Conclusions/interpretation: Our results suggest that the perinatal decline of fetuin-A relieves TGFBR signalling in islets, a process that facilitates functional maturation of neonatal beta cells. Functional maturity remains revocable in later life, and the occurrence of a metabolically unhealthy milieu, such as liver steatosis and elevated plasma fetuin-A, can impair both function and adaptive proliferation of beta cells.

Data availability: The RNAseq datasets and computer code produced in this study are available in the Gene Expression Omnibus (GEO): GSE144950; https://www.ncbi.nlm.nih.gov/geo/query/acc.cgi?acc=GSE144950.

Keywords: Adaptive proliferation; FOXM1; Fetuin-A; Functional maturity; Pancreatic beta cells; TGFBR–SMAD2/3.


Figures

Fig. 1
Fig. 1
Fetuin-A impairs functional maturation of neonatal beta cells. NICCs were maturated for 5 days in maturation medium supplemented with HSA or fetuin-A and TLR4 inhibitor CLI-095 as indicated and described under Methods. (ag; i) Relative mRNA levels (ΔCt vs RPS13) assessed by qRT-PCR of (a) INS (encoding insulin), (b) PDX1, (c) NEUROD1, (d) MAFA, (e) GCK (encoding glucokinase), (f) SYT4 (encoding synaptotagmin 4), (g) SYT7 and (i) IL1B, expressed as mean ± SEM of n = 3 independent NICC preparations. (h) Representative confocal images from n = 4 independent NICC preparations immunostained for insulin (green; upper panels) or PDX1 (green; lower panels) at the beginning (HSA/mat. d1) and at the end of maturation in standard medium (HSA/mat. d5) or in the presence of fetuin-A (Fet-A/mat. d5); nuclei are stained with TOPRO3 (red); scale bar 100 μm. (jk) Representative western blot of PDX1 in maturated NICCs in control (HSA/d5) or fetuin-A-supplemented (Fet-A/d5) medium and quantitative analysis expressed as mean ± SEM of n = 3 independent NICC preparations. (l) Insulin secretion expressed as % of insulin content of NICCs maturated in standard (HSA/d5; white bars) or fetuin-A-containing (Fet-A/d5; black bars) medium and presented as mean ± SEM of n = 8–30 replicates out of nine independent NICC preparations. (ag, k) Significant differences (ANOVA) are: *p < 0.05 vs HSA/d1; p < 0.05 vs HSA/d5; §p < 0.05 vs HSA + CLI/d5; (l) significant differences (ANOVA) are *p < 0.05 vs HSA/2.8 mmol/l glucose + forskolin; p < 0.05 vs respective 2.8 mmol/l glucose (without forskolin); p< 0.05 vs respective 12 mmol/l glucose (without forskolin); p < 0.05 vs Fet-A/12 mmol/l glucose + forskolin; §§p < 0.01 (unpaired t test) vs HSA/2.8 mmol/l glucose. CLI, CLI-095; d, day; Fet-A, fetuin-A; Mat., maturation
Fig. 2
Fig. 2
Inhibition of TGFBR signalling impairs NICC maturation. NICCs were maturated for 5 days in standard medium or in medium containing HSA + SB431542 or HSA + TGFβ-1 as indicated and described under Methods. (a; fj) Relative mRNA levels (ΔCt vs RPS13) assessed by qRT-PCR of (a) CDKN2A (encoding p16/Ink4a), (f) NEUROD1, (g) SMAD7, (h) PDX1, (i) INS and (j) ALDOB, expressed as mean ± SEM of n = 4–5 independent NICC preparations. (b) Representative confocal images from n = 4 independent NICC preparations immunostained for p16/Ink4a (green) at the beginning (HSA/mat. d1) and at the end (HSA/mat. d5) of maturation in standard medium; nuclei are stained with TOPRO3 (red); scale bar 100 μm. (c) TGFβ-1 (pg [μg protein]−1 day−1) secreted by NICCs into culture medium at maturation d1, d3 and d5 expressed as mean ± SEM of n = 8 distinct NICC preparations. (d, e; kn) Representative western blots of (d, e) P-SMAD2/3 and SMAD2/3 and (kn) ALDOB and respective quantitative analysis expressed as mean ± SEM of (d, e; k, l) n = 3 and (m, n) n = 4 independent NICC preparations; tubulin and GAPDH were used as loading controls. Significant effects (ANOVA) are *p < 0.05 vs maturation d1 (HSA/d1); p < 0.05 vs maturation d5 (HSA/d5); §p < 0.05 vs TGFβ-1/d5. d, day; Mat. Maturation; SB, SB431542; TGFβ, TGFβ-1
Fig. 3
Fig. 3
Fetuin-A inhibits TGFBR–SMAD2/3 signalling and NICC maturation. NICCs were maturated for 5 days in HSA- or fetuin-A-containing medium as described under Methods. (ac; eh) Representative western blots of (ac) P-SMAD2/3 and SMAD2/3 and (eh) cMYC and respective quantitative analysis expressed as mean ± SEM of (ac) n = 3, (e, f) n = 7 and (g, h) n = 5 distinct NICC preparations. (d; il) Relative mRNA levels (ΔCt vs RPS13) of (d) SNAI1, (i) UCN3, (j) ABCC8, (k) PCSK1 and (l) G6PC2 expressed as mean ± SEM of n = 4 independent NICC preparations; significant effects (ANOVA) are *p < 0.05 vs maturation d1; p < 0.05 vs HSA/maturation d5. d, day; Fet-A, fetuin-A; Mat. Maturation; SB, SB431542
Fig. 4
Fig. 4
Transcriptome analysis of fetuin-A- and SB431542-treated NICCs. (ac) RNAseq analysis of mRNA isolated from NICCs was performed as described in the Methods; (a) RNAseq-based heat map showing functional beta cell genes attributed to GO:0010817 (regulation of hormone levels) and upregulated (Log2FC > 1) in NICCs maturated in standard (HSA/d5 vs HSA/d1; n = 4) medium and changed (+1 > Log2FC < −1) by fetuin-A (Fet-A/d5 vs HSA/d5; n = 2) or by SB431542 (HSA + SB/d5 vs HSA/d5; n = 2). (b) Heat map showing differentially expressed (−1 > Log2FC > 1; Fet-A/d5 vs HSA/d5) genes in NICCs cultured with fetuin-A and isolated from 4-day-old (n = 2) and 12-day-old (n = 2) animals. (c) Upstream regulator analysis showing z score-based heat map of transcriptional regulators activated (z > 2) or inhibited (z <−2) in NICCs cultured in fetuin-A or HSA + SB431542 containing medium as indicated. NICCs were isolated from 4-day-old and 12-day-old animals. d, day; Fet-A, fetuin-A; SB, SB431542
Fig. 5
Fig. 5
Pathway analysis of RNA sequencing in NICCs. RNAseq analysis of mRNA isolated from NICCs was performed as described under Methods. (ac) Top 30 GO terms significantly enriched (p ≤ 10−8) in (a) DEGs upregulated upon maturation in standard medium and in (b, c) DEGs downregulated upon culture with (b) fetuin-A- and (c) HSA + SB431542-containing medium; false discovery rate< 2
Fig. 6
Fig. 6
Fetuin-A inhibits beta cell proliferation. NICCs were cultured as described under Methods. (a; cg) Relative mRNA levels (ΔCt vs RPS13) assessed by qRT-PCR of (a) CDKN2A, (c) PRLR1, (d) FOXM1, (e) CENPA, (f) TOP2A and (g) CDK1 expressed as mean ± SEM of n = 3–4 independent NICC preparations. (b) Maximum intensity projections of NICCs immunostained for p16/Ink4a (green) and insulin (red) preceding (HSA/mat. d1) and following maturation in standard medium (HSA/mat. d5) or in fetuin-A-containing medium (Fet-A/mat. d5); scale bar 200 μm. (h) Representative confocal microscopy pictures of NICCs immunostained for insulin (green) and Ki67 (blue) preceding (HSA/mat. d1) and following maturation in standard medium (HSA/mat. d5) or in medium containing fetuin-A (Fet-A/mat. d5), HSA + SB431542 (HSA + SB), or HSA + prolactin (10 ng/ml, HSA + PRL), as indicated; nuclei were stained with DAPI (red); scale bar 100 μm. (i, j) Percentage of (i) Ki67/insulin co-stained and (j) insulin-stained cells in NICCs cultured as indicated in (h). Results are expressed as mean ± SEM of n = 3 independent NICC preparations. Significant effects (p < 0.05, ANOVA) are *p< 0.05 vs immature NICCs (HSA/mat. d1); p < 0.05 vs maturated NICCs (HSA/mat. d5). CLI, CLI-095 (TLR4 inhibitor); d, day; Fet-A, fetuin-A; Mat., maturation; PRL, prolactin; SB, SB431542
Fig. 7
Fig. 7
Fetuin-A inhibits TGFBR signalling and reduces functional maturity of human islets. Human islets from organ donors (ESM Table 2) were cultured for 2 days as indicated and described under Methods. (ac) Representative western blots of P-SMAD2/3 and SMAD2/3 and respective quantitative analysis expressed as mean ± SEM of n = 4 independent human islet preparations. (d) Confocal microscopy pictures of isolated human islet cells stained for insulin (red) and SMAD2/3 (green); nuclei were stained with DAPI (blue); scale bar 100 μm. (e) Relative mRNA levels (ΔCt vs RPS13) assessed by qRT-PCR and expressed as mean ± SEM of n = 3 independent preparations. (f) Affymetrix-based heat map showing expression level (Log2 copy number) of genes altered by fetuin-A (0.59 > fold change over HSA > 1.5) in isolated human islets cultured for 2 days with HSA or fetuin-A; red arrows indicate fetuin-A downregulated genes known to stimulate proliferation of beta cells. (g) GO terms significantly enriched in fetuin-A-altered DEGs. (h) Insulin secretion expressed as % of content presented as mean ± SEM of n = 8 replicates out of two independent human islet preparations. (ik) Beta cell area was assessed in insulin-stained human pancreatic resections as described in the Methods. Correlation of beta cell area expressed as % of islet area with plasma levels of fetuin-A in (i) n = 22 non-diabetic human donors, (j) n = 32 donors with IGT/IFG and (k) n = 24 type 2 diabetic donors. Significant effects (p < 0.05, ANOVA) *p < 0.05 vs HSA; p < 0.05 vs HSA + TGFβ-1; §p < 0.05 vs respective 2.8 mmol/l glucose. CLI, CLI-095 (TLR4 inhibitor); d, day; FC, fold change; Fet-A, fetuin-A; TGFβ, TGFβ-1

References

    1. Henquin JC, Nenquin M. Immaturity of insulin secretion by pancreatic islets isolated from one human neonate. J Diabetes Investig. 2018;9(2):270–273. doi: 10.1111/jdi.12701. - DOI - PMC - PubMed
    1. Blum B, Hrvatin S, Schuetz C, Bonal C, Rezania A, Melton DA. Functional beta-cell maturation is marked by an increased glucose threshold and by expression of urocortin 3. Nat Biotechnol. 2012;30(3):261–264. doi: 10.1038/nbt.2141. - DOI - PMC - PubMed
    1. Huang C, Walker EM, Dadi PK, et al. Synaptotagmin 4 regulates pancreatic beta cell maturation by modulating the Ca(2+) sensitivity of insulin secretion vesicles. Dev Cell. 2018;45(3):347–361. doi: 10.1016/j.devcel.2018.03.013. - DOI - PMC - PubMed
    1. Gu C, Stein GH, Pan N, et al. Pancreatic beta cells require NeuroD to achieve and maintain functional maturity. Cell Metab. 2010;11(4):298–310. doi: 10.1016/j.cmet.2010.03.006. - DOI - PMC - PubMed
    1. Puri S, Roy N, Russ HA, et al. Replication confers beta cell immaturity. Nat Commun. 2018;9(1):485. doi: 10.1038/s41467-018-02939-0. - DOI - PMC - PubMed

Publication types

MeSH terms