. 2021 Apr 13;54(4):797-814.e6.
doi: 10.1016/j.immuni.2021.03.005. Epub 2021 Mar 11.

Longitudinal profiling of respiratory and systemic immune responses reveals myeloid cell-driven lung inflammation in severe COVID-19

Affiliations

Longitudinal profiling of respiratory and systemic immune responses reveals myeloid cell-driven lung inflammation in severe COVID-19

Peter A Szabo et al. Immunity. .

Abstract

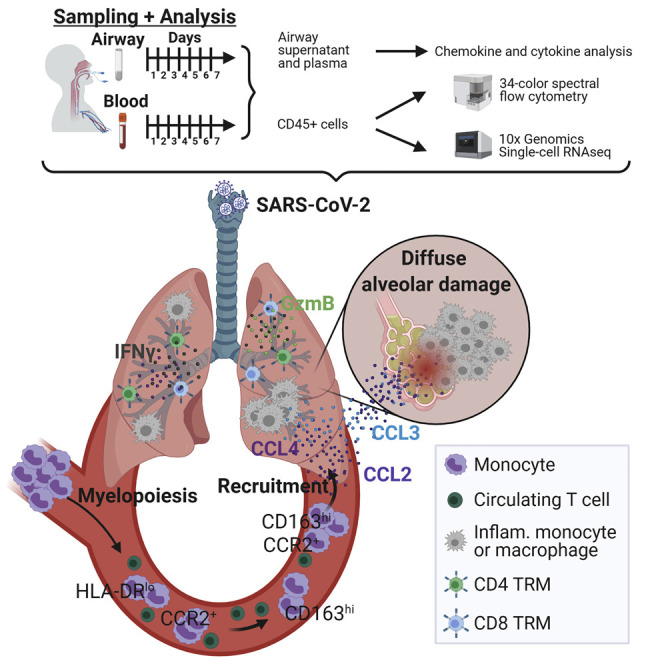
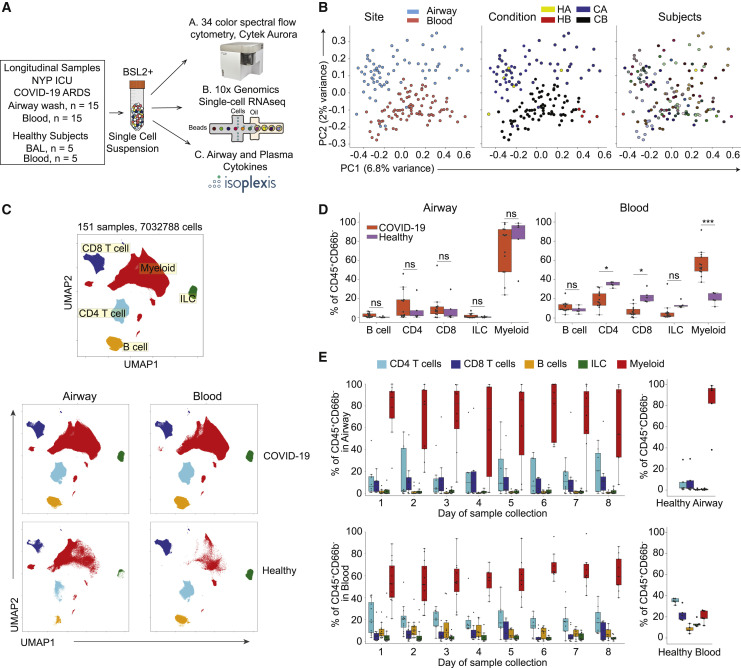
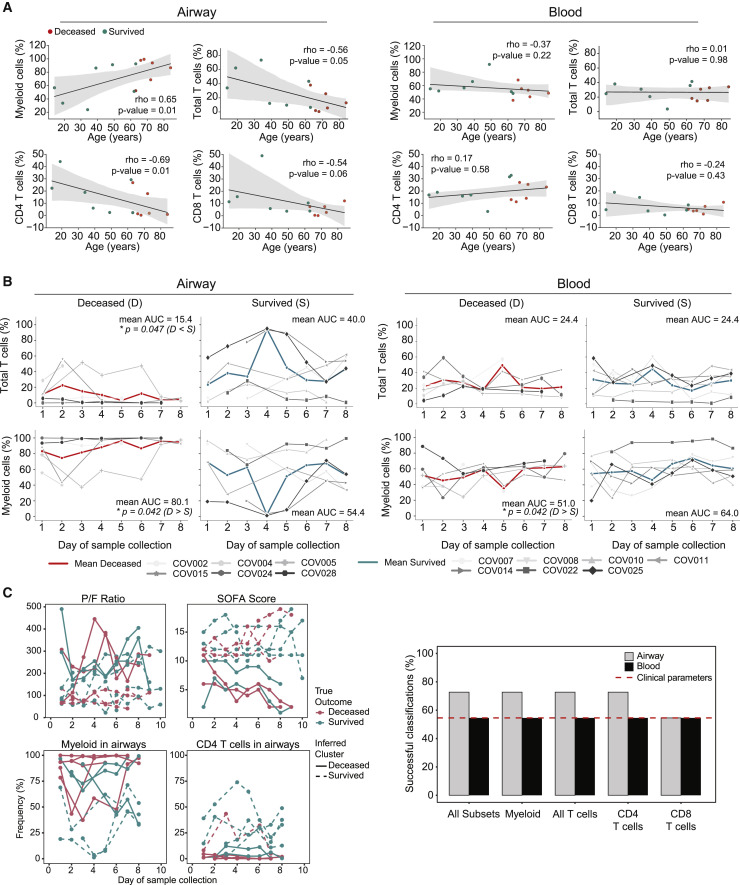
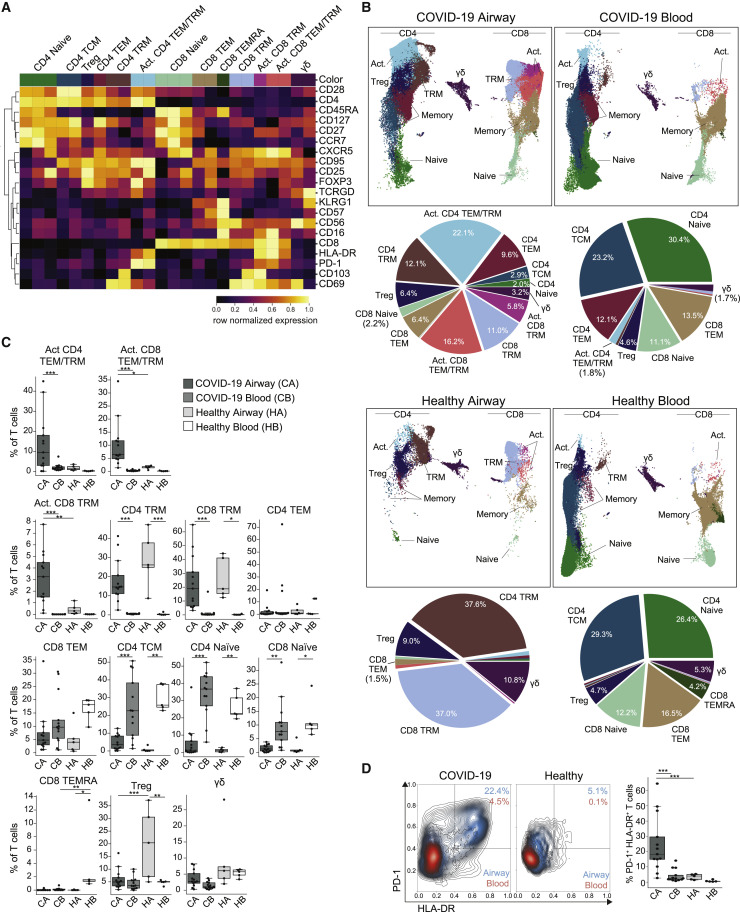
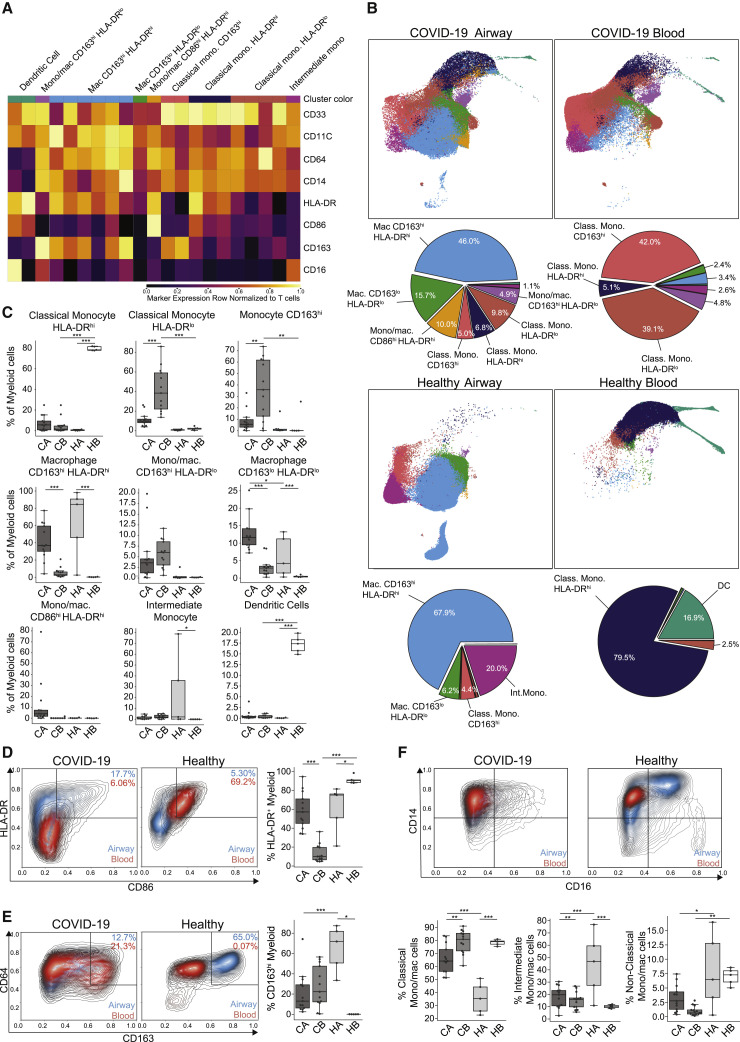
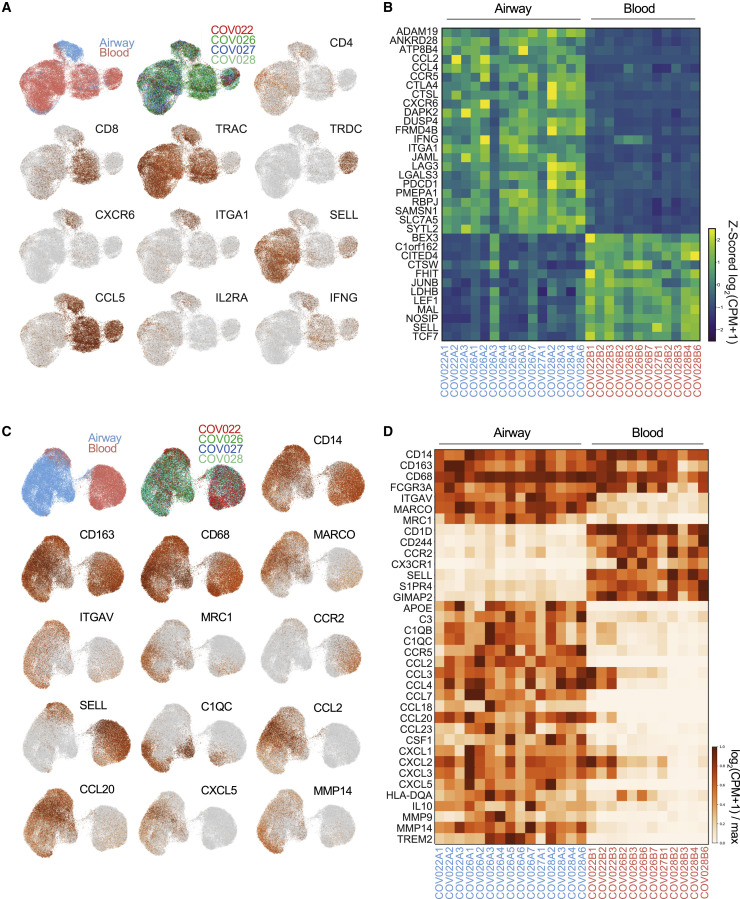
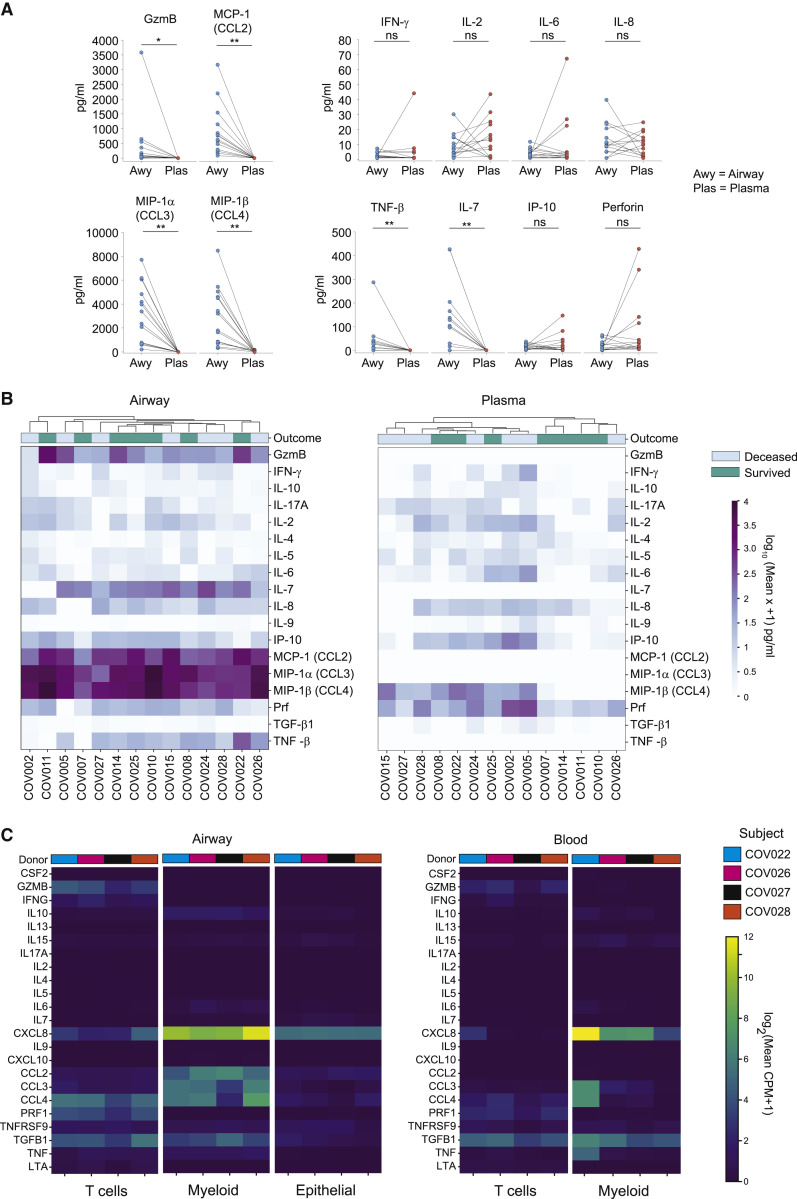
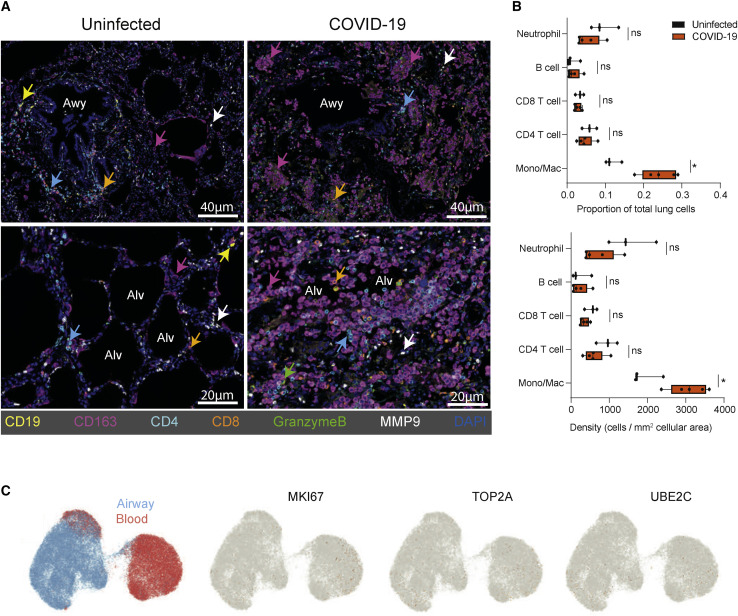
Immune response dynamics in coronavirus disease 2019 (COVID-19) and their severe manifestations have largely been studied in circulation. Here, we examined the relationship between immune processes in the respiratory tract and circulation through longitudinal phenotypic, transcriptomic, and cytokine profiling of paired airway and blood samples from patients with severe COVID-19 relative to heathy controls. In COVID-19 airways, T cells exhibited activated, tissue-resident, and protective profiles; higher T cell frequencies correlated with survival and younger age. Myeloid cells in COVID-19 airways featured hyperinflammatory signatures, and higher frequencies of these cells correlated with mortality and older age. In COVID-19 blood, aberrant CD163+ monocytes predominated over conventional monocytes, and were found in corresponding airway samples and in damaged alveoli. High levels of myeloid chemoattractants in airways suggest recruitment of these cells through a CCL2-CCR2 chemokine axis. Our findings provide insights into immune processes driving COVID-19 lung pathology with therapeutic implications for targeting inflammation in the respiratory tract.

Keywords: ARDS; COVID-19; chemokines; coronavirus disease 2019; cytokines; lung immunity; macrophages; monocytes; single-cell RNA sequencing; tissue resident memory T cells.


Conflict of interest statement

Declaration of interests J.Z., M.S., and S.M. have competing interests with IsoPlexis. The remaining authors declare no competing interests.

Figures

None
Graphical abstract
Figure 1
Figure 1
Immune cell composition in airways and blood compartments of COVID-19 patients compared to healthy controls (A) Schematic diagram showing assays performed on COVID-19 patient airway and blood samples for this study. (B) Principal-component analysis (PCA) of all COVID-19 samples based on mean marker expression colored by site (left), condition (center), and subjects (right). (C) UMAP embedding of flow cytometry results from all airway and blood samples combined colored by major cell lineage (top panel), and separated by tissue site in COVID-19 and healthy donor samples (bottom 4 panels) (COVID-19 airway: n = 69, COVID-19 blood: n = 83, healthy airway: n = 5, healthy blood: n = 5). (D) Boxplots showing the frequency of major immune cell lineages of total CD45+CD66b cells in COVID-19 and healthy airway (left) and blood (right) samples. Each dot in the boxplot represents an individual patient sample. Statistical significance was calculated using 1-way ANOVA, followed by Tukey’s honestly significant difference (HSD) post-test indicated byp ≤ 0.05; ∗∗p ≤ 0.01; and ∗∗∗p ≤ 0.001. (E) Boxplots showing the frequency of each major cell lineage of total CD45+CD66b cells in airway (top) and blood (bottom) samples collected longitudinally for COVID-19 and healthy subjects. Color of boxes corresponds to lineage, and each dot is an individual patient sample.
Figure 2
Figure 2
Longitudinal assessments of immune cell composition and association with age and outcome (A) Correlation of immune cell frequencies in the airways (left) and blood (right) with age. Each dot represents the mean immune cell frequency for each patient from all time points, and color denotes patient outcome: survived (blue), deceased (red). Statistical significance was calculated by Spearman correlation (indicated by ρ), with p value shown in each graph. (B) Daily frequencies of immune cells in the airways (left) and blood (right) for each patient over time stratified by deceased and survived. Solid red and blue lines show mean cell lineage frequency for deceased and survived patients, respectively. Area under the curve (AUC) normalized for number of sampling days was calculated for each patient, and mean AUC is shown in each graph. Statistical significance was calculated by 1-tailed Mann-Whitney U tests (see Method details) for the AUC with Benjamini-Hochberg correction for multiple comparisons and is denoted by p ≤ 0.05. (C) k-means trajectory clustering analysis of clinical and immune cell frequencies with outcome. Left: representative trajectories of P:F ratio, SOFA score, airway myeloid cells, and airway CD4+ T cells for all patients used for k-means clustering and classification. The true outcome of each patient is denoted by red (deceased) or blue (survived) lines, and inferred clustering by k-means is denoted by solid (deceased) or dashed (survived) lines. Correct clustering denoted by red solid lines and blue dashed lines. Right: patient outcome classification performance of longitudinal k-means clustering for different combinations of immune cell trajectories and clinical parameters (SOFA score and P:F ratio). The percentage of patient outcomes successfully classified as deceased or survived is shown for each parameter measured in airways (gray) or blood (black). Dotted red line indicates classification performance by the P:F ratio and SOFA score.
Figure 3
Figure 3
Airway T cells in COVID-19 are dominated by TRM and activated phenotypes (A) Heatmap displaying expression of markers within PhenoGraph-generated, hierarchical T cell clusters. A total of 24 PhenoGraph clusters were collapsed into 13 definable T cell subsets indicated along the top. Heatmap data are colored by row normalized value for each marker. (B) UMAP embeddings of T cell subsets (as defined in A) in the blood and airways of COVID-19 patients and healthy controls (first and third rows). Pie charts indicating relative proportions of defined T cell subsets in airways and blood of COVID-19 patients and healthy controls (second and fourth rows). (C) T cell subset frequencies in airway and blood samples from COVID-19 patients (n = 13) and healthy controls (n = 5). Boxplots show the frequency of the indicated T cell subset for each patient (average of all time points per patient) or healthy controls. Statistical significance was calculated using a 1-way ANOVA with Tukey’s test for multiple comparisons and indicated by p ≤ 0.05; ∗∗p ≤ 0.01; and ∗∗∗p ≤ 0.001. (D) Expression of T cell activation markers HLA-DR and PD-1 on T cells (total CD3+ cells) from blood and airways of COVID-19 patients and healthy controls. Left: contour plots showing mean expression on HLA-DR and PD-1 on T cells from each cohort, with airway contours colored in blue and blood colored in red. Right: frequency of T cells expressing HLA-DR and PD-1 in the airways and blood for each COVID-19 patient (n = 13; averaged over all time points) or healthy controls (n = 5). Statistical significance was calculated using a 1-way ANOVA with Tukey’s test for multiple comparisons and indicated by ∗∗∗p ≤ 0.001.
Figure 4
Figure 4
Dysregulated myeloid cell subsets in the blood and airways of COVID-19 patients (A) Heatmap displaying expression of markers within PhenoGraph-generated, hierarchical myeloid cell clusters. A total of 21 PhenoGraph clusters were collapsed into 9 definable subsets indicated above the heatmap. Heatmap data are colored by value normalized to that of T cell expression as an internal negative control for each sample. (B) UMAP embedding of 9 myeloid cell subsets in the airways (left) and blood (right) of COVID-19 (top) and healthy controls (bottom), with colors denoting the specific subset as defined in (A) (first and third rows). Pie charts indicating relative proportions of defined myeloid cell subsets in the airways and blood of COVID-19 patients and healthy controls (second and fourth rows). (C) Boxplots showing compiled frequency of each myeloid subset displayed as an average of all time points collected for COVID-19 samples (CA, COVID-19 airway; CB, COVID-19 blood; HA, healthy airway; HB, healthy blood). (D–F) Expression of myeloid markers in airways and blood shown as contour plots of expression of indicated markers by myeloid cells in airway (blue contours) and blood (red contours) samples by condition (healthy or COVID-19). Boxplots (to the right or below the contour plots) indicate the percentage of cells within each condition and site that were positive for specific markers. Statistical significance was calculated using a 1-way ANOVA followed by a Tukey HSD and indicated by p ≤ 0.05; ∗∗p ≤ 0.01; and ∗∗∗p ≤ 0.001.
Figure 5
Figure 5
Inflammatory gene signatures of T cells and myeloid cells are enriched in the airways of COVID-19 patients T cells, monocytes, and macrophages from the blood and airways of COVID-19 patients were analyzed by scRNA-seq (see Method details). (A) Separate UMAP embeddings showing gene expression from total T cells obtained from airways and blood of paired samples from 4 patients. UMAP embeddings show sample site origin, subject, and indicated gene expression (based on log2(CPM+1)). (B) Heatmap showing major differentially expressed genes in airway compared to blood T cells from each individual patient and time point. Data are colored by row Z scored log2(CPM+1) for each sample. (C) UMAP embeddings of total monocytes and macrophages obtained from airways and blood from 4 COVID-19 patients. UMAP embeddings show sample site origin, patient, and selected gene expression displayed as log2(CPM+1)/maximum. (D) Heatmap of subset-defining genes, homing receptors, and key inflammatory molecules for monocytes and macrophages in airways and blood from each patient sample. The heatmap shows genes that are not differentially expressed between airways and blood (CD14-FCGR3A) and genes are consistently differentially expressed (ITGAV-TREM2).
Figure 6
Figure 6
COVID-19 airways contain highly elevated levels of myeloid and T cell-derived cytokines (A) Pairwise comparison of cytokine levels averaged across both time points in airway wash and blood plasma samples collected from 15 patients. Significance indicated as p ≤ 0.05; ∗∗p ≤ 0.01; ∗∗∗p ≤ 0.001. (B) Heatmap showing log10(mean X+1) pg/mL cytokine levels averaged across both time points in airway (left) and blood plasma (right) samples for each patient. (C) Transcript levels for cytokine expression by major cell lineages identified by scRNA-seq for each patient samples indicated by color. Heatmap shows log2(mean CPM+1) gene expression.
Figure 7
Figure 7
COVID-19 lung autopsies exhibit specific and extensive accumulation of monocyte and macrophages relative to control lungs (A) Lung sections obtained from non-diseased organ donors and autopsy specimens from COVID-19 patients with diffuse alveolar damage were stained with indicated antibodies and analyzed using Vectra. Representative images show staining for CD19 (B cell), CD4 or CD8 (T cells), CD163 (monocytes and macrophages), MMP9 (neutrophil), and granzyme B (cytotoxicity) in the lungs of uninfected controls (left) and COVID-19 patients (right). (B) Quantitation of immune cell subsets in (A) for uninfected organ donor lungs (n = 3) and COVID-19 lungs (n = 5) as a frequency of total lung cells (top) or density (bottom; cells per mm2 cellular area) using InForm software. Statistical significance calculated by paired t test and indicated by p ≤ 0.05. (C) UMAP embedding showing expression of genes associated with proliferation by scRNA-seq in monocyte and macrophages derived from airways and blood, as in Figure 5.

Update of

Comment in

References

    1. Aggarwal N.R., King L.S., D’Alessio F.R. Diverse macrophage populations mediate acute lung inflammation and resolution. Am. J. Physiol. Lung Cell. Mol. Physiol. 2014;306:L709–L725. - PMC - PubMed
    1. Bharat A., Bhorade S.M., Morales-Nebreda L., McQuattie-Pimentel A.C., Soberanes S., Ridge K., DeCamp M.M., Mestan K.K., Perlman H., Budinger G.R., Misharin A.V. Flow Cytometry Reveals Similarities Between Lung Macrophages in Humans and Mice. Am. J. Respir. Cell Mol. Biol. 2016;54:147–149. - PMC - PubMed
    1. Bray N.L., Pimentel H., Melsted P., Pachter L. Near-optimal probabilistic RNA-seq quantification. Nat. Biotechnol. 2016;34:525–527. - PubMed
    1. Carpenter D.J., Granot T., Matsuoka N., Senda T., Kumar B.V., Thome J.J.C., Gordon C.L., Miron M., Weiner J., Connors T., et al. Human immunology studies using organ donors: impact of clinical variations on immune parameters in tissues and circulation. Am. J. Transplant. 2018;18:74–88. - PMC - PubMed
    1. Choi Y.S., Gullicksrud J.A., Xing S., Zeng Z., Shan Q., Li F., Love P.E., Peng W., Xue H.H., Crotty S. LEF-1 and TCF-1 orchestrate T(FH) differentiation by regulating differentiation circuits upstream of the transcriptional repressor Bcl6. Nat. Immunol. 2015;16:980–990. - PMC - PubMed

Publication types

MeSH terms