. 2021 Apr 15;184(8):2151-2166.e16.
doi: 10.1016/j.cell.2021.03.002. Epub 2021 Mar 24.

Nonpeptidergic neurons suppress mast cells via glutamate to maintain skin homeostasis

Affiliations

Nonpeptidergic neurons suppress mast cells via glutamate to maintain skin homeostasis

Shiqun Zhang et al. Cell. .

Abstract

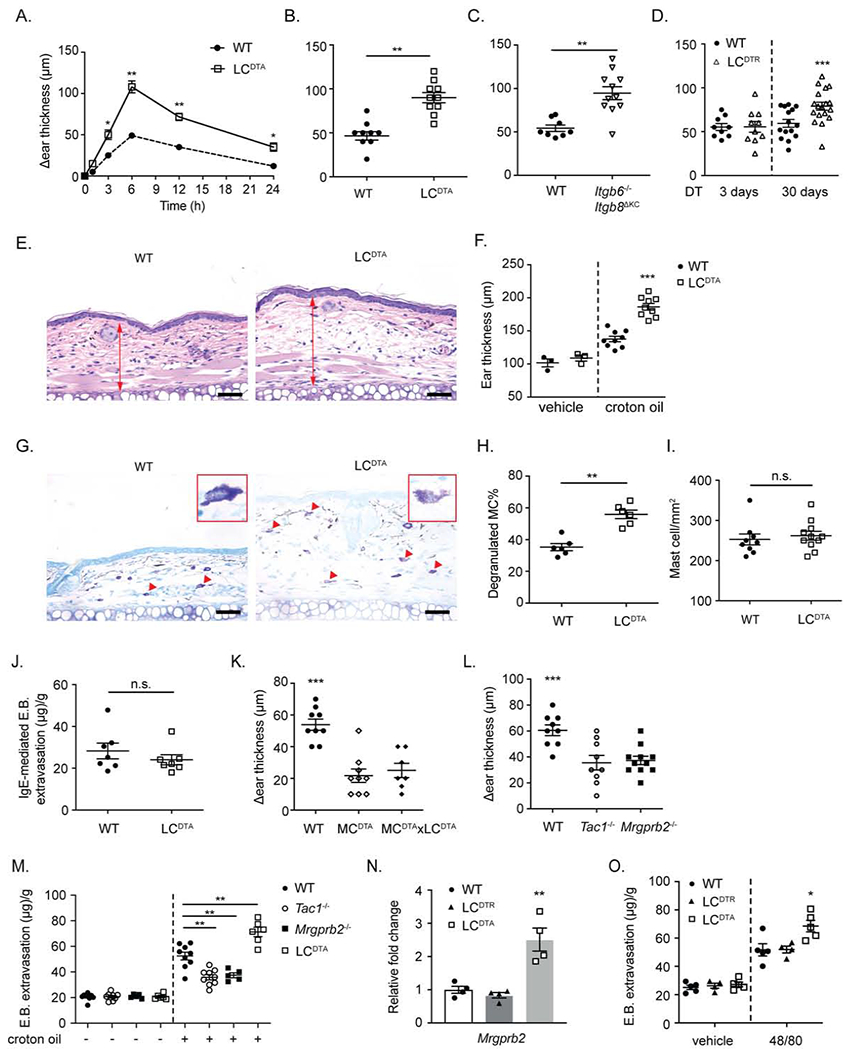
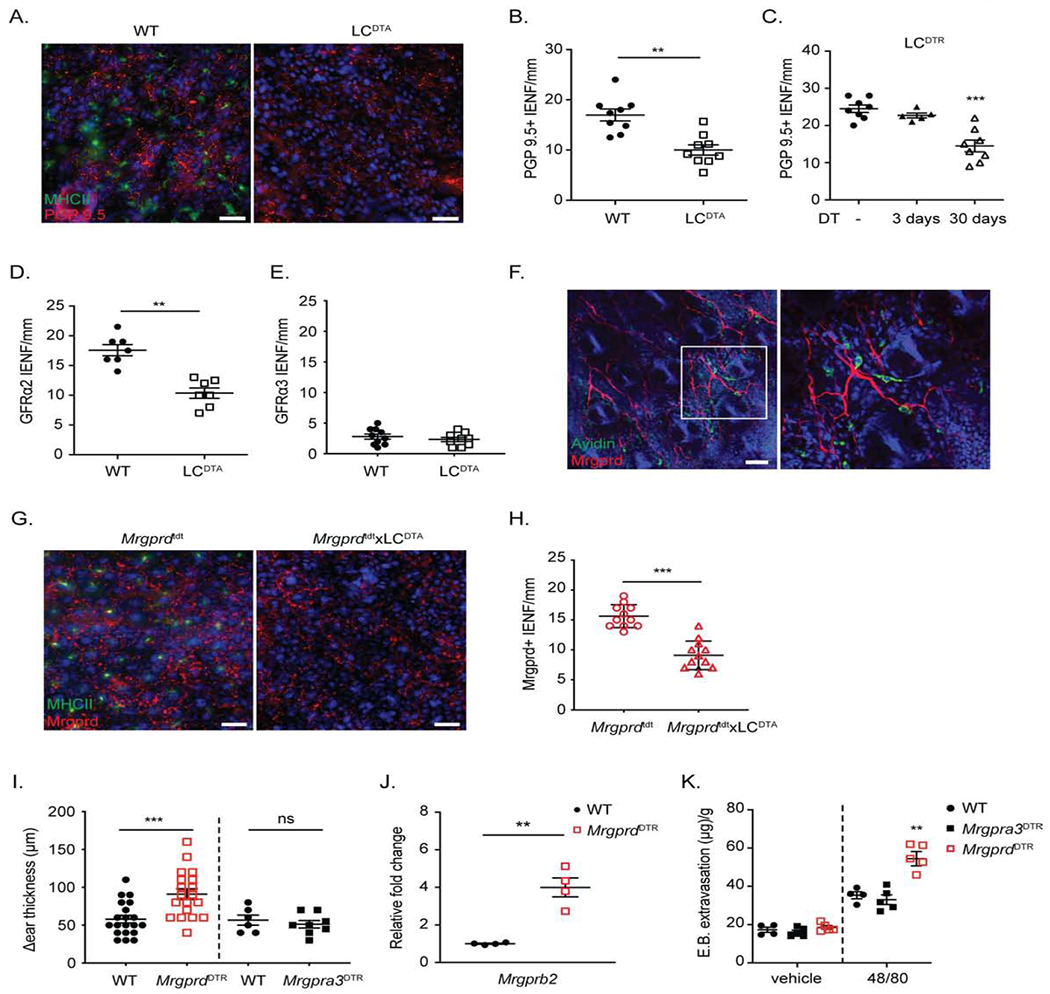
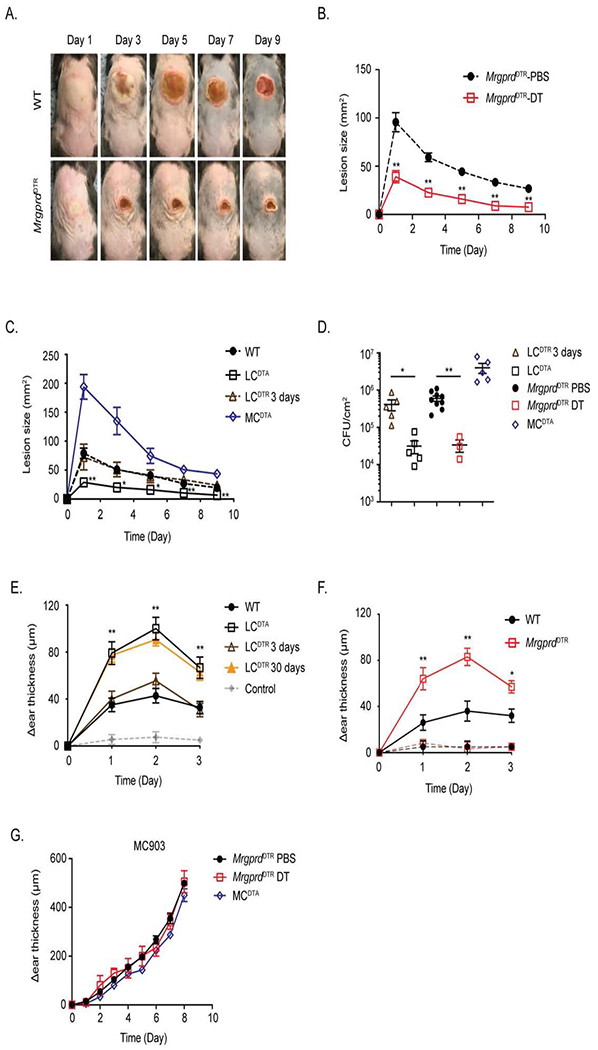
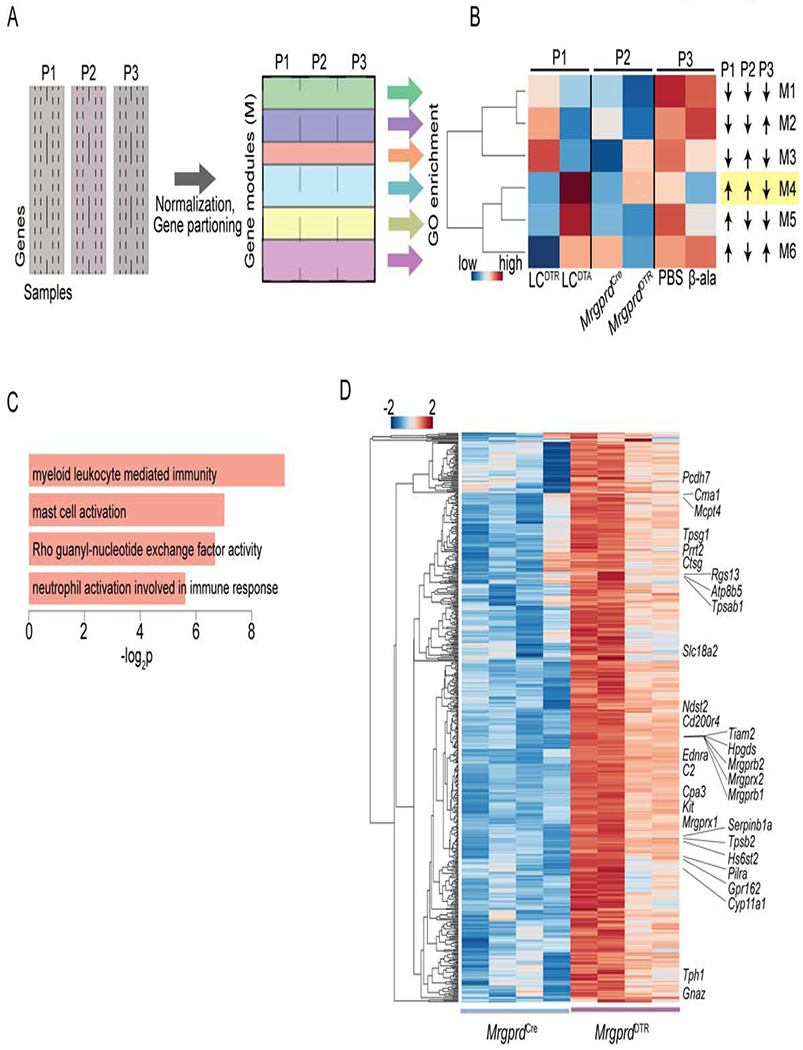
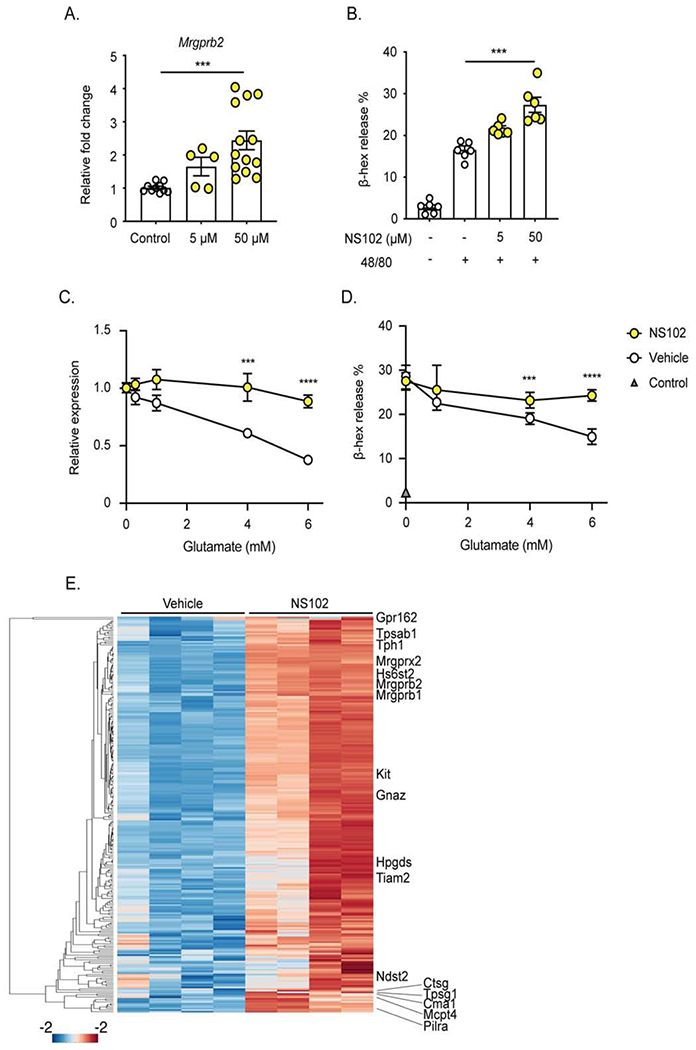
Cutaneous mast cells mediate numerous skin inflammatory processes and have anatomical and functional associations with sensory afferent neurons. We reveal that epidermal nerve endings from a subset of sensory nonpeptidergic neurons expressing MrgprD are reduced by the absence of Langerhans cells. Loss of epidermal innervation or ablation of MrgprD-expressing neurons increased expression of a mast cell gene module, including the activating receptor, Mrgprb2, resulting in increased mast cell degranulation and cutaneous inflammation in multiple disease models. Agonism of MrgprD-expressing neurons reduced expression of module genes and suppressed mast cell responses. MrgprD-expressing neurons released glutamate which was increased by MrgprD agonism. Inhibiting glutamate release or glutamate receptor binding yielded hyperresponsive mast cells with a genomic state similar to that in mice lacking MrgprD-expressing neurons. These data demonstrate that MrgprD-expressing neurons suppress mast cell hyperresponsiveness and skin inflammation via glutamate release, thereby revealing an unexpected neuroimmune mechanism maintaining cutaneous immune homeostasis.

Keywords: Langerhans cell; Mas-related G protein receptors; MrgprB2; MrgprD; S. aureus, beta-alanine; glutamate; kainate receptors; mast cell; neuroimmunology; nonpeptidergic neurons; skin.


Conflict of interest statement

Declaration of interests D.H.K. has a patent pending for the use of β-ala to suppress MC activation in disease states. The remaining authors declare no competing interests.

Figures

Figure 1.
Figure 1.. Long-term LC ablation increases mast cell Mrgprb2-mediated irritant dermatitis.
(A) The change in ear thickness over baseline between WT and LCDTA (constitutive LC ablation) at the indicated timepoint and (B) 6 hours after 1% croton oil application is shown. (C) As in B, except Itgb6−/− Itgb8μKC mice and littermate controls (WT) are shown. (D) Altered ear thickness over baseline for LCDTR or littermate controls (WT) treated with DT for 3 days (short-term LC ablation) or 30 days (long-term ablation) at 6 hours following 1% croton oil application is shown. (E) Representative H&E staining histological sections of ear skin from (B). (F) The distance from cartilage to epidermis as measured on H&E staining histological sections obtained from WT and LCDTA mice at 6 hours after 1% croton oil painting. (G) Representative toluidine blue staining of transverse ear sections from WT and LCDTA mice 6 hours after 1% croton oil application. Arrow indicated degranulated MC. One representative degranulated MC was highlighted in the inset. (H) The percentage of degranulated MC observed in (G) normalized to total MC number is shown. (I) Quantification of MC numbers in naive dorsal ear skins between WT and LCDTA mice based of avidin staining of transverse sections. (J) For passive cutaneous anaphylaxis, mouse ear skin was sensitized with anti-DNP IgE one day before the intravenous (i.v.) injection of DNP-HSA and Evans blue. Evans blue extravasation was measured 30 minutes after i.v. injection of DNP. (K, L) MCDTA mice (mast cell deficient), MCDTA x LCDTA mice, Tac1−/− mice (Substance P deficient), Mrgprb2−/− mice and littermate controls were challenged with 1% croton oil. Ear swelling was measured at 6 hours. (M) Quantification of Evans blue dye in flank skin of WT, Tac1−/−, Mrgprb2−/− or LCDTA mice after 30 mins epicutaneous application of croton oil. (N) Mrgprb2 mRNA expression as analyzed by RTqPCR from FACSorted dermal ear MC isolated from naive WT, LCDTA (long-term LC ablation) and LCDTR (short-term LC ablation) mice. (O) Quantification of Evans blue dye extravasation after i.d. administration of compound 48/80 to naive WT, LCDTA or LCDTR (short-term ablation) mice. Results are represented as mean ± SEM from 2-3 independent experiments. Each symbol in (A) represents mean in a group size of 4-5 animals. Each symbol in (B, C, D, F, H, I, J, K, L, M, N, O) represents data from an individual animal. Significance was calculated using unpaired Student’s t test (A, B, C, H, I, J, M) and one-way ANOVA (D, F, K, L, N, O). *p < 0.05, **p < 0.01, ***p < 0.001. Scale bars in E and G represent 50 μm.
Figure 2.
Figure 2.. Epidermal MrgprD-expressing nerve endings are reduced by long-term LC ablation.
(A) Representative immunofluorescent microscopic image of an epidermal whole-mount from WT and LCDTA mice ears stained for MHC-II to identify LC (green) and PGP 9.5 to identify neuron (red). (B) Quantification of intra-epidermal nerve fiber number (IENF) from transverse skin sections stained with PGP 9.5 from LCDTA and littermate (WT) controls. (C) As in B except IENF were quantified from LCDTR mice treated with PBS (−) or with DT for 3 days or 30 days. (D, E) Quantitative analysis of IENF from transverse section stained with GFRα2 (D) or GFRα3 (E) from WT and LCDTA mice. (F) Representative confocal image of MrgprdTdT skin whole mount to identify MC (green) and MrgprD-expressing neurons (red). (G) Representative epidermal whole-mounts from the ears of MrgprdTdT and MrgprdTdTxLCDTA mice stained for MHC-II to identify LC (green) are shown. (H) Quantification of IENF of MrgprD+ nerve from transverse skin sections from MrgprdTdT and MrgprdTdT x LCDTA mice. (I) Ear thickness at 6 hours following application of 1% croton oil in MrgprdDTR or Mrgpra3DTR mice treated with control PBS or DT is shown. (J) Mrgprb2 mRNA expression in FACSorted dermal mast cells isolated from naive PBS or DT treated MrgprdDTR mice is shown. (K) Quantification of Evans blue dye 20 mins after challenged with vehicle or compound 48/80 in WT mice or DT treated Mrgpra3DTR, MrgprdDTR mice. Each symbol represents data from an individual animal. Results are represented as mean ± SEM from 2-3 individual experiments with cohorts of n=3-4. Significance was calculated using unpaired Student’s t test (B, D, E, H, I, J) and one-way ANOVA (C, K). **p < 0.01, ***p < 0.001; n.s, no significant difference. Scale bars represent 20 μm in A, G; and 50 μm in F.
Figure 3.
Figure 3.. Ablation of MrgprD-expressing neurons or LC augments S. aureus host defense and CHS.
(A) Representative images of skin lesions from PBS (WT) or DT treated MrgprdDTR mice on indicated day after i.d. inoculation with 107 S. aureus. (B) Skin lesion area calculated using ImageJ from PBS or DT-treated MrgprdDTR mice at the indicated time is shown. (C) As in B, skin lesion area is shown at the indicated time for WT, LCDTA, 3-day DT-treated LCDTR and MCDTA mice. (D) Quantification of CFU isolated from infected skin tissue at Day 10 after infection from mice in B and C. (E) WT, LCDTA, 3-day or 30-day DT-treated LCDTR and MCDTA mice were sensitized with 0.25% DNFB on shaved abdomens on day 0, followed 5 days later with a 0.2% DNFB challenge on the ear. The data shown represent the change in ear thickness at the indicated time with the thickness prior to challenge. The change in ear thickness of all mice sensitized with vehicle was merged into grey line. (F) As in E, comparing DNFB CHS responses sensitized with 0.25% DNFB (thick lines) or vehicle alone (thin lines) in PBS or DT-treated MrgprdDTR mice. (G) The ears of PBS or DT treated MrgprdDTR and MCDTA mice were daily challenged with MC903 and monitored for ear swelling. Results are represented as mean ± SEM from two independent experiments using cohorts of 4-7 mice each for B, C, E, F and G. Each symbol in D represents data from an individual animal. Significance was calculated using unpaired Student’s t test to compare with WT group. *p < 0.05, **p < 0.01.
Figure 4.
Figure 4.. MrgprD agonism suppresses MC activation.
(A) Representative images and (B) quantification of Evans blue extravasation 20 minutes after i.d. administration with vehicle or compound 48/80 to PBS or DT-treated MrgprdDTR mice. Mice were locally pre-treated for 2 days with either i.d. PBS or β-ala. (C) Mrgprb2 mRNA expression in flank skin of indicated mice treated with i.d. PBS or β-ala for 2 days as assessed by RTqPCR. (D) Skin lesion area following i.d. inoculation of 107 S. aureus in WT mice. Mice were pretreated at the site of inoculation with i.d. PBS or β-ala for 2 days prior to and daily injected after S. aureus infection. (E) CFU isolated from skin tissue in D on day 10 post infection. (F) WT and MrgprdDTR mice were i.d. injected on abdominal for 2 days with either PBS or β-ala. Mice were then sensitized at the same location with 0.25% DNFB followed 5 days later with a 0.2% DNFB challenge on the ear. The data shown represent the change in ear thickness at the indicated time with the thickness prior to challenge. Representative images (G) and erythema area of back skin (H) after i.d. injected of LL-37 mixed with PBS or β-ala for two days. White dashed circle represents the area of LL-37 injection. (B, C, E, H) Each symbol represents data from an individual animal. (D, F) Results are represented as mean ± SEM from 2-3 individual experiments with cohrts of n=4-7. Significance was calculated using unpaired Student’s t test. *p < 0.05, **p < 0.01, ***p < 0.001; n.s, no significant difference.
Figure 5.
Figure 5.. A MC gene module that is coherently modulated by LC ablation and perturbations of MrgprD-expressing neurons
(A) Schematic depicting generalizable computational approach that enables simultaneous querying of RNAseq datasets generated by multiple and diverse perturbations of an experimental system to uncover coherent and where possible reciprocally regulated patterns of gene expression. The approach is dependent on normalization of gene transcript values using z-scores within sample and across the samples constituting a given perturbation (P). The transformed data involving the various perturbations (P1 – Pn) is then combined and analyzed to partition clusters of genes (gene modules). GO enrichment analysis reveals gene modules and associated molecular pathways. (B) Application of the computational pipeline to the RNAseq datasets from mouse earskin samples obtained from the three indicated perturbations and their relevant controls. The approach delineated 6 coherent gene modules (M1-M6). The M4 module is highlighted as its expression dynamic fits various phenotypic expectations. (C) GO pathway enrichment analysis of M4 genes (n=3,172) displaying significant categories and their enrichment −log P values. (D) Heatmap comprising genes that are significantly upregulated (n=501, p = < 0.05) in purified MC upon deletion of MrgprD-expressing neurons. The entire set of genes is listed in Table S3. These genes are also contained within the M4 module. Fisher’s exact test was used to establish significance of overlap of these genes in module 4 when comparing with those up-regulated in skin mast cells of MrgprdDTR mice (odds ratio of 1.27, p-value of 9.4E-6).
Figure 6.
Figure 6.. MrgprD-expressing neurons suppress mast cells responsiveness via glutamate release.
(A) Slc17a6 (vGlut2) mRNA expression in L1-5 dorsal root ganglion (DRG) cells of WT, LCDTA, or DT treated MrgprdDTR mice analyzed by RTqPCR. (B) Slc17a6 (vGlut2) mRNA expression in cultured DRGs isolated from naïve PBS or DT treated MrgprdDTR mice incubated with vehicle or 2 mM β-ala for 24 h. (C) Glutamate release from WT cultured DRGs stimulated with 100 μM Allyl isothiocyanate (AITC) for 10 mins, or (D) pre-incubated with vehicle or 2 mM β-ala for 24 hours prior to AITC stimulation. (E) Glutamate release from AITC stimulated cultured DRGs from naive WT and LCDTA mice. (F) Mrgprb2 mRNA expression in unmanipulated flank skin of WT and MrgprdΔvGlut2/+ mice as assessed by RTqPCR. (G) Quantification of Evans blue dye 20 mins after challenged with vehicle or compound 48/80 in WT and MrgprdΔvGlut2/+ mice. (H) Gene expression patterns of ionotropic NMDA-, AMPA-, kainate-receptors and metabotropic receptors on the indicated mast cell subsets. Raw data were obtained from Table S1, database of GSE37448 (dermal MC) and GSE109125 (peritoneal-derived MC) (Dwyer et al., 2016; Yoshida et al., 2019). (I) As in F, comparing Mrgprb2 mRNA expression in flank skin of indicated mice pretreated with daily i.d. 50 μM NS102, 50 mM β-ala or vehicle administration for 2 days. (J) As in G, quantification of Evans blue dye is shown for PBS or DT-treated MrgprdDTR mice pretreated with daily i.d. 50 μM NS102, 50 mM β-ala or vehicle administration for 2 days. Each symbol represents data from an individual animal. Results are represented as mean ± SEM from 2-3 independent experiments with cohorts of n=3-4. Significance was calculated using unpaired Student’s t test (C, D, E, F, G, I, J) and one-way ANOVA (A, B). *p < 0.05, **p < 0.01, ***p < 0.001; n.s, no significant difference.
Figure 7.
Figure 7.. Glutamate directly alters mast cell transcription and function.
(A) Mrgprb2 mRNA expression of peritoneal-derived mast cells (PCMC) incubated with indicated concentration (μM) of the GluR6 inhibitor NS102 for 48 hours. (B) β-hexosaminidase (β-hex) release of PCMC cultured for 48 hours in the indicated concentration of NS102 then stimulated by compound 48/80. (C, D) PCMC were transferred into glutamate-free Tyrode buffer and supplemented with the indicated concentration of glutamate and vehicle or 50 μM NS102. After 6 hours of culture, (C) Mrgprb2 mRNA expression and (D) β-hexosaminidase (β-hex) in response to compound 48/80 are shown. (E) Heatmap comprising genes that are significantly upregulated (n=245, p = < 0.05) in cultured PCMC upon inhibition of Glutamate receptor signaling with NS102. These genes are also contained within the group of 501 MC genes delineated in Figure. 5D. Fisher’s exact test was used to establish significance of the overlap of these genes when comparing with those up-regulated in Figure. 5D (odds ratio of 2.22, p-value of 1.89E-17). The entire set of genes is listed in Table S3. Each symbol represents data from an individual sample. Results are represented as mean ± SEM from 2-3 individual experiments. Each symbol in (C, D) represents mean in a group size of 4-7 samples. Significance was calculated using unpaired Student’s t test. ***p < 0.001.

Comment in

References

    1. Arifuzzaman M, Mobley YR, Choi HW, Bist P, Salinas CA, Brown ZD, Chen SL, Staats HF, and Abraham SN (2019). MRGPR-mediated activation of local mast cells clears cutaneous bacterial infection and protects against reinfection. Sci Adv 5, eaav0216. - PMC - PubMed
    1. Azimi E, Reddy VB, Shade KC, Anthony RM, Talbot S, Pereira PJS, and Lerner EA (2016). Dual action of neurokinin-1 antagonists on Mas-related GPCRs. JCI Insight 1, e89362. - PMC - PubMed
    1. Baral P, Udit S, and Chiu IM (2019). Pain and immunity: implications for host defence. Nat Rev Immunol 19, 433–447. - PMC - PubMed
    1. Bautzova T, Hockley JRF, Perez-Berezo T, Pujo J, Tranter MM, Desormeaux C, Barbaro MR, Basso L, Le Faouder P, Rolland C, et al. (2018). 5-oxoETE triggers nociception in constipation-predominant irritable bowel syndrome through MAS-related G protein-coupled receptor D. Sci Signal 11. - PMC - PubMed
    1. Beaudry H, Daou I, Ase AR, Ribeiro-da-Silva A, and Seguela P (2017). Distinct behavioral responses evoked by selective optogenetic stimulation of the major TRPV1+ and MrgD+ subsets of C-fibers. Pain 158, 2329–2339. - PubMed

Publication types

MeSH terms