. 2021 Apr 15;184(8):2033-2052.e21.
doi: 10.1016/j.cell.2021.02.048. Epub 2021 Mar 24.

Genetically engineered myeloid cells rebalance the core immune suppression program in metastasis

Affiliations

Genetically engineered myeloid cells rebalance the core immune suppression program in metastasis

Sabina Kaczanowska et al. Cell. .

Abstract

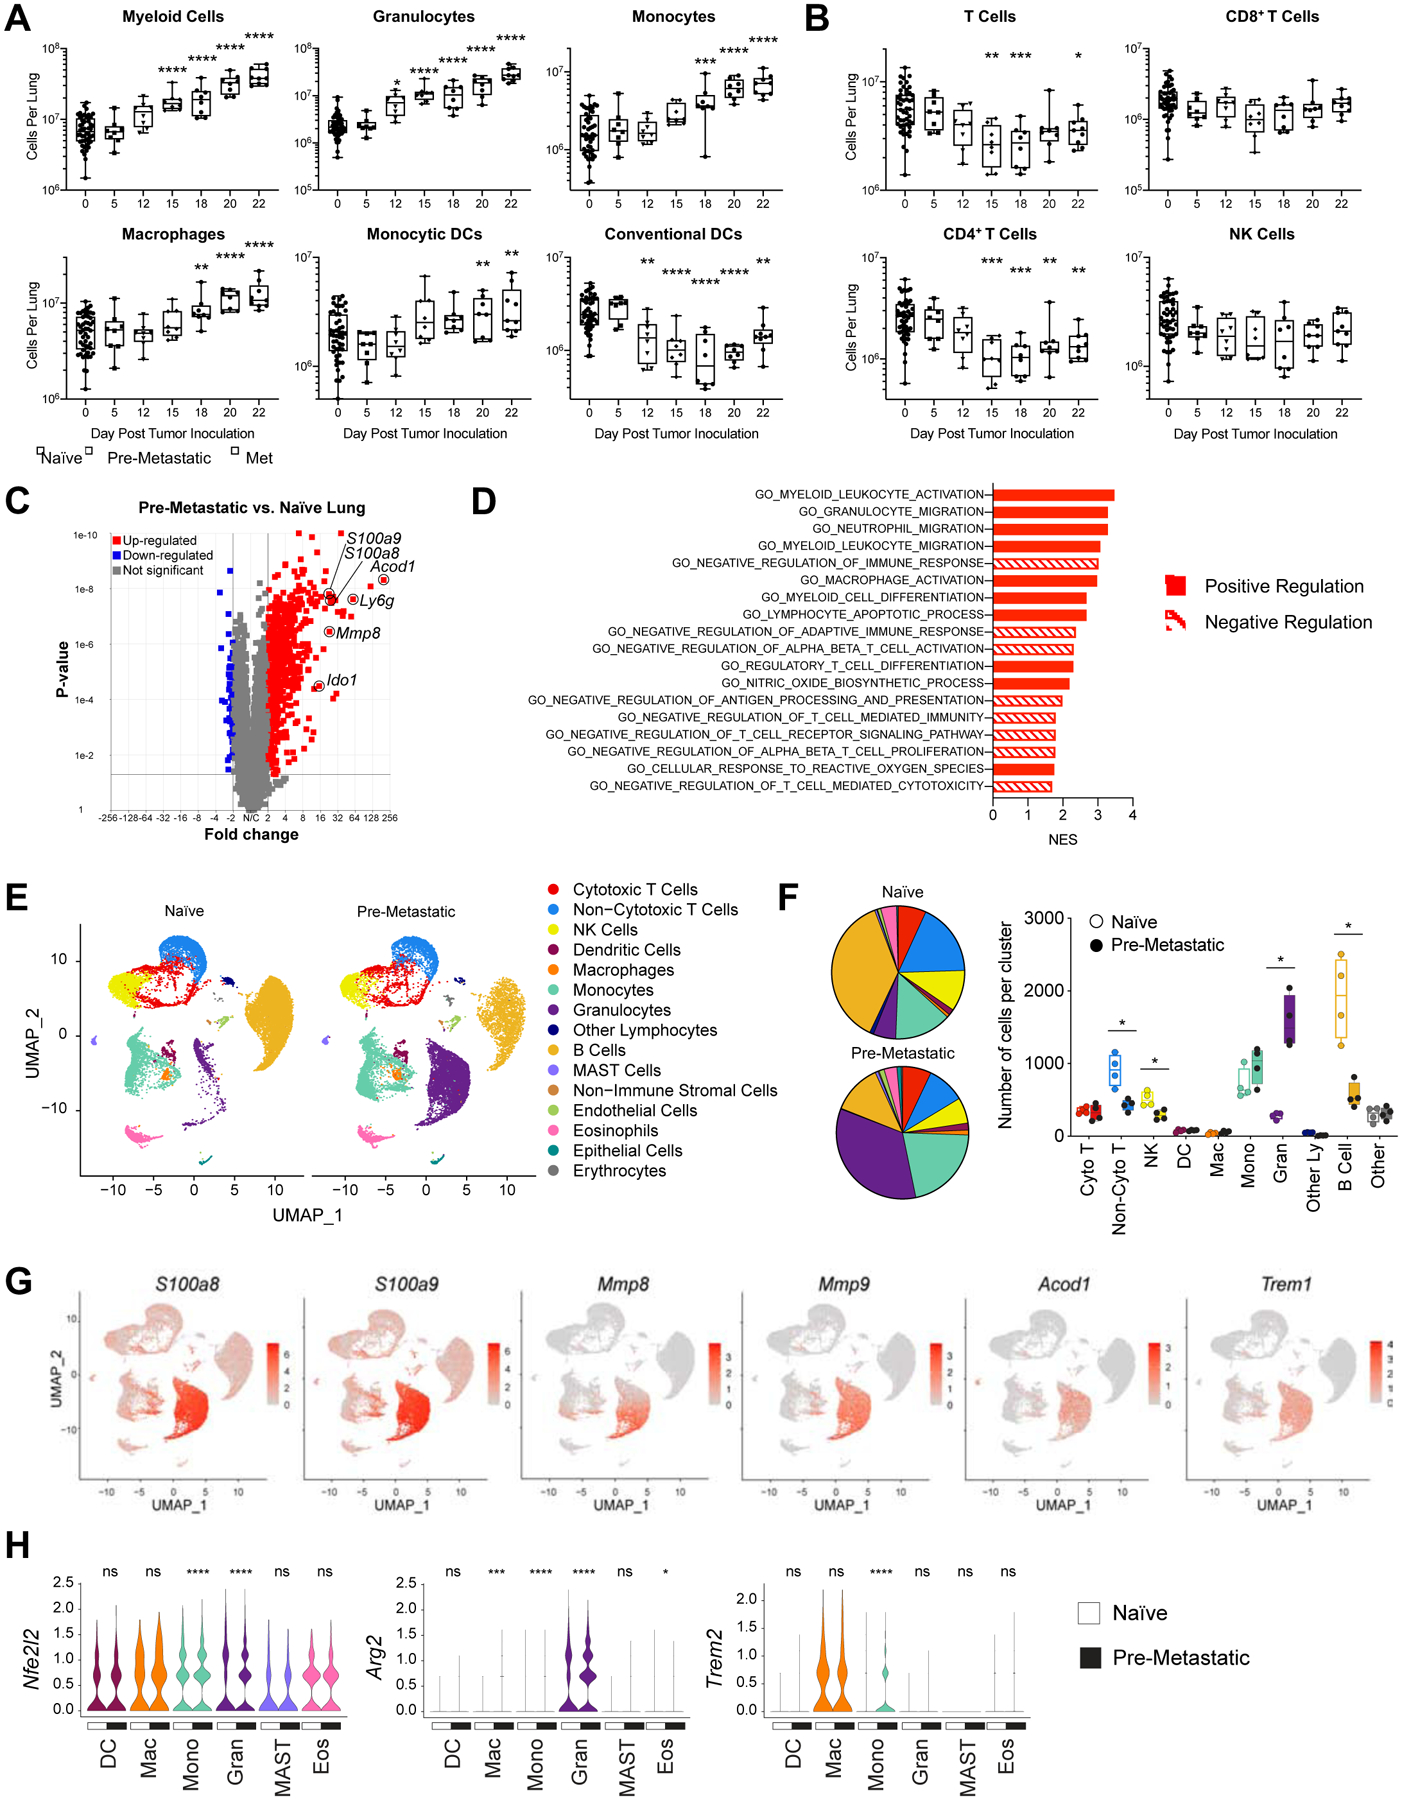
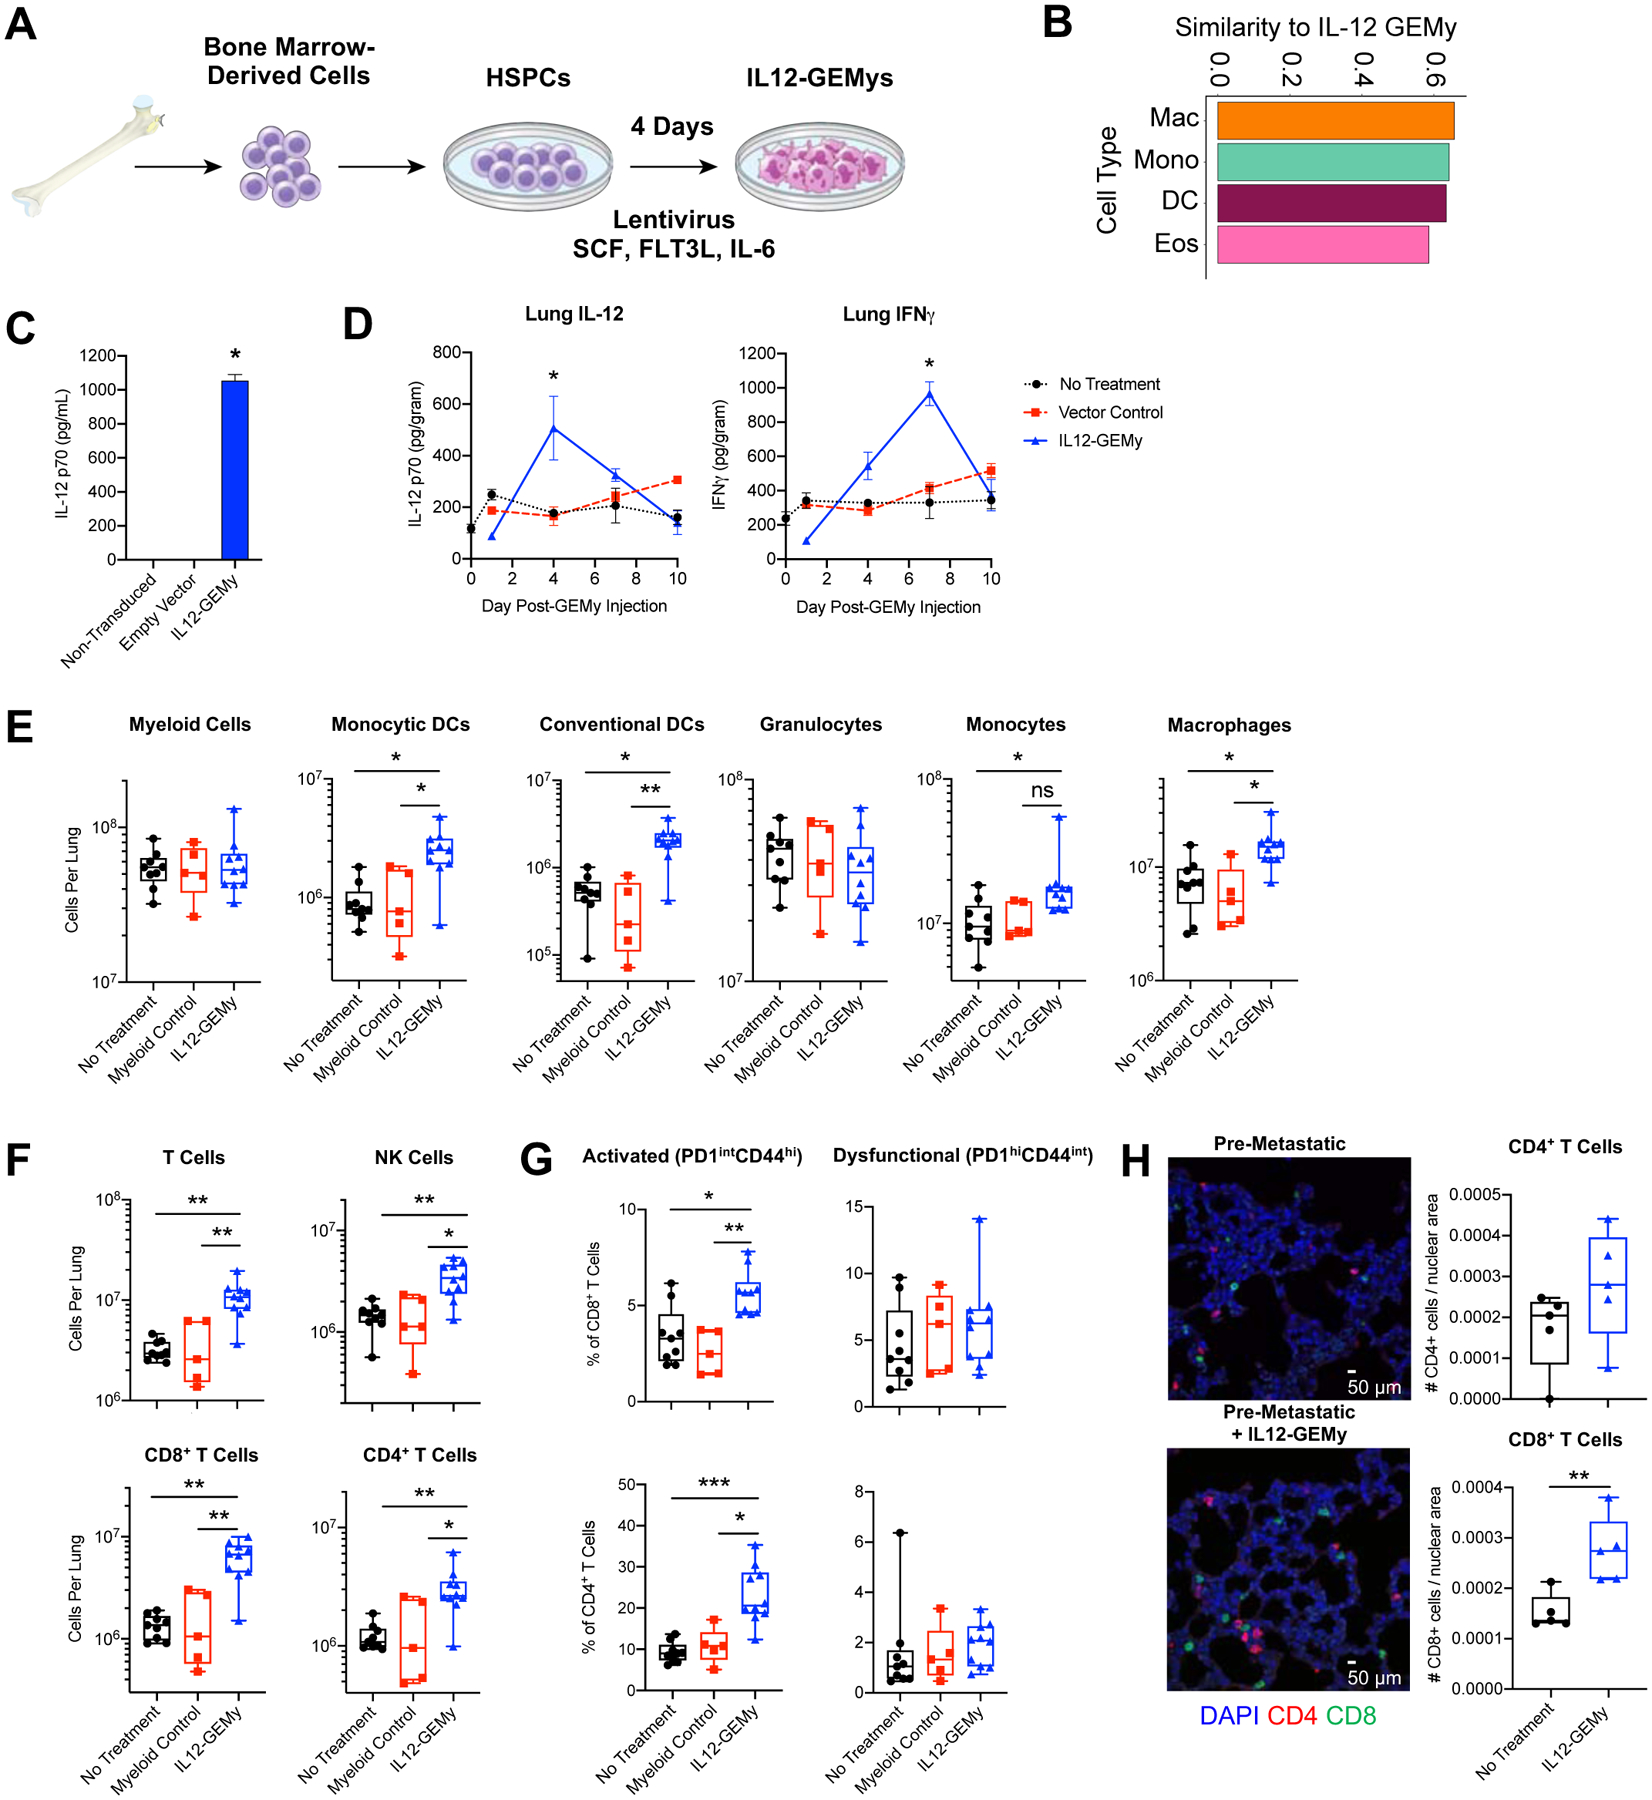
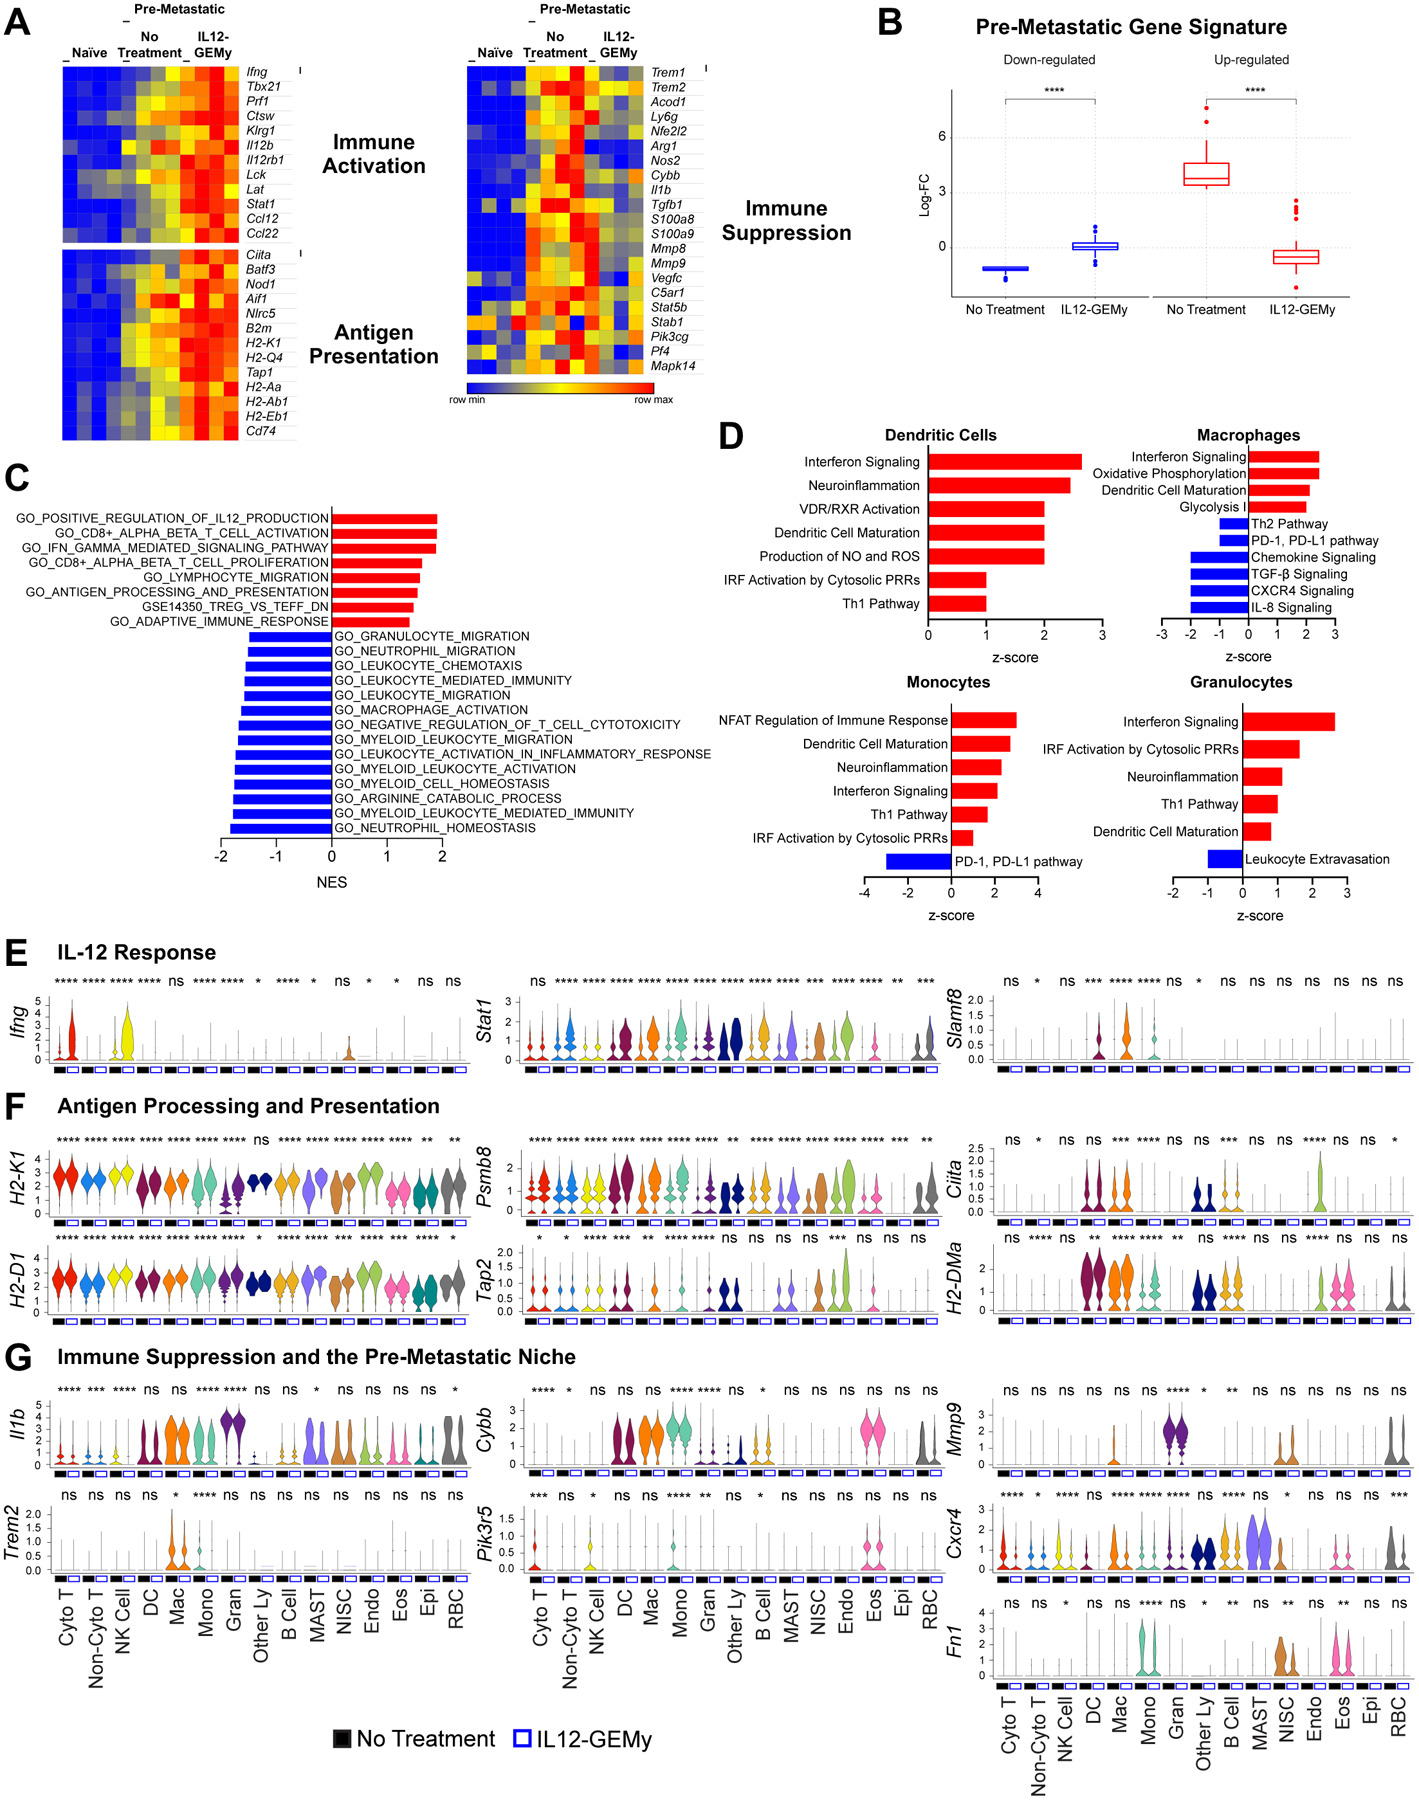
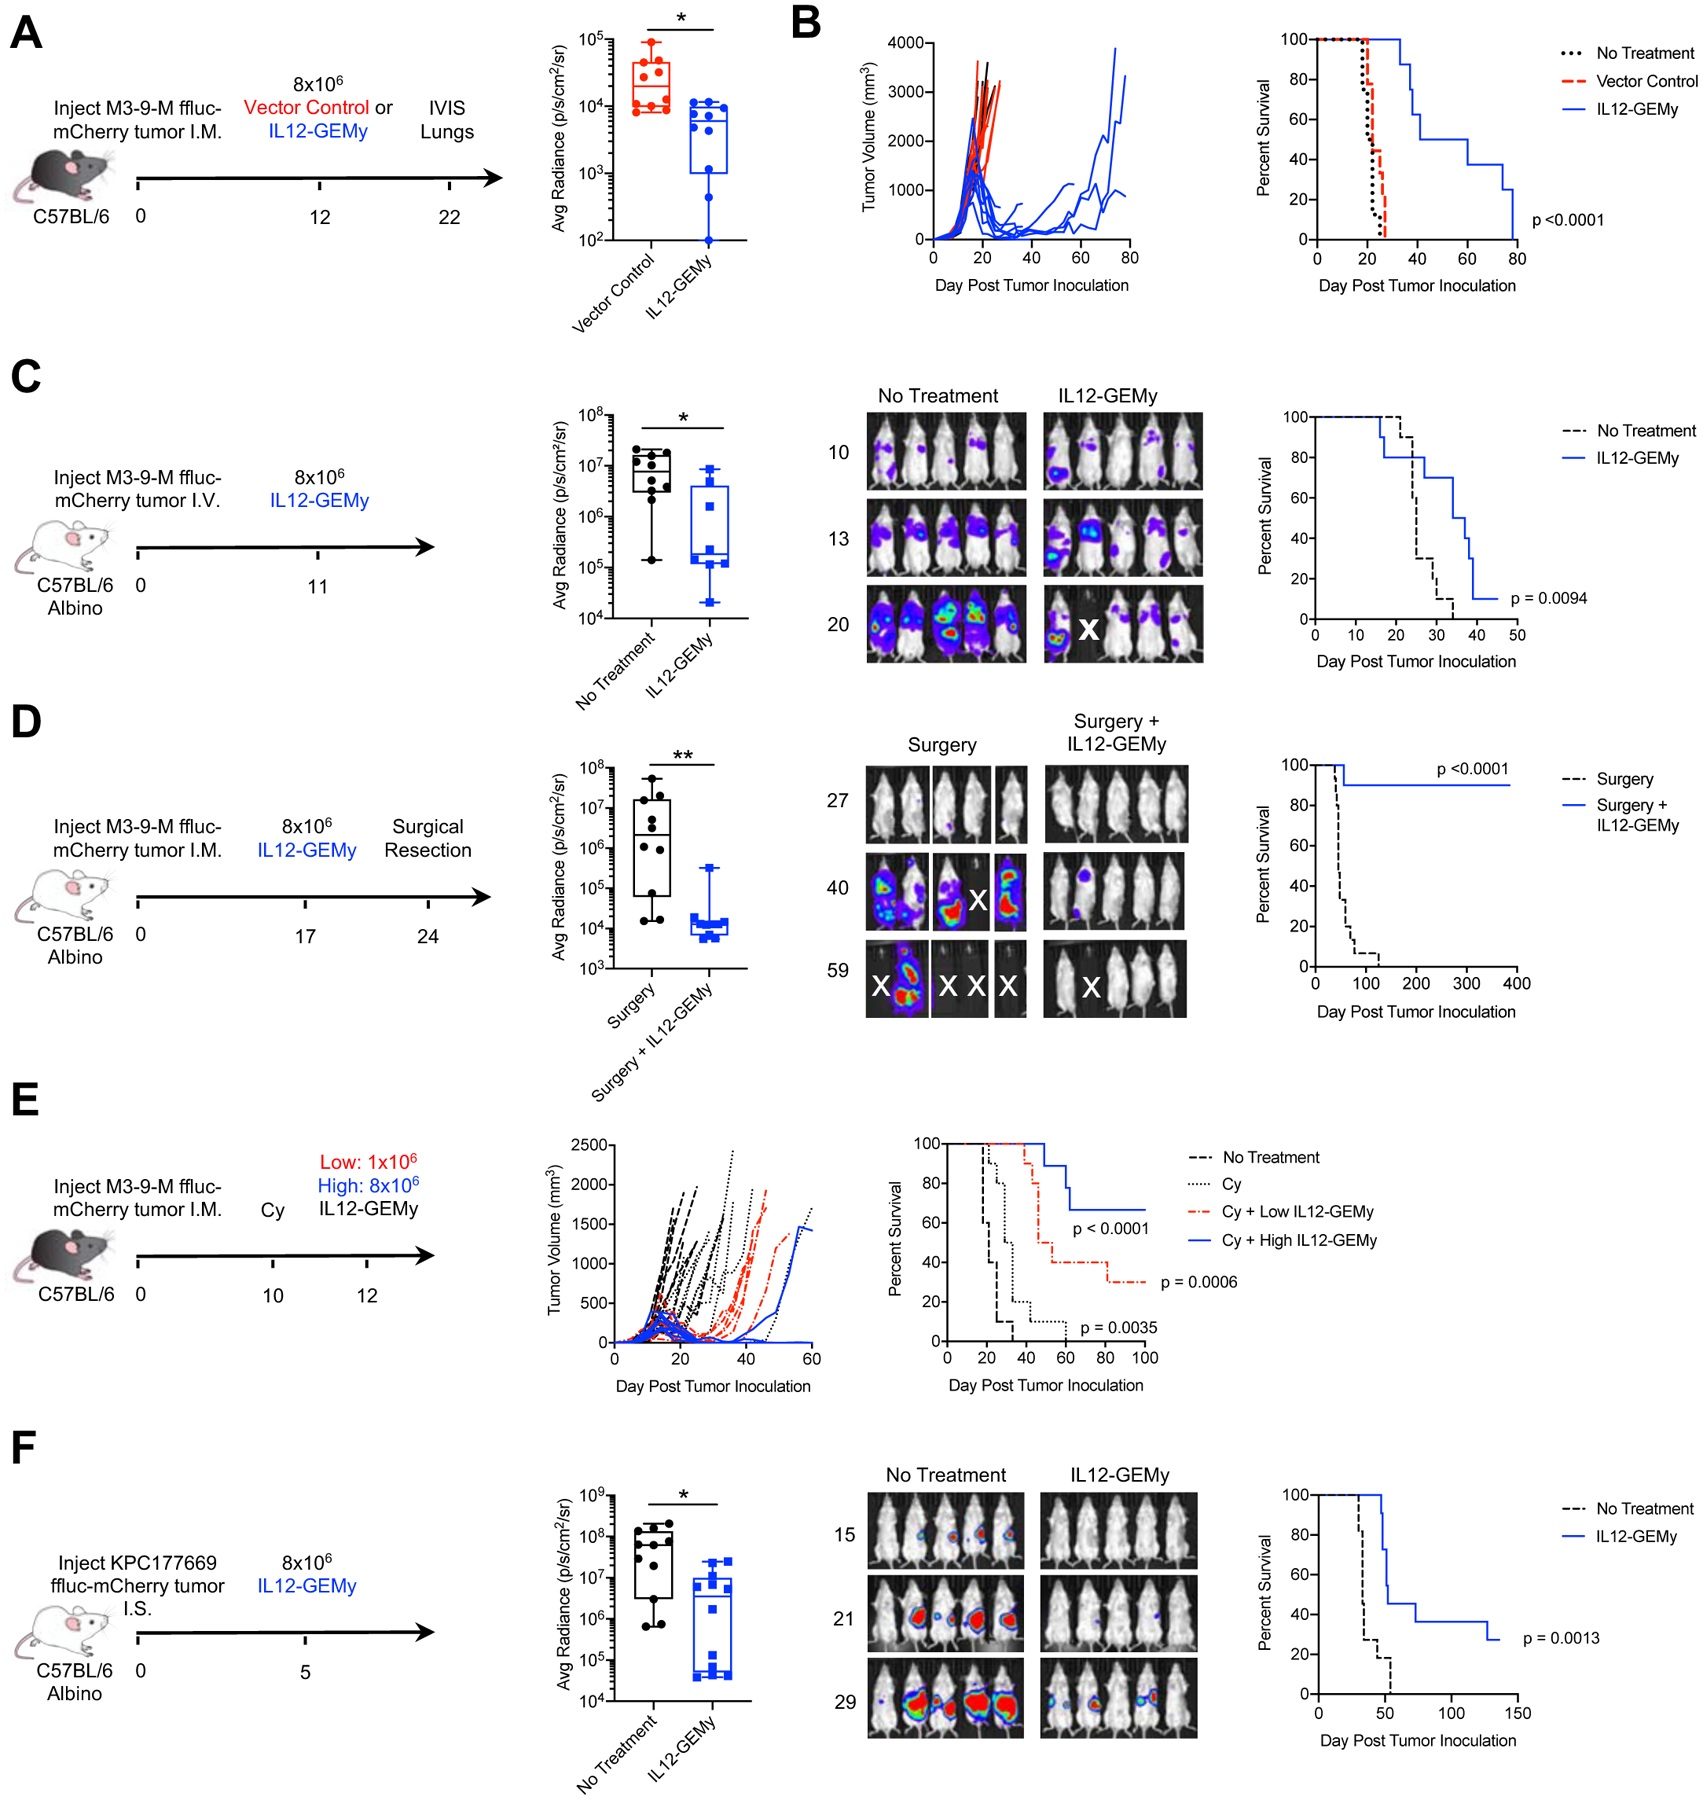
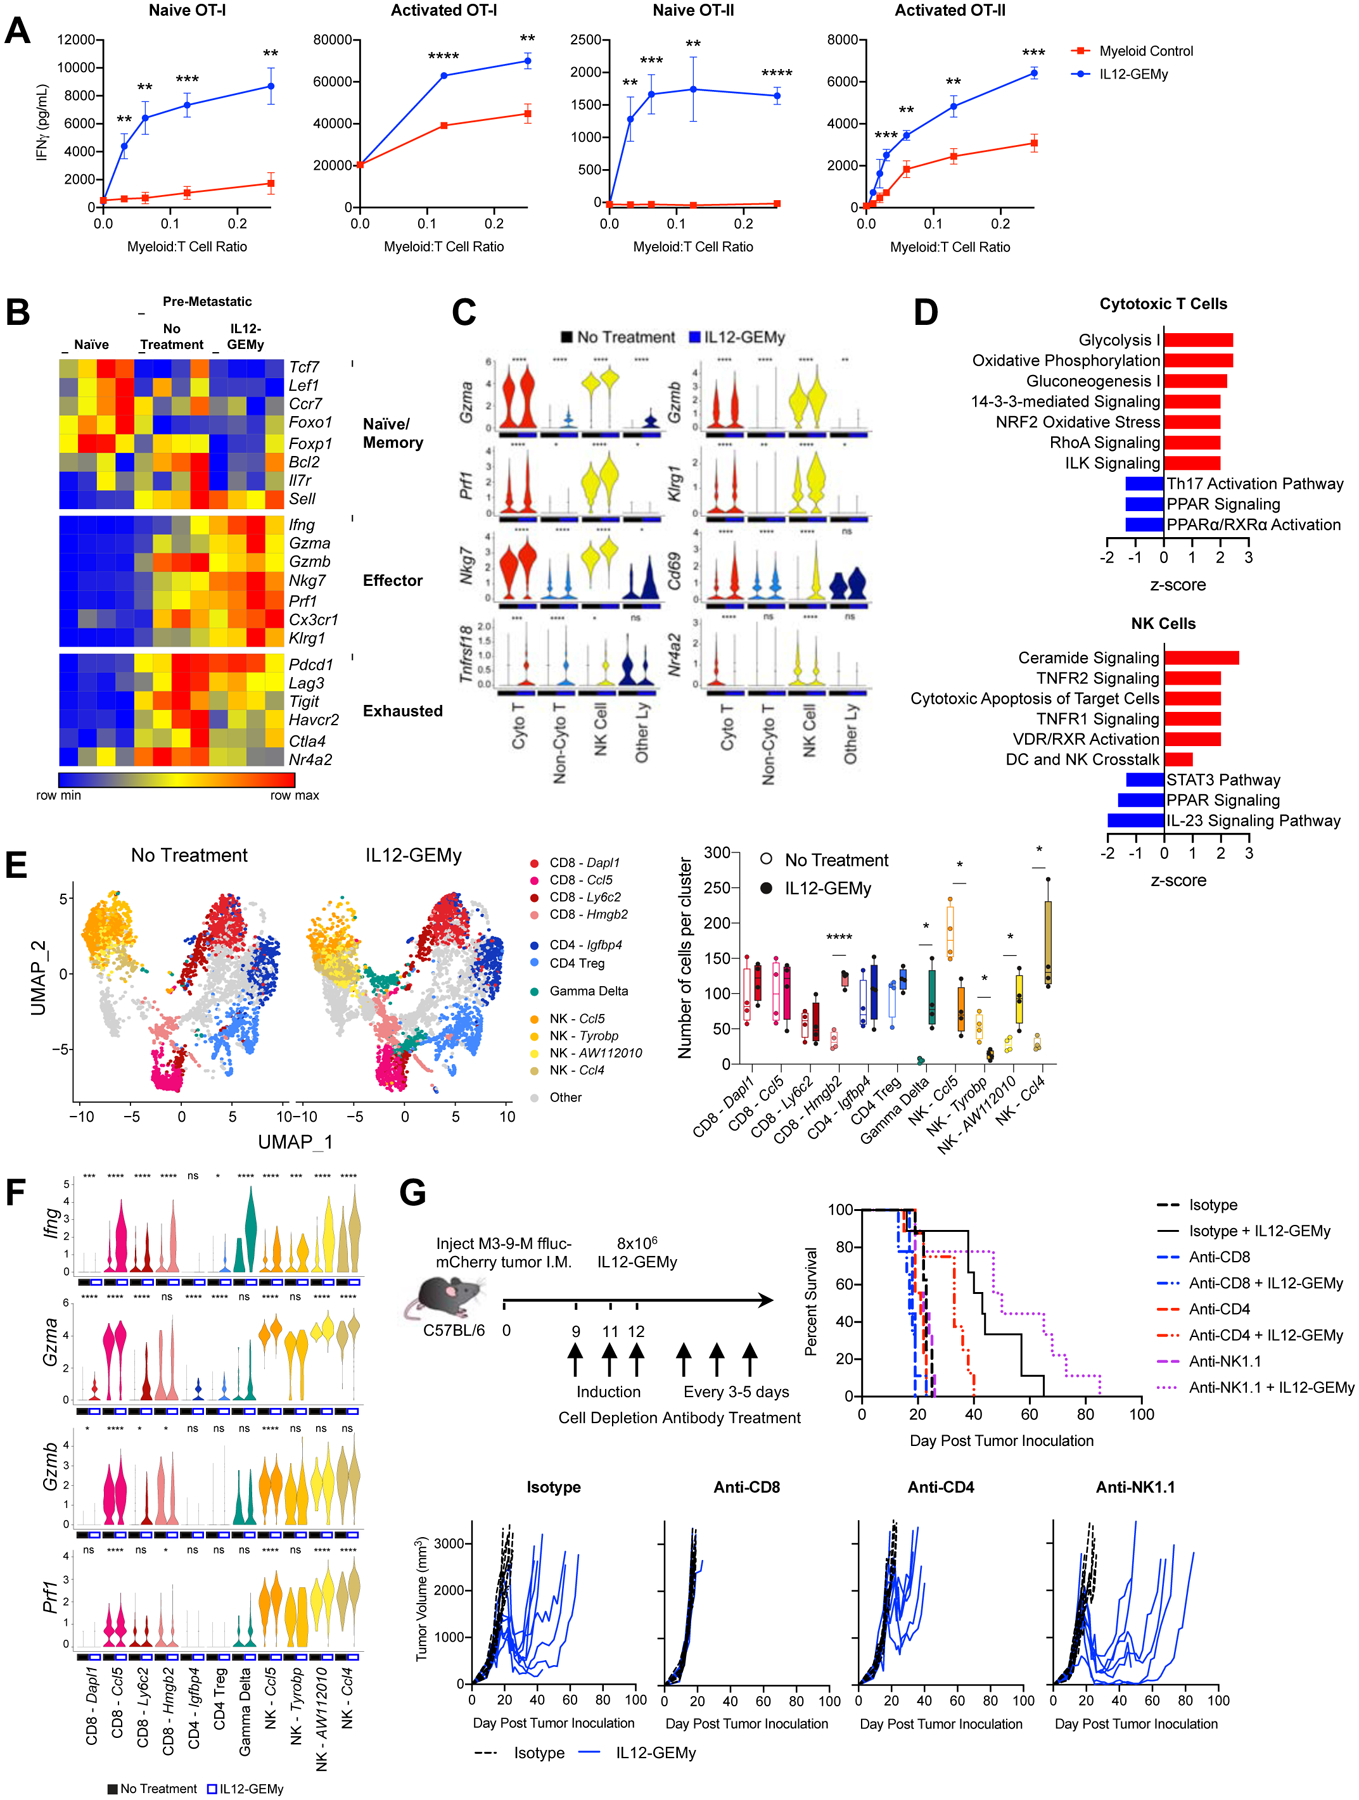
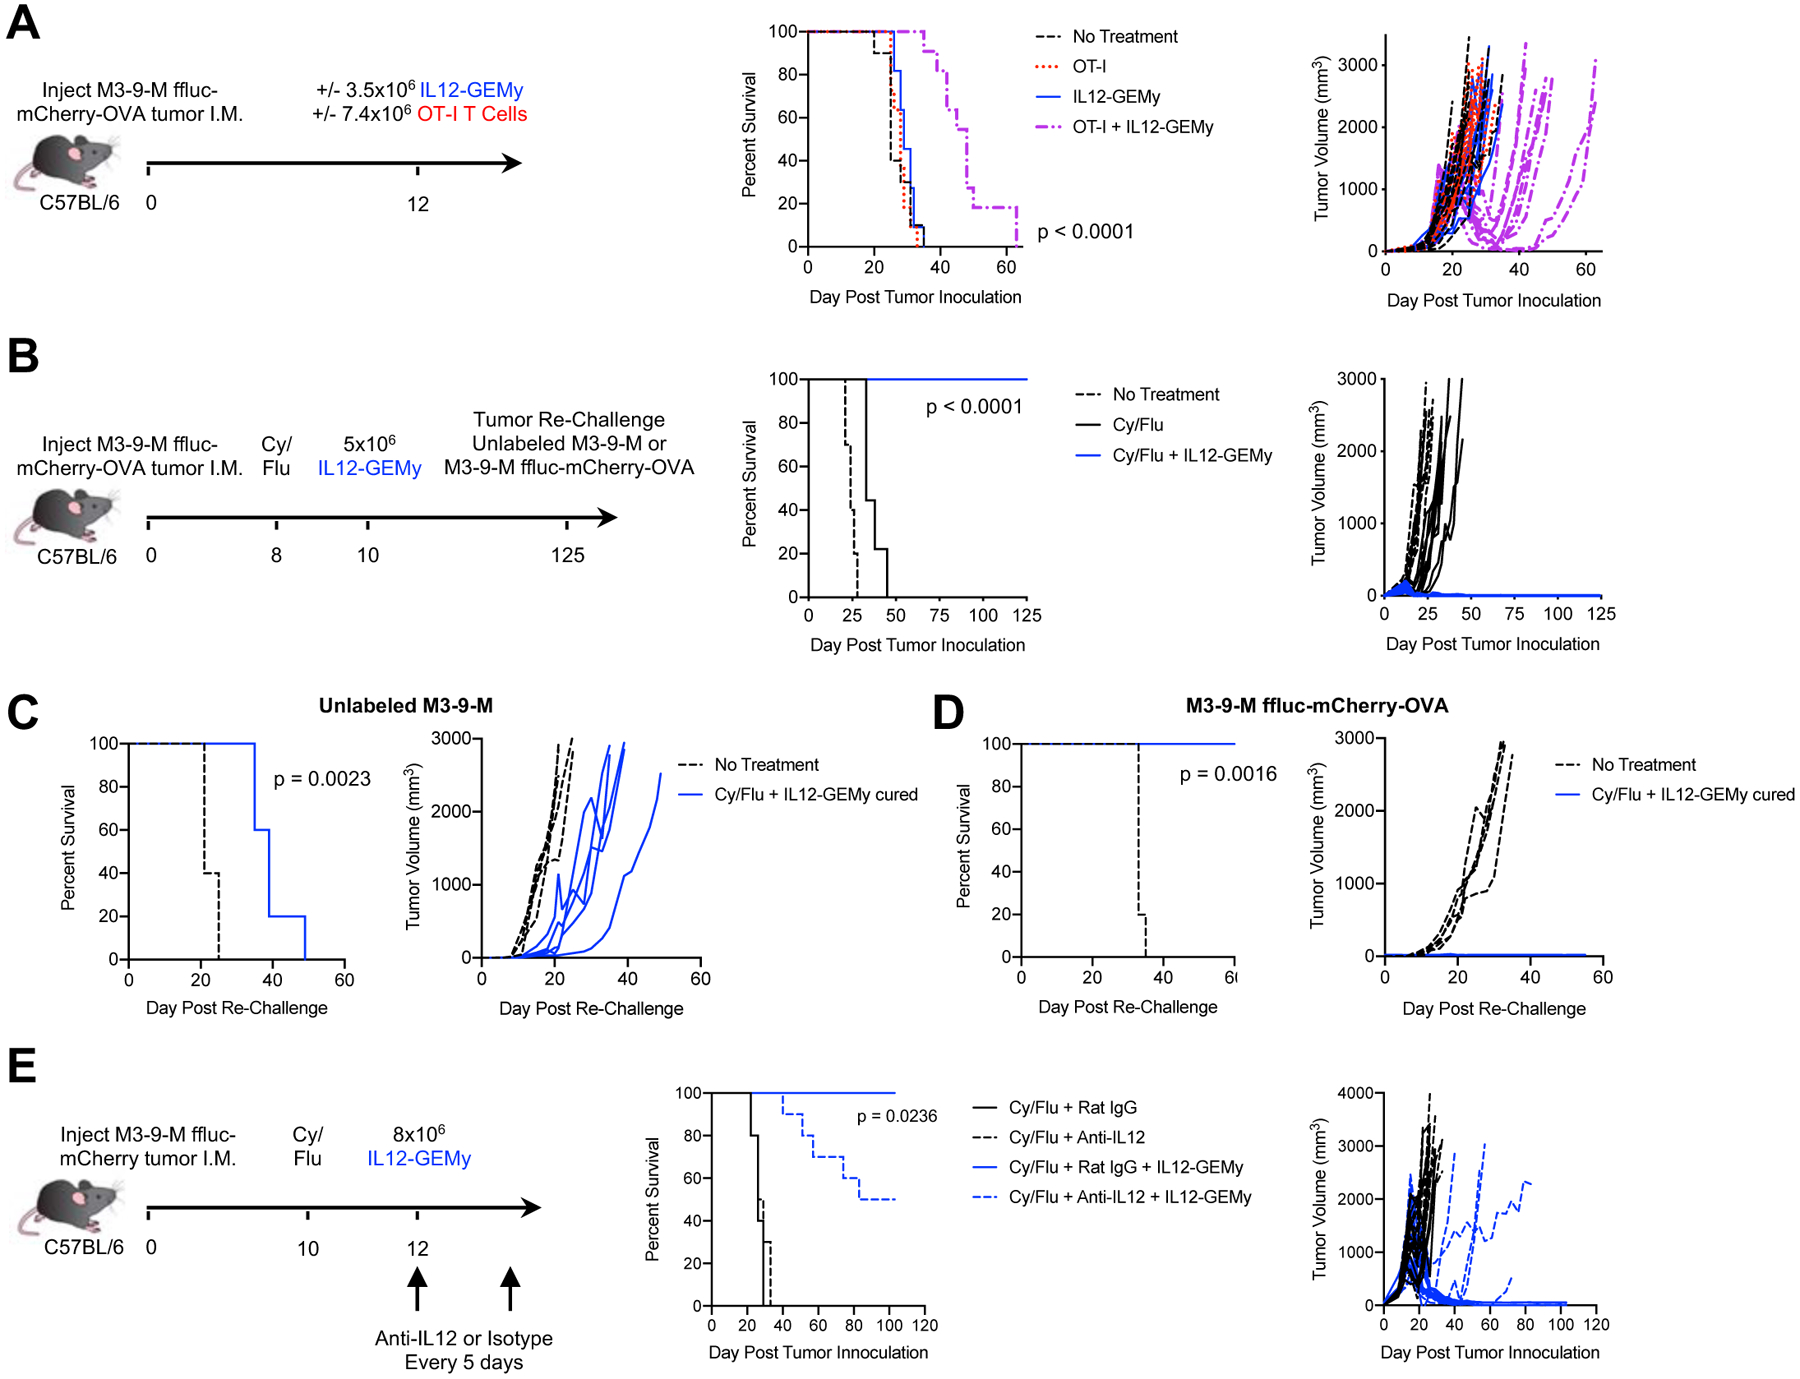
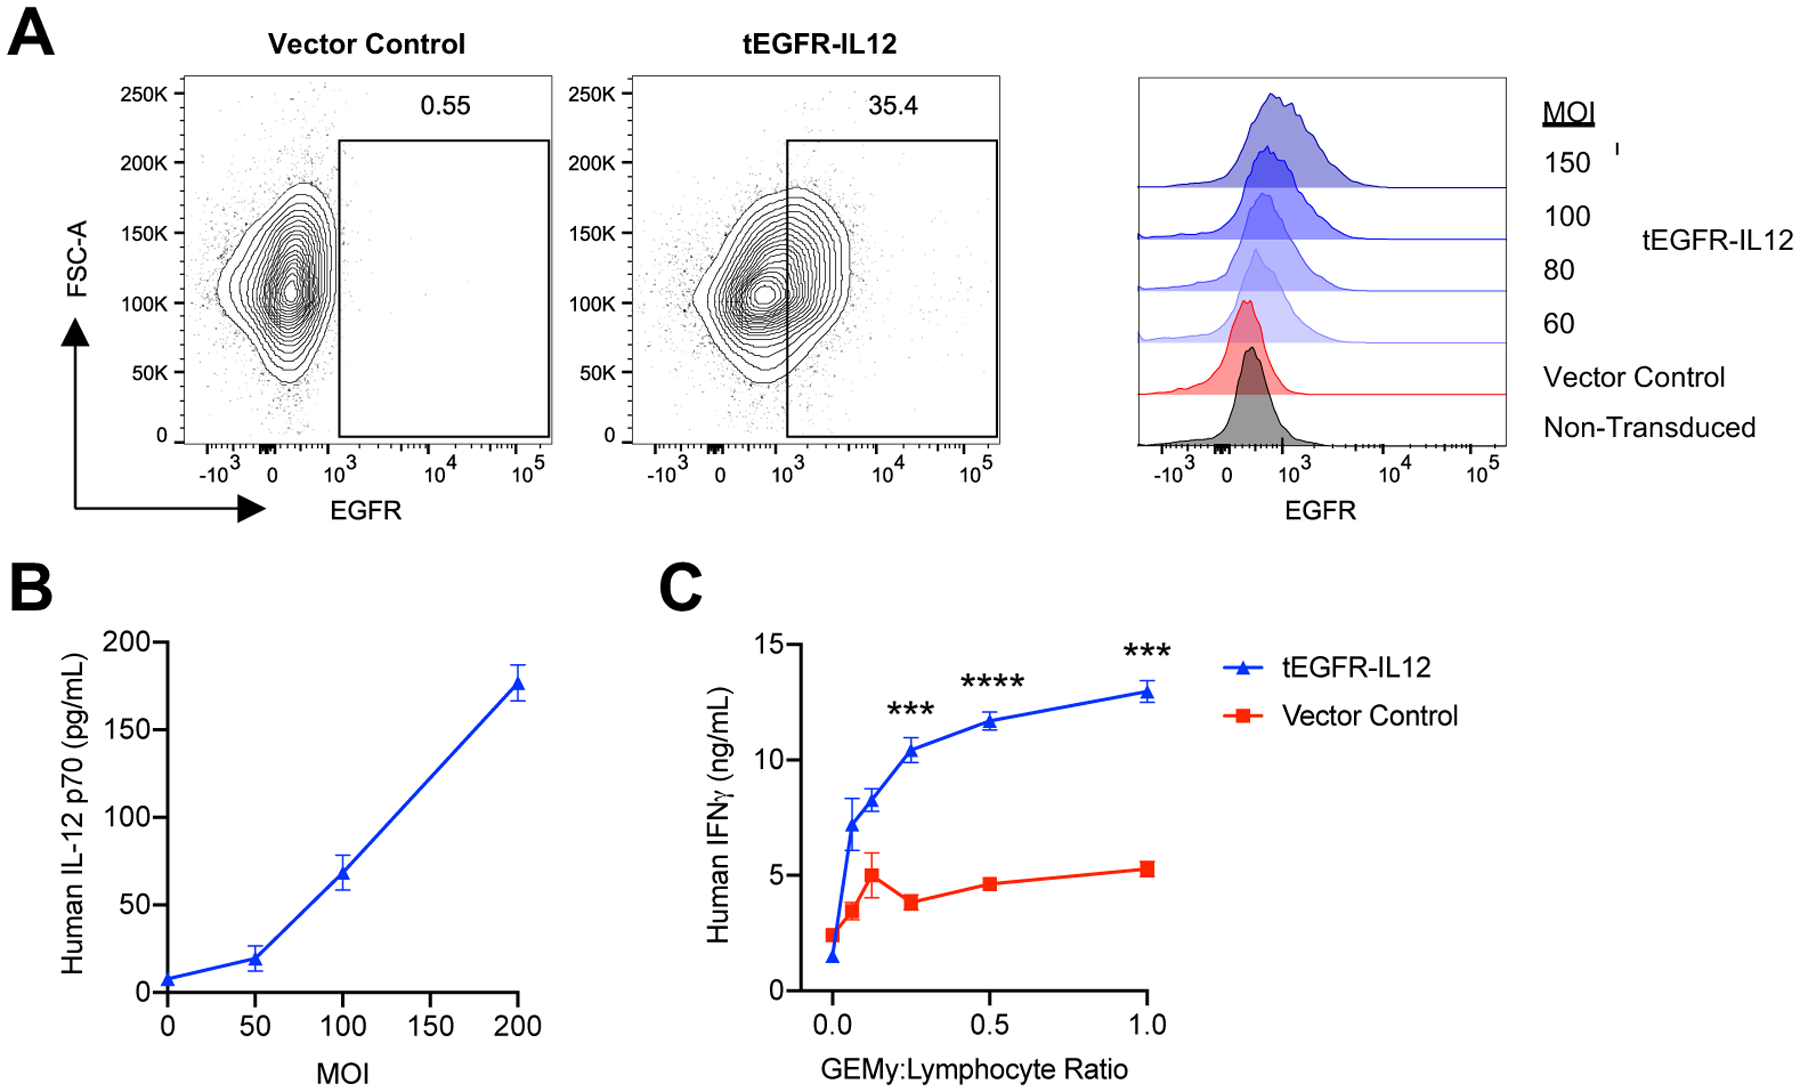
Metastasis is the leading cause of cancer-related deaths, and greater knowledge of the metastatic microenvironment is necessary to effectively target this process. Microenvironmental changes occur at distant sites prior to clinically detectable metastatic disease; however, the key niche regulatory signals during metastatic progression remain poorly characterized. Here, we identify a core immune suppression gene signature in pre-metastatic niche formation that is expressed predominantly by myeloid cells. We target this immune suppression program by utilizing genetically engineered myeloid cells (GEMys) to deliver IL-12 to modulate the metastatic microenvironment. Our data demonstrate that IL12-GEMy treatment reverses immune suppression in the pre-metastatic niche by activating antigen presentation and T cell activation, resulting in reduced metastatic and primary tumor burden and improved survival of tumor-bearing mice. We demonstrate that IL12-GEMys can functionally modulate the core program of immune suppression in the pre-metastatic niche to successfully rebalance the dysregulated metastatic microenvironment in cancer.

Keywords: T cells; cancer immunology; genetically engineered myeloid cells; immune suppression; immunotherapy; interleukin 12; metastasis tumor microenvironment; pre-metastatic niche; stem cell niche.


Conflict of interest statement

Declaration of interests S.K., D.W.B., H.Q., and R.N.K. are inventors on international patent application no. PCT/US2020/17515, “Genetically modified hematopoietic stem and progenitor cells (HSPCs) and mesenchymal cells as a platform to reduce or prevent metastasis, treat autoimmune and inflammatory disorders, and rebalance the immune milieu and dysregulated niches.” The remaining authors have no competing interests. Inclusion and diversity One or more of the authors of this paper self-identifies as an underrepresented ethnic minority in science. One or more of the authors of this paper received support from a program designed to increase minority representation in science. One or more of the authors of this paper self-identifies as living with a disability. One or more of the authors of this paper self-identifies as a member of the LGBTQ+ community.

Figures

Fig. 1:
Fig. 1:. Immune cell populations are dysregulated and upregulate a core immune suppression gene signature in the pre-metastatic lung.
A-B) Lungs from M3-9-M ffluc-eGFP tumor-bearing mice were harvested at various time points (n=8) and processed into single cell suspension. Naïve mice were taken at each time point and are indicated as day zero post tumor inoculation. Flow cytometry analysis of A) myeloid populations (Myeloid = CD11b+, Granulocytes = CD11b+Ly6G+, Monocytes = CD11b+Ly6GLy6C+, Macrophages = CD11b+F4/80+, Monocytic Dendritic Cells = CD11b+CD11c+, Conventional Dendritic Cells = CD11bCD11c+) and B) lymphocyte populations (T Cells = CD3+, CD8+ T cells = CD3+CD8+, CD4+ T Cells = CD3+CD4+, NK Cells = CD3NK1.1+). All populations are gated on live CD45+ single cells. Data was analyzed by ordinary one-way ANOVA with Dunnett’s multiple comparisons test between the mean of day 0 and each time point. C-D) Lungs were harvested from naïve mice or on day 15 post primary tumor inoculation, flash frozen and RNA was isolated for bulk mRNA sequencing (n=4). Data is presented as C) a volcano plot and D) select gene sets that were significantly enriched (q-value < 0.1) in RNA-seq expression profiles of pre-metastatic compared to naïve lungs. E-H) Lungs were harvested from naïve mice or on day 15 post primary tumor inoculation and processed into single cell suspension for scRNA-seq (n=4). E) UMAP plots of cell clusters. F) Pie charts and plot of cell number per cluster analyzed by the Kolmogorov-Smirnov test. G) Feature plots showing the expression level of select genes from the pre-metastatic gene signature across the cell clusters. H) Expression levels of select genes in myeloid cell clusters. DC = dendritic cells; Mac = macrophages; Mono = monocytes; Gran = granulocytes; MAST = MAST cells; Eos = eosinophils. Statistical differences between groups were analyzed by Wilcoxon test. **** p < 0.0001; *** 0.0001 < p < 0.001; ** 0.001 < p < 0.01; * 0.01 < p < 0.05. In boxplots, the center line represents the median, the box limits denote the 25th to the 75th percentile and the whiskers represent the minimum and maximum value. See also Figures S1–4.
Fig. 2:
Fig. 2:. IL12-GEMy treatment alters immune populations in pre-metastatic lungs.
A) Schematic of IL12-GEMy production. B) Cosine similarity of IL12-GEMy bulk RNA-seq data with profiles of each cluster in scRNA-seq data. Similarity is based on the expression of the most variable genes in randomly drawn sub-samples of 90% of cells in each cluster. The similarity score was then computed as the average cosine similarity across 100 sub-samples and the IL12-GEMy product. The similarity score can range between 0 and 1, indicating either complete dissimilarity or similarity, respectively with 0.65 being the highest score in our data. The four most similar populations to IL12-GEMys are shown. C) IL12-GEMys were washed after transduction, plated at 5×10⁵ cells/mL and cultured for 18 hours. Supernatant was collected and analyzed for IL-12 by ELISA. Statistical significance was calculated using the Kruskal-Wallis test. D) 8×10⁶ vector control or IL12-GEMys generated from GFP+Luciferse+ donor mice were injected into M3-9-M tumor-bearing mice 12 days after primary tumor inoculation (n=3–6 mice per group per time point). Lungs were harvested and flash frozen at indicated time points, tissues were homogenized and analyzed by ELISA. Statistical analysis was performed by Kolmogorov-Smirnov test at each time point. E-G) Mice were inoculated with M3-9-M ffluc-mCherry tumor and not treated (n=9) or treated with control non-transduced myeloid cells (n=5) or IL12-GEMys (n=10) on days 12, 19, and 26. Lungs were harvested on day 27 and analyzed by flow cytometry gated on live CD45+ single cells. Flow cytometry data was analyzed by Kruskal-Wallis test with Dunn’s multiple comparisons test. E) Myeloid cell populations in the lungs (Myeloid = CD11b+, Monocytic Dendritic Cells = CD11b+CD11c+, Conventional Dendritic Cells = CD11bCD11c+, Granulocytes = CD11b+Ly6G+, Monocytes = CD11b+CD43+Ly6C+, Macrophages = CD11b+CD43+Ly6C+F4/80+). F) The number of T and NK cells in the lungs (T Cells = CD3+, CD8+ T cells = CD3+CD8+, CD4+ T Cells = CD3+CD4+, NK Cells = CD3NK1.1+). G) The proportion of CD8+ and CD4+ T cells expressing PD1 and CD44 in the lungs. H) Immunofluorescence staining of FFPE lung sections collected 15 days after tumor inoculation, 3 days after treatment with 8×10⁶ IL12-GEMys. Quantification was performed on 20x images of n=5 mice per group, 8 images per mouse, and analyzed by Kolmogorov-Smirnov test. Representative 40x images of nuclear (blue), CD4 (red), and CD8 (green) staining is shown. Scale bar represents 50 μm. **** p < 0.0001; *** 0.0001 < p < 0.001; ** 0.001 < p < 0.01; * 0.01 < p < 0.05. In bar and line graphs, data are represented as mean ± SEM. In boxplots, the center line represents the median, the box limits denote the 25th to the 75th percentile and the whiskers represent the minimum and maximum value. See also Figure S5.
Fig. 3:
Fig. 3:. IL12-GEMy treatment reverses the core immune suppression gene program in the lung microenvironment and activates adaptive immunity.
Mice were inoculated with M3-9-M ffluc-mCherry primary tumor and treated with 8×10⁶ IL12-GEMys on day 12. Lungs were flash frozen (A-C) or processed into single cell suspension (D-G) three days post-treatment (n=4 mice per group). A) Expression of selected genes in the lung comparing naïve non-treated tumor-bearing mice and IL12-GEMy-treated tumor-bearing mice. B) Log-fold changes of the top 50 genes up-regulated in pre-metastatic lungs (red) and the top 50 genes down-regulated in pre-metastatic lungs (blue) in the lungs of non-treated and IL12-GEMy-treated tumor-bearing mice. P-values were determined using a one-sided Wilcoxon rank-sum test. C) Gene set enrichment analysis of differential gene expression data from the lungs of IL12-GEMy-treated compared to non-treated mice. Red bars indicate a positive normalized enrichment score (NES) and blue bars indicate a negative normalized enrichment score (NES). D) Ingenuity pathway analysis of the differential gene expression between IL12-GEMy-treated and non-treated pre-metastatic lungs for individual myeloid cell clusters by single cell RNA sequencing. Red bars indicate positive z-scores and blue bars indicate negative z-scores. E-G) Expression levels of key genes associated with E) response to IL-12, F) antigen processing and presentation, and G) immune suppression and the pre-metastatic niche are shown on a per-cluster basis for non-treated and IL12-GEMy-treated tumor-bearing mice. Cyto T = cytotoxic T cells; Non-Cyto T = non-cytotoxic T cells; NK Cells = natural killer cells; DC = dendritic cells; Mac = macrophages; Mono = monocytes; Gran = granulocytes; Other Ly = other lymphocytes; MAST = MAST cells; NISC = non-immune stromal cells; Endo = endothelial cells; Eos = eosinophils; Epi = epithelial cells; RBC = erythrocytes. Statistical differences between groups analyzed by Wilcoxon test. **** p < 0.0001; *** 0.0001 < p < 0.001; ** 0.001 < p < 0.01; * 0.01 < p < 0.05. See also Figure S6A–D.
Fig. 4:
Fig. 4:. IL12-GEMy treatment limits metastasis and extends survival in mice.
A-B) Mice were injected orthotopically with 5×10⁵ M3-9-M ffluc-mCherry tumor cells and treated with 8×10⁶ vector control or IL12-GEMys on day 12. A) Lungs were harvested on day 22 and bioluminescent metastatic burden in the lungs was measured using an in vivo imaging system (IVIS) (n=10 mice per group) and analyzed by Kolmogorov-Smirnov test. B) Mice were monitored for tumor growth and survival (n=10 mice per group) analyzed by Log-rank (Mantel-Cox) test. C) Mice were injected with 5×10⁴ M3-9-M ffluc-mCherry via tail vein and treated with 8×10⁶ IL12-GEMy i.v. 11 days post tumor injection, then followed for survival and metastatic progression by bioluminescent imaging using IVIS (no treatment n=10, IL12-GEMy n=8). Quantification is shown on day 20 post tumor inoculation and analyzed by Kolmogorov-Smirnov test. Representative IVIS images and average radiance of tumor-bearing mice are shown. Survival curves were analyzed by Log-rank (Mantel-Cox) test. D) Mice were orthotopically injected with 5×10⁵ M3-9-M ffluc-mCherry cells and treated with 8×10⁶ IL12-GEMys on day 17 followed by primary tumor resection by amputation of the tumor-bearing leg on day 24 and monitored for metastatic progression and survival by IVIS (no treatment n=15, IL12-GEMy n=10). Average radiance of mice on day 40 post tumor injection analyzed by Kolmogorov-Smirnov test and representative IVIS images are shown. E) Mice were orthotopically inoculated with 5×10⁵ M3-9-M ffluc-mCherry cells. On day 10, groups of mice were left untreated or given a single dose of 2 mg cyclophosphamide (Cy) i.p. On day 12, groups of mice were left untreated or treated with 1×10⁶ or 8×10⁶ IL12-GEMys i.v. (labeled “Low IL12-GEMy” and “High IL12-GEMy,” respectively) and followed for primary tumor growth and survival (n=10). Statistics measured by Log-rank (Mantel-Cox) test. are shown for Cy compared to no treatment (p=0.0035), Cy + Low IL12-GEMy compared to Cy (p=0.006), and Cy + High IL12-GEMy compared to Cy (p<0.001). F) Mice were injected intrasplenically with 5×10⁵ KPC177669-ffluc2-mCherry cells, spleens were resected, and mice were treated with 8×10⁶ IL12-GEMys on day 5. Mice were monitored for survival and tumor growth by IVIS. average radiance of tumor-bearing mice on day 29 analyzed by Kolmogorov-Smirnov test and representative IVIS images and are shown (no treatment n=11, IL12-GEMy n=12). Survival data were tested for significance by Log-rank (Mantel-Cox) test. **** p < 0.0001; *** 0.0001 < p < 0.001; ** 0.001 < p < 0.01; * 0.01 < p < 0.05. In boxplots, the center line represents the median, the box limits denote the 25th to the 75th percentile and the whiskers represent the minimum and maximum value. See also Figure S6E–G.
Fig. 5:
Fig. 5:. IL12-GEMy treatment induces T and NK cell activation.
A) Naïve or activated splenocytes from OT-I or OT-II mice were co-cultured with non-transduced control myeloid cells or IL12-GEMys at various ratios and IFNγ was quantified by ELISA at 24 hours. Statistical analysis was performed by unpaired t test at each ratio. B) The expression of key T cell phenotype genes in bulk RNA isolated from the lungs of naïve, tumor-bearing mice, or 8×10⁶ IL12-GEMy treated tumor-bearing mice on day 15 post primary tumor inoculation and 3 days after IL12-GEMy treatment (n=4). C) Violin plots of scRNA-seq data showing gene expression by cluster (n=4). Statistical differences between groups analyzed by Wilcoxon test. Cyto T = cytotoxic T cells; Non-Cyto T = non-cytotoxic T cells; NK Cells = natural killer cells; Other Ly = other lymphocytes. D) Ingenuity pathway analysis of cytotoxic T cell and NK cell clusters from single cell RNA sequencing. Red bars indicate positive z-scores and blue bars indicate negative z-scores. E) Cytotoxic T cell, Non-Cytotoxic T cell, NK cell, and Other Lymphocyte clusters were subsetted from the whole lung scRNA-seq analysis and reclustered to identify more specific cell subsets. UMAP plots and the number of cells per cluster is shown. Statistical analysis between groups was performed by Kolmogorov-Smirnov test of each cluster. F) The expression level of genes associated with effector function and cytotoxicity in the high resolution T and NK cell clusters. Statistical differences between groups analyzed by Wilcoxon test. G) M3-9-M ffluc-mCherry tumor-bearing mice were treated with 200 ug of isotype, anti-CD8, or anti-CD4 antibody or 100 ug of anti-NK1.1 antibody i.p. on days 9, 11, and 12 to induce depletion of cell populations. 8×10⁶ IL12-GEMys were injected intravenously on day 12. Depletion antibody treatment was continued at 200 ug per dose every 3–5 days for the duration of the experiment. Survival and tumor growth of mice treated with IL12-GEMys and antibody depletion regimens are shown (n=9). Survival data were tested for significance by Log-rank (Mantel-Cox) test. **** p < 0.0001; *** 0.0001 < p < 0.001; ** 0.001 < p < 0.01; * 0.01 < p < 0.05. In line graphs, data are represented as mean ± SEM. In boxplots, the center line represents the median, the box limits denote the 25th to the 75th percentile and the whiskers represent the minimum and maximum value. See also Figure S6H and Figure S7A.
Fig. 6:
Fig. 6:. IL12-GEMy treatment is enhanced by combination with adoptive transfer of tumor-specific CD8+ T cells or chemotherapy pre-conditioning and generates long-lived tumor-specific memory.
A) Mice were orthotopically injected with M3-9-M ffluc-mCherry-OVA tumors. Mice received either no treatment (n=10), 7.4×10⁶ OT-I T cells (n=11), 3.5×10⁶ IL12-GEMy (n=11), or both (n=11) intravenously on day 12. B) Mice were orthotopically injected with M3-9-M ffluc-mCherry-OVA and treated with 2 mg of cyclophosphamide and 5 mg of fludarabine i.p. on day 8. Mice received 5×10⁶ IL12-GEMys intravenously on day 10. Survival and tumor growth were monitored over time (no treatment n=10, Cy/Flu n=9, Cy/Flu + IL12-GEMy n=10). IL12-GEMy-cured mice were re-challenged with C) unlabeled M3-9-M cells or D) M3-9-M ffluc-mCherry-OVA in the contralateral leg compared to naïve age-matched controls (n=5). E) Mice were orthotopically injected with M3-9-M ffluc-mCherry tumor, treated with 2 mg of cyclophosphamide and 5 mg of fludarabine i.p. on day 10, and 8×10⁶ IL12-GEMys on day 12. Anti-IL12 or Rat IgG isotype antibody was administered starting on day 12 and every 5 days for the duration of the experiment (n=10). Survival data were tested for significance by Log-rank (Mantel-Cox) test. See also Figure S7.
Fig. 7:
Fig. 7:. Generation of human IL12-GEMys.
Human monocyte SC cells were transduced with vector control or tEGFR-IL12 lentiviral vector for 24 hours. A) Transduction efficiency was measured by flow cytometry staining of truncated epidermal growth factor receptor (tEGFR) expression with varying multiplicity of infection (MOI) at 24 hours. Representative flow plots of MOI 150 are shown. B) IL12-GEMys were washed after 24 hour transduction and cultured for an additional 3 days. Human IL-12 production was measured by ELISA. C) Vector control or tEGFR-IL12 monocyte SC cells were transduced at an MOI of 150 for 24 hours, washed, and co-cultured with donor lymphocytes stimulated with TransAct beads and 40 units/mL of recombinant human IL-2 at varying GEMy:Lymphocyte ratios. Supernatant was collected at 24 hours and analyzed for IFNγ production by ELISA. Statistical analysis was performed by unpaired t tests for each ratio. **** p < 0.0001; *** 0.0001 < p < 0.001; ** 0.001 < p < 0.01; * 0.01 < p < 0.05. Data are represented as mean ± SEM.

Comment in

References

    1. ALBRENGUES J, SHIELDS MA, NG D, PARK CG, AMBRICO A, POINDEXTER ME, UPADHYAY P, UYEMINAMI DL, POMMIER A, KUTTNER V, BRUZAS E, MAIORINO L, BAUTISTA C, CARMONA EM, GIMOTTY PA, FEARON DT, CHANG K, LYONS SK, PINKERTON KE, TROTMAN LC, GOLDBERG MS, YEH JT & EGEBLAD M 2018. Neutrophil extracellular traps produced during inflammation awaken dormant cancer cells in mice. Science, 361. - PMC - PubMed
    1. AWAD RM, DE VLAEMINCK Y, MAEBE J, GOYVAERTS C & BRECKPOT K 2018. Turn Back the TIMe: Targeting Tumor Infiltrating Myeloid Cells to Revert Cancer Progression. Frontiers in Immunology, 9. - PMC - PubMed
    1. BEURY DW, CARTER KA, NELSON C, SINHA P, HANSON E, NYANDJO M, FITZGERALD PJ, MAJEED A, WALI N & OSTRAND-ROSENBERG S 2016. Myeloid-Derived Suppressor Cell Survival and Function Are Regulated by the Transcription Factor Nrf2. J Immunol, 196, 3470–8. - PMC - PubMed
    1. BONAPACE L, COISSIEUX MM, WYCKOFF J, MERTZ KD, VARGA Z, JUNT T & BENTIRES-ALJ M 2014. Cessation of CCL2 inhibition accelerates breast cancer metastasis by promoting angiogenesis. Nature, 515, 130–3. - PubMed
    1. BREMPELIS KJ, COWAN CM, KREUSER SA, LABADIE KP, PRIESKORN BM, LIEBERMAN NAP, ENE CI, MOYES KW, CHINN H, DEGOLIER KR, MATSUMOTO LR, DANIEL SK, YOKOYAMA JK, DAVIS AD, HOGLUND VJ, SMYTHE KS, BALCAITIS SD, JENSEN MC, ELLENBOGEN RG, CAMPBELL JS, PIERCE RH, HOLLAND EC, PILLARISETTY VG & CRANE CA 2020. Genetically engineered macrophages persist in solid tumors and locally deliver therapeutic proteins to activate immune responses. J Immunother Cancer, 8. - PMC - PubMed

Publication types

MeSH terms