. 2021 Mar;149(3):1644.
doi: 10.1121/10.0003572.

Speech categorization is better described by induced rather than evoked neural activity

Affiliations

Speech categorization is better described by induced rather than evoked neural activity

Md Sultan Mahmud et al. J Acoust Soc Am. 2021 Mar.

Abstract

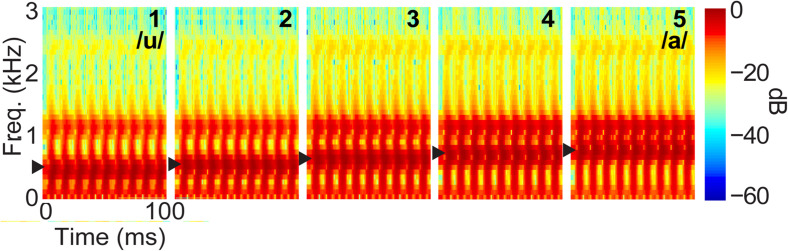
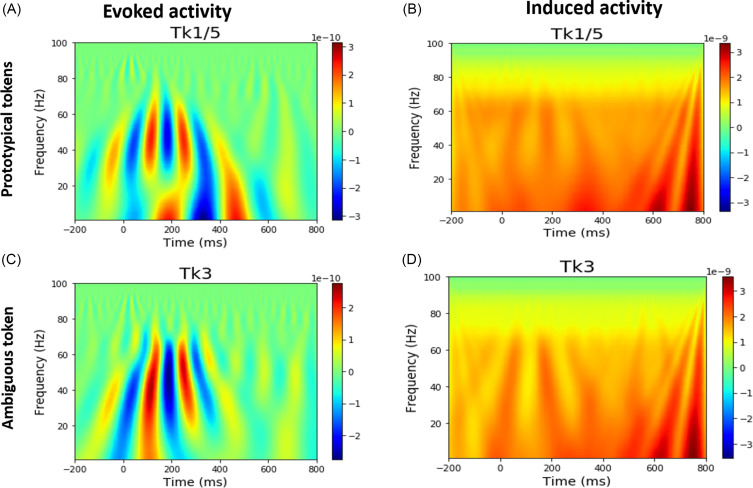
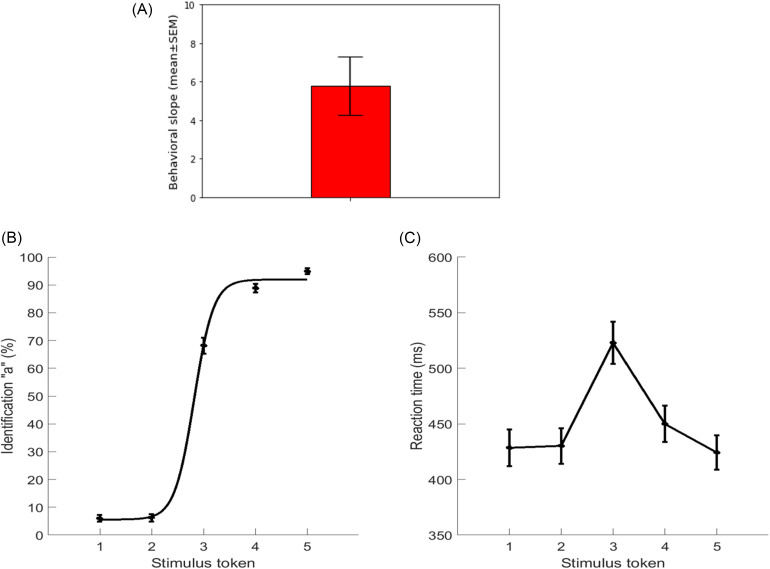
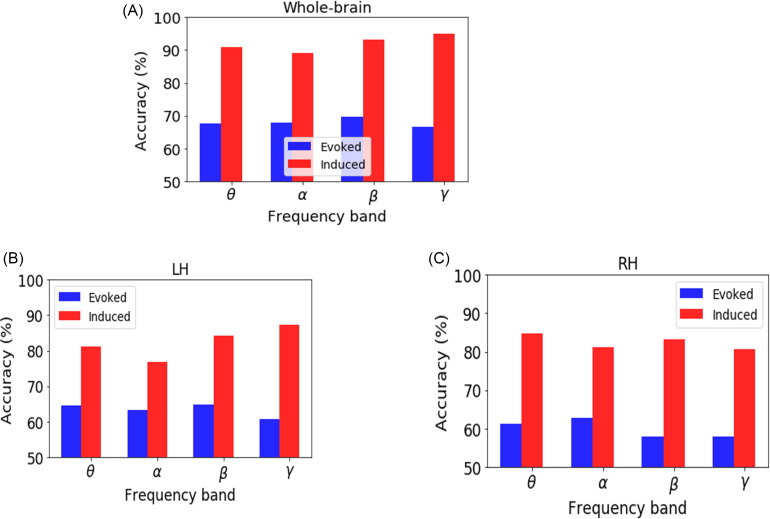
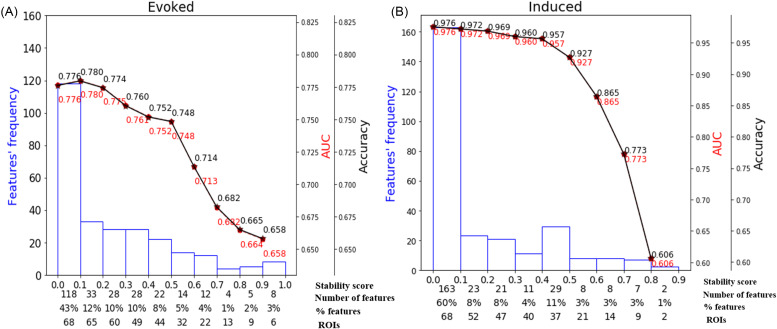
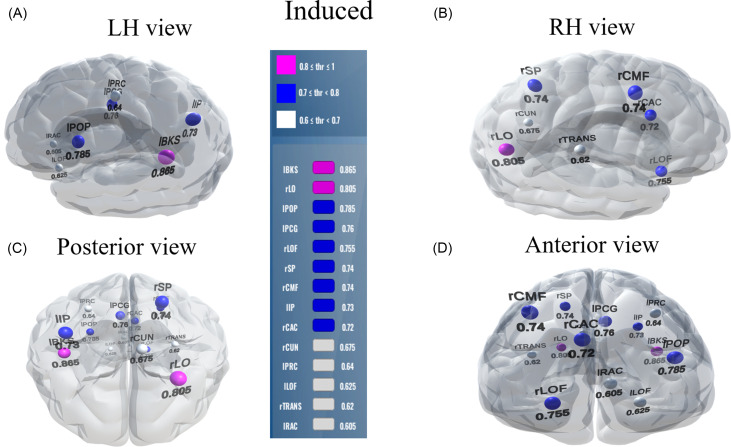
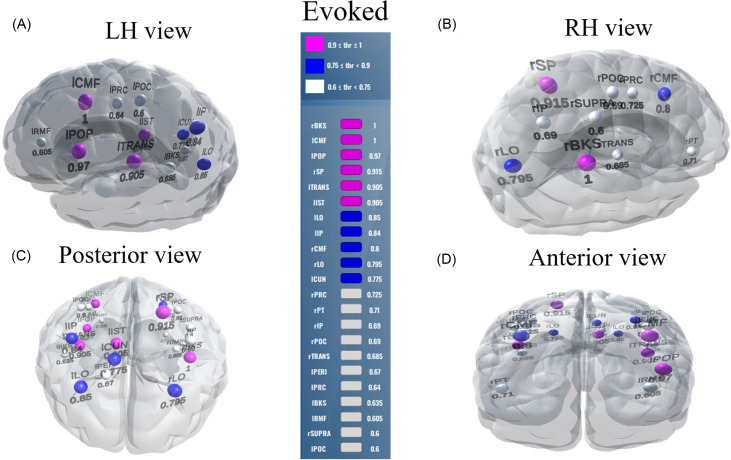
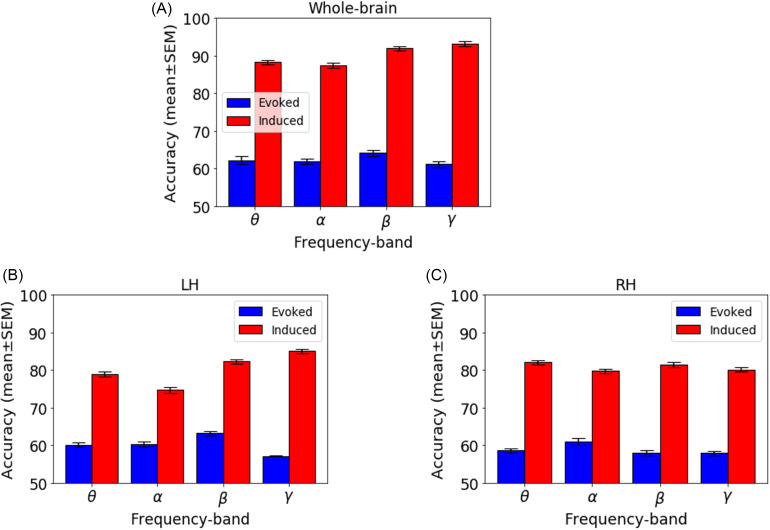
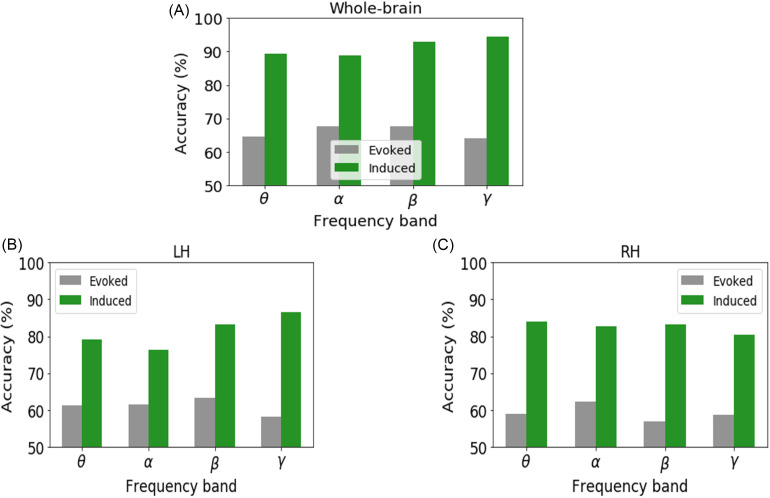
Categorical perception (CP) describes how the human brain categorizes speech despite inherent acoustic variability. We examined neural correlates of CP in both evoked and induced electroencephalogram (EEG) activity to evaluate which mode best describes the process of speech categorization. Listeners labeled sounds from a vowel gradient while we recorded their EEGs. Using a source reconstructed EEG, we used band-specific evoked and induced neural activity to build parameter optimized support vector machine models to assess how well listeners' speech categorization could be decoded via whole-brain and hemisphere-specific responses. We found whole-brain evoked β-band activity decoded prototypical from ambiguous speech sounds with ∼70% accuracy. However, induced γ-band oscillations showed better decoding of speech categories with ∼95% accuracy compared to evoked β-band activity (∼70% accuracy). Induced high frequency (γ-band) oscillations dominated CP decoding in the left hemisphere, whereas lower frequencies (θ-band) dominated the decoding in the right hemisphere. Moreover, feature selection identified 14 brain regions carrying induced activity and 22 regions of evoked activity that were most salient in describing category-level speech representations. Among the areas and neural regimes explored, induced γ-band modulations were most strongly associated with listeners' behavioral CP. The data suggest that the category-level organization of speech is dominated by relatively high frequency induced brain rhythms.


Figures

FIG. 1.
FIG. 1.
(Color online) Speech stimuli. Acoustic spectrograms of the speech continuum from /u/ and /a/. Arrows, first formant frequency.
FIG. 2.
FIG. 2.
(Color online) Grand average neural oscillatory responses to prototypical vowel [e.g., Tk1/5 and ambiguous speech token (Tk3)]. [(A),(C)] Evoked activity for prototypical vs ambiguous tokens. [(B),(D)] Induced activity for prototypical vs ambiguous tokens. Responses are from primary auditory cortex (PAC; lTRANS, left transverse temporal gyrus).
FIG. 3.
FIG. 3.
(Color online) Behavioral results. (A) Behavioral slope. (B) Psychometric functions showing % “a” identification of each token. Listeners' perception abruptly shifts near the continuum midpoint, reflecting a flip in the perceived phonetic category (i.e., “u” to “a”). (C) RTs for identifying each token. RTs are faster for prototype tokens (i.e., Tk1/5) and slow when categorizing ambiguous tokens at the continuum's midpoint (i.e., Tk3). Errorbars = ±1 s.e.m. (standard error of the mean).
FIG. 4.
FIG. 4.
(Color online) Decoding categorical neural encoding using different frequency band features of the source-level EEG. The SVM results classifying prototypical (Tk1/5) vs ambiguous (Tk 3) speech sounds. (A) Whole-brain data (e.g., 68 ROIs), (B) LH (e.g., 34 ROIs), and (C) RH (e.g., 34 ROIs). Chance level = 50%.
FIG. 5.
FIG. 5.
(Color online) Effect of stability score threshold on model performance during (A) evoked activity and (B) induced activity during the CP task. The bottom of the x axis has four labels. Stability score represents the stability score range of each bin (scores range, 0–1); number of features represents the number of selected features under each bin; % features represents the corresponding percentage of selected features; and ROIs represents the number of cumulative unique brain regions up to the lower boundary of the bin.
FIG. 6.
FIG. 6.
(Color online) Stable (most consistent) neural network decoding using induced activity. Visualization of brain ROIs corresponding to ≥0.60 stability threshold (14 top selected ROIs), which show categorical organization (e.g., Tk1/5 ≠ Tk3) at 86.5%. (A) LH view (B) RH view, (C) posterior view, and (D) anterior view. Color legend demarcations show high (pink), moderate (blue), and low (white) stability scores. l/r, left/right; BKS, bankssts; LO, lateral occipital; POP, pars opercularis; PCG, posterior cingulate; LOF, lateral orbitofrontal; SP, superior parietal; CMF, caudal middle frontal; IP, inferior parietal; CAC, caudal anterior cingulate; CUN, cuneus; PRC, precentral; TRANS, transverse temporal; RAC, rostral anterior cingulate.
FIG. 7.
FIG. 7.
(Color online) Stable (most consistent) neural network decoded using evoked activity. Visualization of brain ROIs corresponding to ≥0.60 stability threshold (22 top selected ROIs), which decode Tk1/5 from Tk3 at 71.4%. Otherwise, as in Fig. 6. BKS, bankssts; CMF, caudal middle frontal; POP, pars opercularis; SP, superior parietal; TRANS, transverse temporal; IST, isthmus cingulate; LO, lateral occipital; IP, inferior parietal; CUN, cuneus; PRC, precentral; PT, pars triangularis; POC, postcentral; PERI, Pericalcarine; SUPRA, supra marginal.
FIG. 8.
FIG. 8.
(Color online) Decoding categorical neural encoding using different frequency band features of the source-level EEG. Mean accuracy of the SVM fivefold cross-validation results classifying prototypical (Tk1/5) vs ambiguous (Tk 3) speech sounds. (A) Whole-brain data (e.g., 68 ROIs), (B) LH (e.g., 34 ROIs), and (C) RH (e.g., 34 ROIs). Chance level = 50%. Errorbars = ±1 s.e.m.
FIG. 9.
FIG. 9.
(Color online) Decoding categorical neural encoding using different frequency band features of the source-level EEG. The KNN results classifying prototypical (Tk1/5) vs ambiguous (Tk 3) speech sounds. (A) Whole-brain data (e.g., 68 ROIs), (B) LH (e.g., 34 ROIs), and (C) RH (e.g., 34 ROIs).

Similar articles

Cited by

References

    1. Alain, C. (2007). “ Breaking the wave: Effects of attention and learning on concurrent sound perception,” Hear. Res. 229, 225–236.10.1016/j.heares.2007.01.011 - DOI - PubMed
    1. Al-Fahad, R. , Yeasin, M. , and Bidelman, G. M. (2020). “ Decoding of single-trial EEG reveals unique states of functional brain connectivity that drive rapid speech categorization decisions,” J. Neural Eng. 17, 016045.10.1088/1741-2552/ab6040 - DOI - PMC - PubMed
    1. Bashivan, P. , Bidelman, G. M. , and Yeasin, M. (2014). “ Spectrotemporal dynamics of the EEG during working memory encoding and maintenance predicts individual behavioral capacity,” Eur. J. Neurosci. 40, 3774–3784.10.1111/ejn.12749 - DOI - PubMed
    1. Bidelman, G. M. (2015). “ Induced neural beta oscillations predict categorical speech perception abilities,” Brain Lang. 141, 62–69.10.1016/j.bandl.2014.11.003 - DOI - PubMed
    1. Bidelman, G. M. (2017). “ Amplified induced neural oscillatory activity predicts musicians' benefits in categorical speech perception,” Neuroscience 348, 107–113.10.1016/j.neuroscience.2017.02.015 - DOI - PubMed

Publication types