

Clustering based approach for population level identification of condition-associated T-cell receptor β-chain CDR3 sequences
- PMID: 33765908
- PMCID: PMC7993519
- DOI: 10.1186/s12859-021-04087-7
Clustering based approach for population level identification of condition-associated T-cell receptor β-chain CDR3 sequences
Abstract
Background: Deep immune receptor sequencing, RepSeq, provides unprecedented opportunities for identifying and studying condition-associated T-cell clonotypes, represented by T-cell receptor (TCR) CDR3 sequences. However, due to the immense diversity of the immune repertoire, identification of condition relevant TCR CDR3s from total repertoires has mostly been limited to either "public" CDR3 sequences or to comparisons of CDR3 frequencies observed in a single individual. A methodology for the identification of condition-associated TCR CDR3s by direct population level comparison of RepSeq samples is currently lacking.
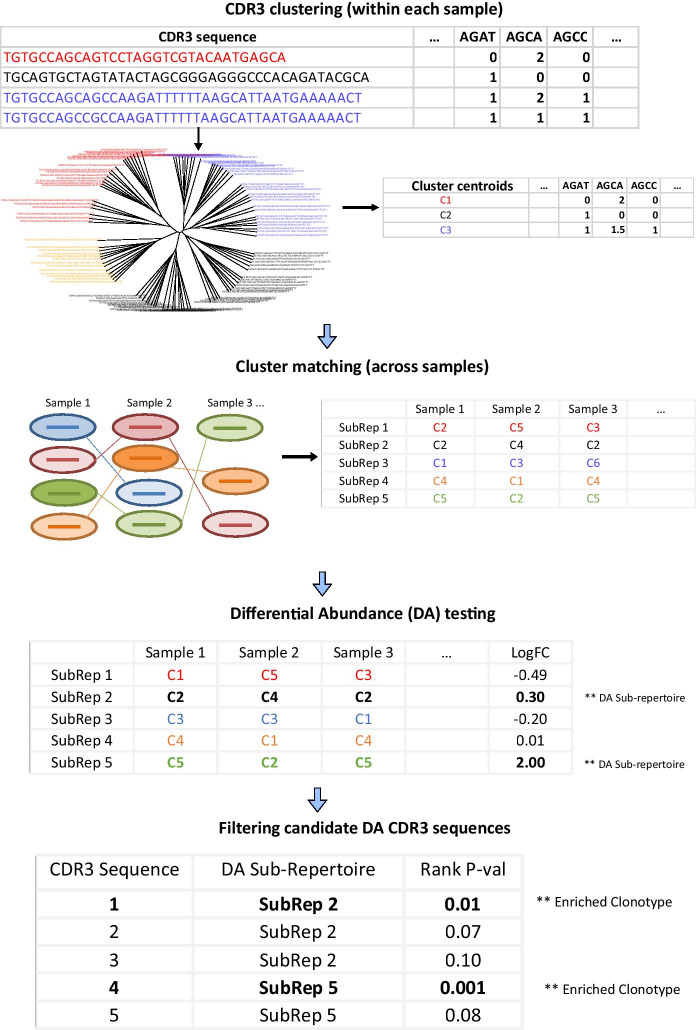
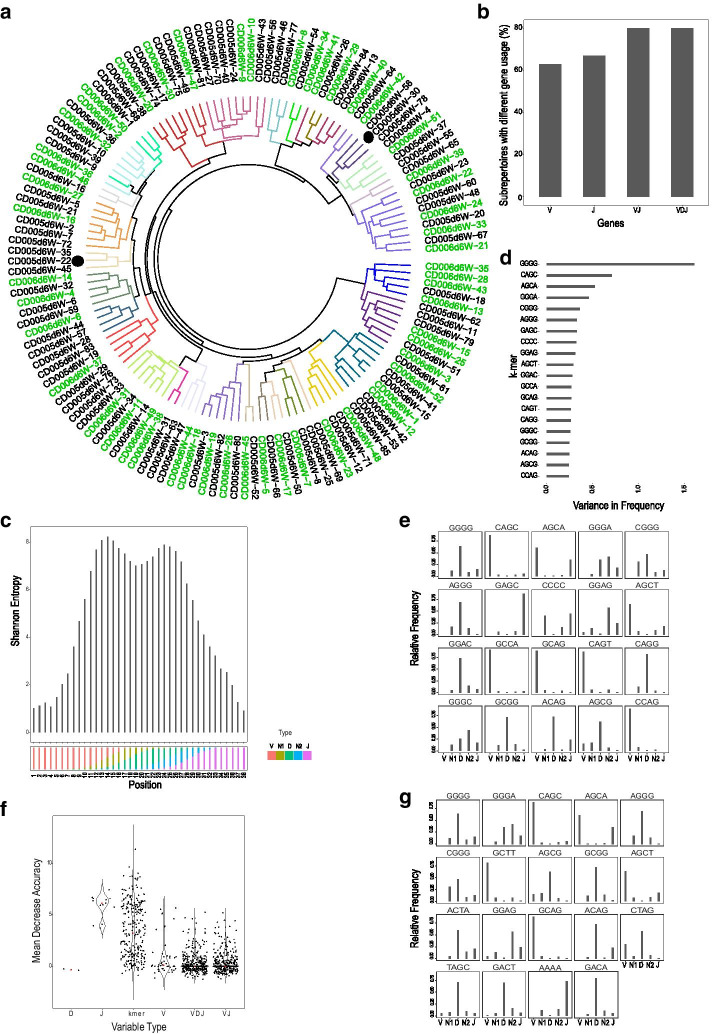
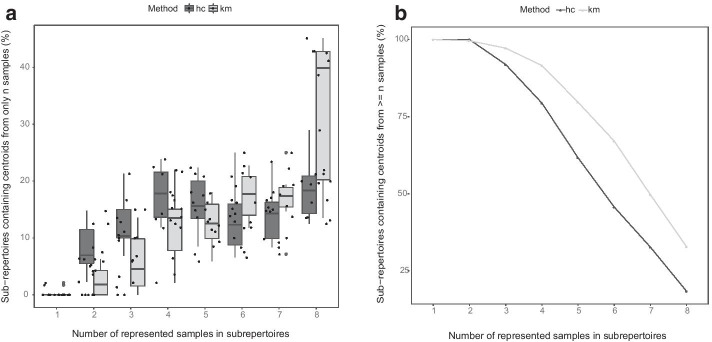
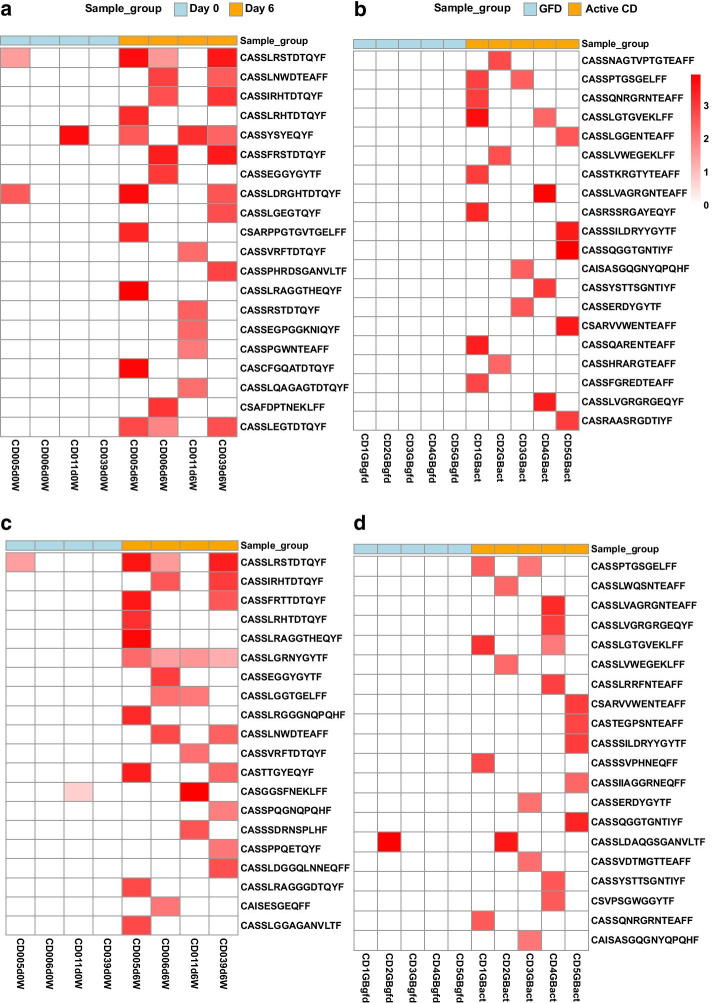
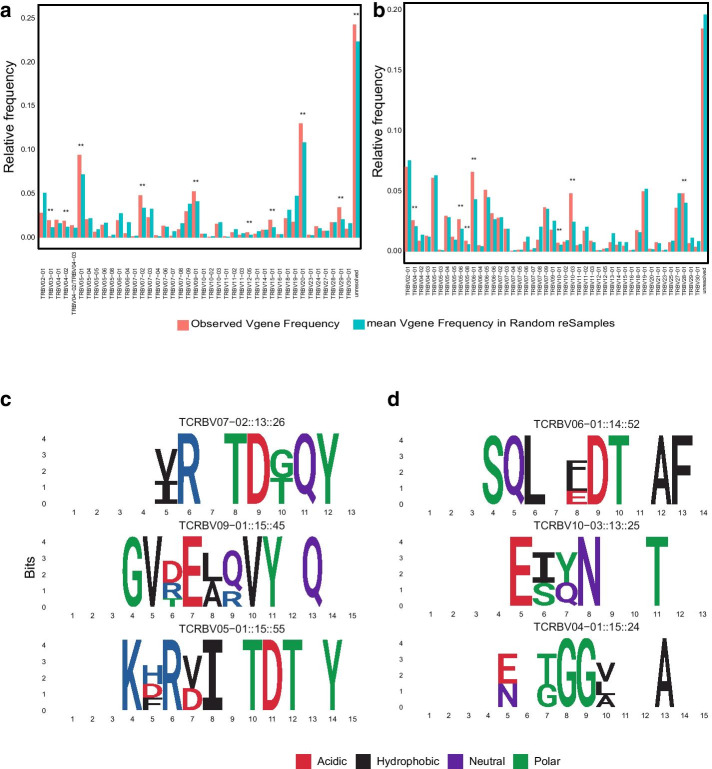
Results: We present a method for direct population level comparison of RepSeq samples using immune repertoire sub-units (or sub-repertoires) that are shared across individuals. The method first performs unsupervised clustering of CDR3s within each sample. It then finds matching clusters across samples, called immune sub-repertoires, and performs statistical differential abundance testing at the level of the identified sub-repertoires. It finally ranks CDR3s in differentially abundant sub-repertoires for relevance to the condition. We applied the method on total TCR CDR3β RepSeq datasets of celiac disease patients, as well as on public datasets of yellow fever vaccination. The method successfully identified celiac disease associated CDR3β sequences, as evidenced by considerable agreement of TRBV-gene and positional amino acid usage patterns in the detected CDR3β sequences with previously known CDR3βs specific to gluten in celiac disease. It also successfully recovered significantly high numbers of previously known CDR3β sequences relevant to each condition than would be expected by chance.
Conclusion: We conclude that immune sub-repertoires of similar immuno-genomic features shared across unrelated individuals can serve as viable units of immune repertoire comparison, serving as proxy for identification of condition-associated CDR3s.
Keywords: Antigen-specific TCR identification; Celiac disease associated TCR clonotypes; Computational antigen-specificity identification; Immune repertoire analysis; Immuno-informatics; TCR clustering; TCR differential abudance analysis; TCR repertoire analysis.
Conflict of interest statement
The authors declare that they have no competing interests.
Figures
Similar articles
-
Comprehensive Analysis of CDR3 Sequences in Gluten-Specific T-Cell Receptors Reveals a Dominant R-Motif and Several New Minor Motifs.Front Immunol. 2021 Apr 13;12:639672. doi: 10.3389/fimmu.2021.639672. eCollection 2021. Front Immunol. 2021. PMID: 33927715 Free PMC article.
-
High-throughput sequencing of CD4+ T cell repertoire reveals disease-specific signatures in IgG4-related disease.Arthritis Res Ther. 2019 Dec 19;21(1):295. doi: 10.1186/s13075-019-2069-6. Arthritis Res Ther. 2019. PMID: 31856905 Free PMC article.
-
Epstein-Barr Virus Epitope-Major Histocompatibility Complex Interaction Combined with Convergent Recombination Drives Selection of Diverse T Cell Receptor α and β Repertoires.mBio. 2020 Mar 17;11(2):e00250-20. doi: 10.1128/mBio.00250-20. mBio. 2020. PMID: 32184241 Free PMC article.
-
Current status and recent advances of next generation sequencing techniques in immunological repertoire.Genes Immun. 2016 Apr;17(3):153-64. doi: 10.1038/gene.2016.9. Epub 2016 Mar 10. Genes Immun. 2016. PMID: 26963138 Review.
-
Application of the molecular analysis of the T-cell receptor repertoire in the study of immune-mediated hematologic diseases.Hematology. 2003 Jun;8(3):173-81. doi: 10.1080/1024533031000107505. Hematology. 2003. PMID: 12745651 Review.
Cited by
-
Reference-based comparison of adaptive immune receptor repertoires.Cell Rep Methods. 2022 Aug 22;2(8):100269. doi: 10.1016/j.crmeth.2022.100269. eCollection 2022 Aug 22. Cell Rep Methods. 2022. PMID: 36046619 Free PMC article.
-
Specificity of Adaptive Immune Responses in Central Nervous System Health, Aging and Diseases.Front Neurosci. 2022 Jan 20;15:806260. doi: 10.3389/fnins.2021.806260. eCollection 2021. Front Neurosci. 2022. PMID: 35126045 Free PMC article. Review.
-
Utility of Bulk T-Cell Receptor Repertoire Sequencing Analysis in Understanding Immune Responses to COVID-19.Diagnostics (Basel). 2022 May 13;12(5):1222. doi: 10.3390/diagnostics12051222. Diagnostics (Basel). 2022. PMID: 35626377 Free PMC article. Review.
-
BertTCR: a Bert-based deep learning framework for predicting cancer-related immune status based on T cell receptor repertoire.Brief Bioinform. 2024 Jul 25;25(5):bbae420. doi: 10.1093/bib/bbae420. Brief Bioinform. 2024. PMID: 39177262 Free PMC article.
-
CompAIRR: ultra-fast comparison of adaptive immune receptor repertoires by exact and approximate sequence matching.Bioinformatics. 2022 Sep 2;38(17):4230-4232. doi: 10.1093/bioinformatics/btac505. Bioinformatics. 2022. PMID: 35852318 Free PMC article.
References
MeSH terms
Substances
LinkOut - more resources
Full Text Sources
Other Literature Sources
