. 2021 Mar 25;20(1):31.
doi: 10.1186/s12938-021-00865-9.

Machine learning associated with respiratory oscillometry: a computer-aided diagnosis system for the detection of respiratory abnormalities in systemic sclerosis

Affiliations

Machine learning associated with respiratory oscillometry: a computer-aided diagnosis system for the detection of respiratory abnormalities in systemic sclerosis

Domingos S M Andrade et al. Biomed Eng Online. .

Abstract

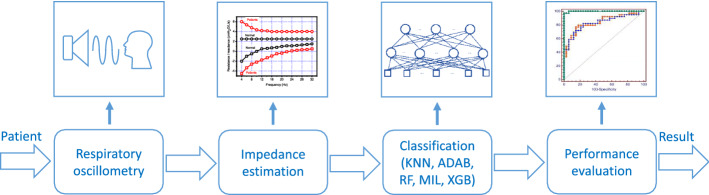
Introduction: The use of machine learning (ML) methods would improve the diagnosis of respiratory changes in systemic sclerosis (SSc). This paper evaluates the performance of several ML algorithms associated with the respiratory oscillometry analysis to aid in the diagnostic of respiratory changes in SSc. We also find out the best configuration for this task.

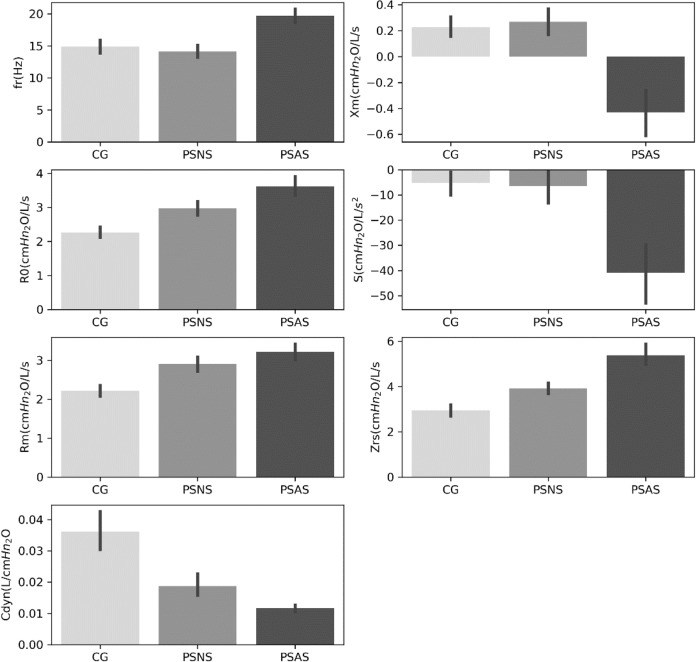
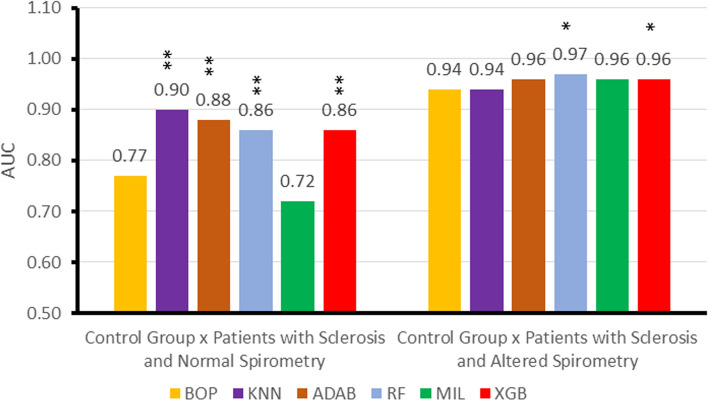
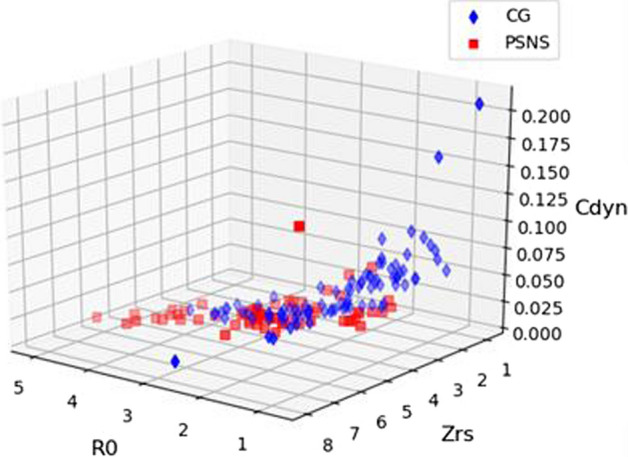
Methods: Oscillometric and spirometric exams were performed in 82 individuals, including controls (n = 30) and patients with systemic sclerosis with normal (n = 22) and abnormal (n = 30) spirometry. Multiple instance classifiers and different supervised machine learning techniques were investigated, including k-Nearest Neighbors (KNN), Random Forests (RF), AdaBoost with decision trees (ADAB), and Extreme Gradient Boosting (XGB).

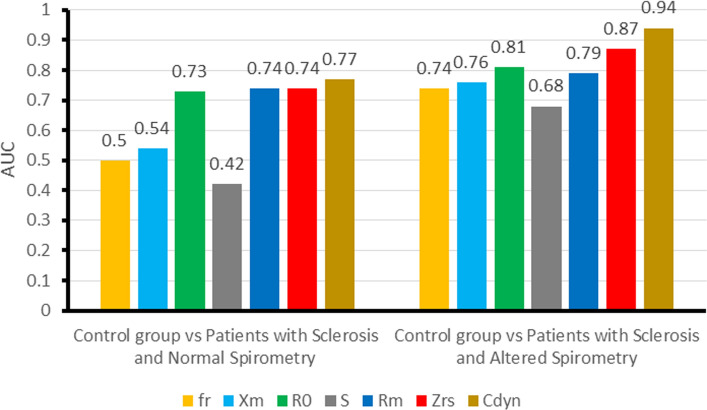
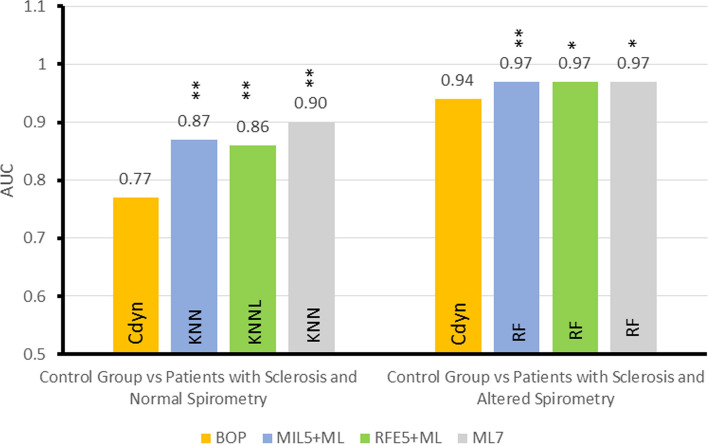
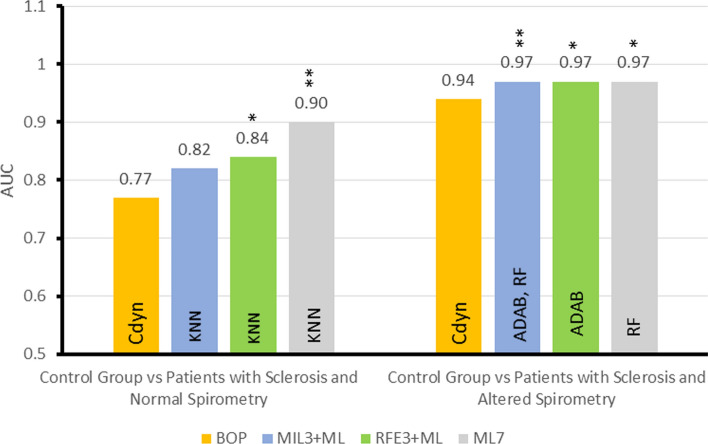
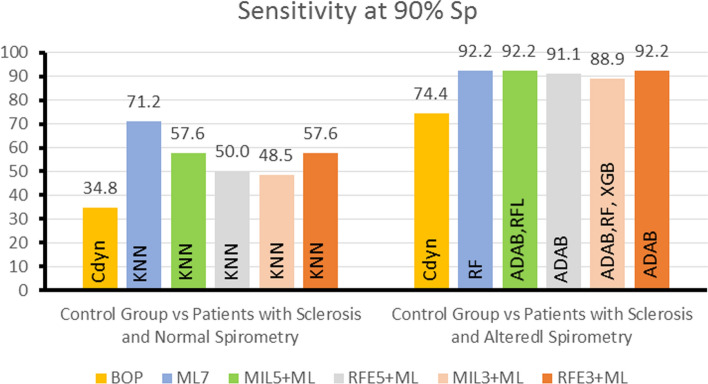
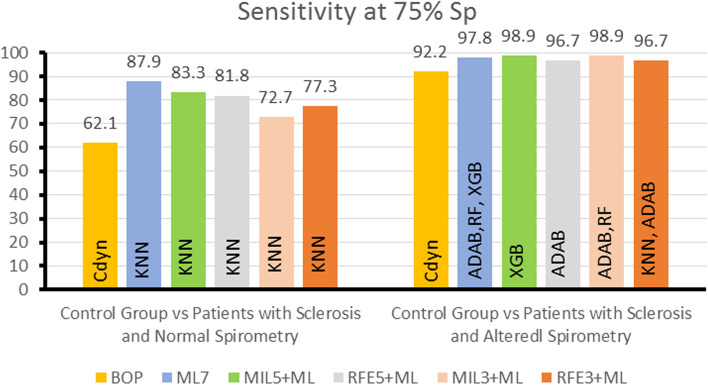
Results and discussion: The first experiment of this study showed that the best oscillometric parameter (BOP) was dynamic compliance, which provided moderate accuracy (AUC = 0.77) in the scenario control group versus patients with sclerosis and normal spirometry (CGvsPSNS). In the scenario control group versus patients with sclerosis and altered spirometry (CGvsPSAS), the BOP obtained high accuracy (AUC = 0.94). In the second experiment, the ML techniques were used. In CGvsPSNS, KNN achieved the best result (AUC = 0.90), significantly improving the accuracy in comparison with the BOP (p < 0.01), while in CGvsPSAS, RF obtained the best results (AUC = 0.97), also significantly improving the diagnostic accuracy (p < 0.05). In the third, fourth, fifth, and sixth experiments, different feature selection techniques allowed us to spot the best oscillometric parameters. They resulted in a small increase in diagnostic accuracy in CGvsPSNS (respectively, 0.87, 0.86, 0.82, and 0.84), while in the CGvsPSAS, the best classifier's performance remained the same (AUC = 0.97).

Conclusions: Oscillometric principles combined with machine learning algorithms provide a new method for diagnosing respiratory changes in patients with systemic sclerosis. The present study's findings provide evidence that this combination may help in the early diagnosis of respiratory changes in these patients.

Keywords: Clinical decision support system; Diagnostic of respiratory diseases; Forced oscillation technique; Machine learning; Respiratory oscillometry; System identification techniques; Systemic sclerosis.


Conflict of interest statement

The authors declare that they have no competing interests.

Figures

Fig. 1
Fig. 1
Mean values ± 95% confidence interval of each FOT parameter. Control group (CG), patients with sclerosis and normal spirometry (PSNS), and patients with sclerosis and altered spirometry (PSAS). The analysis of variance (ANOVA) showed that all parameters presented a significant difference in their respective mean values (p < 0.001)
Fig. 2
Fig. 2
Results of experiment 1, describing the diagnostic accuracy of oscillometry in sclerosis. fr: resonance frequency; Xm: mean respiratory reactance; R0: respiratory resistance extrapolated at 0 Hz; S: slope of the linear relationship of resistance versus frequency; Rm: mean respiratory resistance; Zrs: absolute value of respiratory impedance in 4 Hz; Cdyn: respiratory system dynamic compliance
Fig. 3
Fig. 3
Comparative analysis of the diagnostic accuracy in experiment 2, considering the best oscillometric parameter (BOP) obtained without the use of classifiers), machine learning algorithms, and the MIL classifier. K-NN K-Nearest Neighbor, ADAB Adaboost with decision tree classifiers, RF Random Forests, MIL Multiple Instance Learning, XGB Extreme Boosting Gradient Classifiers, AUC area under the ROC curve. Also, “*” indicates that there a statistically significant difference comparing to BOP (p < 0.05) and “**” (p < 0.01)
Fig. 4
Fig. 4
Summary of Experiment 3 (MIL5 + ML: MIL as five feature selector) and Experiment 4 (RFE5 + ML: RFE as a five feature selector)—AUCs for the best oscillometric parameter (BOP), for the best ML algorithms in experiments 3 and 4, and the best ML algorithm with oscillometric parameters (ML7). The figure indicates the best oscillometric parameter and the best ML algorithm in each case. Also, “*” indicates that there a statistically significant difference comparing to BOP (p < 0.05) and “**” (p < 0.01)
Fig. 5
Fig. 5
Summary of Experiment 5 (MIL3 + ML: MIL as three feature selector) and Experiment 6 (RFE3 + ML: RFE as a three feature selector)—AUCs for the best oscillometric parameter (BOP), for the best ML algorithms in experiments 5 and 6, and the best ML algorithm with oscillometric parameters (ML7). The figure indicates the best oscillometric parameter and the best ML algorithm in each case. Also, “*” indicates that there a statistically significant difference comparing to BOP (p < 0.05) and “**” (p < 0.01)
Fig. 6
Fig. 6
Representation of the dataset CGvsPSNS using three features: R0, Zrs, and Cdyn
Fig. 7
Fig. 7
Summary of the experiments describing comparisons of the sensitivity at 90% Sp obtained using the best oscillometric parameter (BOP) and ML methods in all experiments. The sensitivity at 90% Sp presented is that of the best classifier
Fig. 8
Fig. 8
Summary of the experiments describing comparisons of the sensitivity at 75% Sp obtained using the best oscillometric parameter (BOP) and ML methods in all experiments. The sensitivity at 75% Sp presented is that of the best classifier
Fig. 9
Fig. 9
Simplified block diagram describing the main steps in this study. K-NN K-Nearest Neighbor, ADAB Adaboost with decision tree classifiers, RF Random Forests, MIL Multiple Instance Learning, XGB Extreme Boosting Gradient Classifiers

Similar articles

Cited by

References

    1. Ostojic P, Cerinic MM, Silver R, Highland K, Damjanov N. Interstitial lung disease in systemic sclerosis. Lung. 2007;185(4):211–220. doi: 10.1007/s00408-007-9012-3. - DOI - PubMed
    1. Miranda IA, Dias Faria AC, Lopes AJ, Jansen JM, de Melo PL. On the respiratory mechanics measured by forced oscillation technique in patients with systemic sclerosis. PLoS ONE. 2013;8(4):e61657. doi: 10.1371/journal.pone.0061657. - DOI - PMC - PubMed
    1. MacIntyre NR. The future of pulmonary function testing. Respir Care. 2012;57(1):154–164. doi: 10.4187/respcare.01422. - DOI - PubMed
    1. King GG, Bates J, Berger KI, Calverley P, de Melo PL, Dellaca RL, Farre R, Hall GL, Ioan I, Irvin CG, et al. Technical standards for respiratory oscillometry. Eur Respir J. 2020;55(2):1900753. doi: 10.1183/13993003.00753-2019. - DOI - PubMed
    1. Faria AC, Lopes AJ, Jansen JM, Melo PL. Assessment of respiratory mechanics in patients with sarcoidosis using forced oscillation: correlations with spirometric and volumetric measurements and diagnostic accuracy. Respir Int Rev Thorac Dis. 2009;78(1):93–104. - PubMed