. 2021 Mar 25;23(1):40.
doi: 10.1186/s13058-021-01418-7.

High IRF8 expression correlates with CD8 T cell infiltration and is a predictive biomarker of therapy response in ER-negative breast cancer

Affiliations

High IRF8 expression correlates with CD8 T cell infiltration and is a predictive biomarker of therapy response in ER-negative breast cancer

Gerardo Gatti et al. Breast Cancer Res. .

Erratum in

Abstract

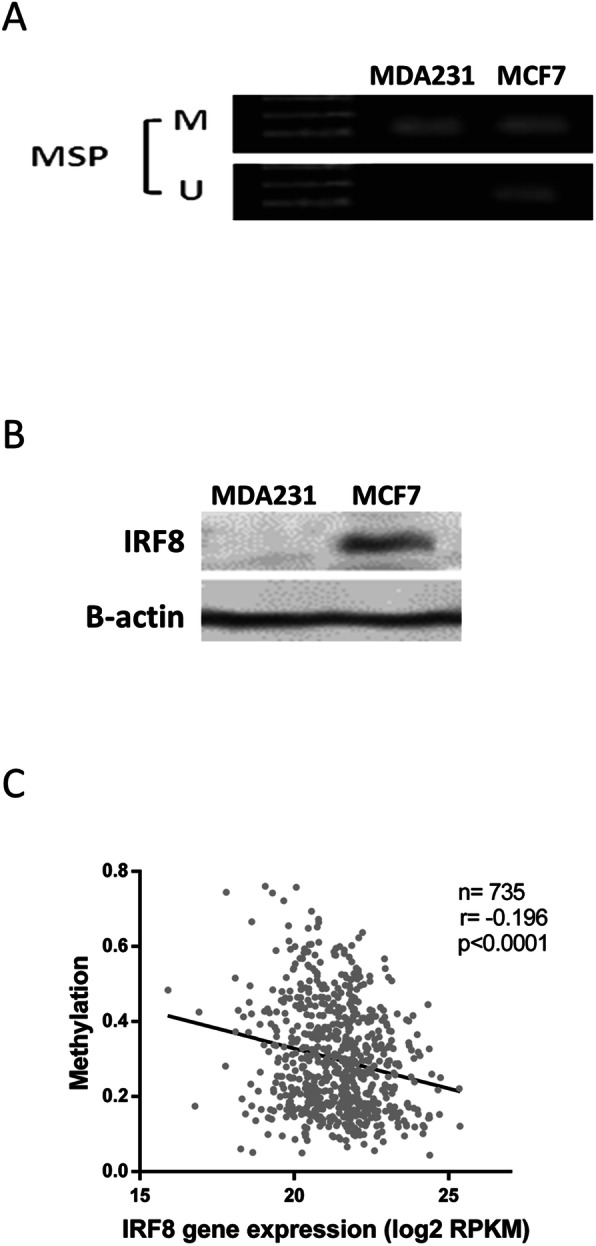
Background: Characterization of breast cancer (BC) through the determination of conventional markers such as ER, PR, HER2, and Ki67 has been useful as a predictive and therapeutic tool. Also, assessment of tumor-infiltrating lymphocytes has been proposed as an important prognostic aspect to be considered in certain BC subtypes. However, there is still a need to identify additional biomarkers that could add precision in distinguishing therapeutic response of individual patients. To this end, we focused in the expression of interferon regulatory factor 8 (IRF8) in BC cells. IRF8 is a transcription factor which plays a well-determined role in myeloid cells and that seems to have multiple antitumoral roles: it has tumor suppressor functions; it acts downstream IFN/STAT1, required for the success of some therapeutic regimes, and its expression in neoplastic cells seems to depend on a cross talk between the immune contexture and the tumor cells. The goal of the present study was to examine the relationship between IRF8 with the therapeutic response and the immune contexture in BC, since its clinical significance in this type of cancer has not been thoroughly addressed.

Methods: We identified the relationship between IRF8 expression and the clinical outcome of BC patients and validated IRF8 as predictive biomarker by using public databases and then performed in silico analysis. To correlate the expression of IRF8 with the immune infiltrate in BC samples, we performed quantitative multiplex immunohistochemistry.

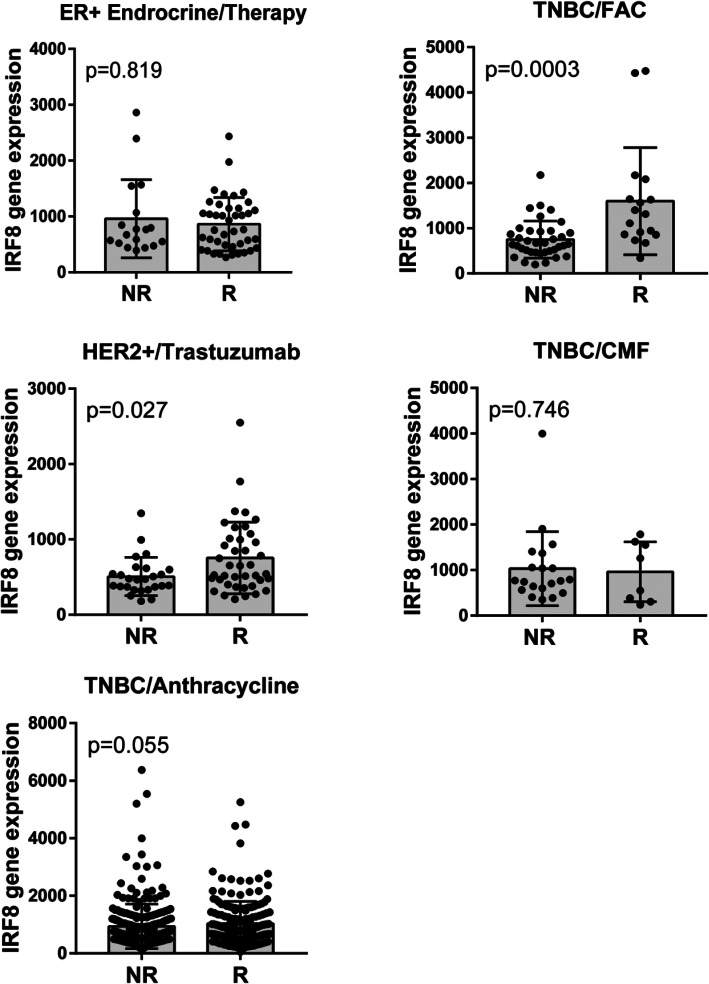
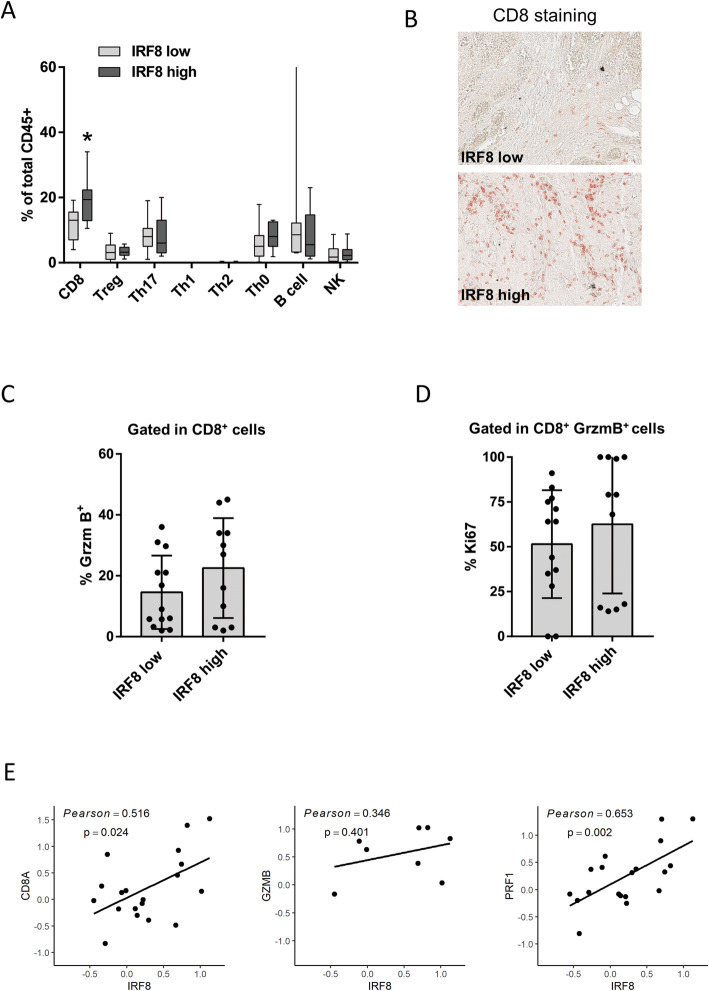
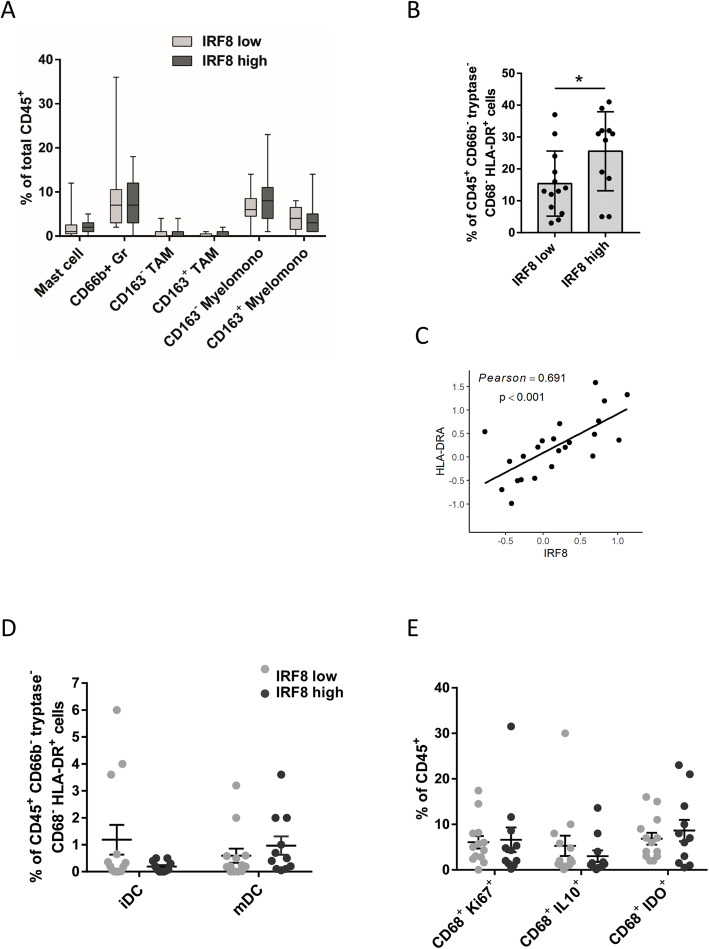
Results: IRF8 expression can precisely predict the complete pathological response to monoclonal antibody therapy or to select combinations of chemotherapy such as FAC (fluorouracil, adriamycin, and cytoxan) in ER-negative BC subtypes. Analysis of immune cell infiltration indicates there is a strong correlation between activated and effector CD8+ T cell infiltration and tumoral IRF8 expression.

Conclusions: We propose IRF8 expression as a potent biomarker not only for prognosis, but also for predicting therapy response in ER-negative BC phenotypes. Its expression in neoplastic cells also correlates with CD8+ T cell activation and infiltration. Therefore, our results justify new efforts towards understanding mechanisms regulating IRF8 expression and how they can be therapeutically manipulated.

Keywords: Breast cancer; DNA methylation; IRF8; Predictive marker; Tumor-infiltrate.


Conflict of interest statement

The authors declare that they have no competing interests.

Figures

Fig. 1
Fig. 1
Immunohistochemical staining of IRF8 expression in BC and sentinel nodes samples. a Grade 1 breast tumors (G1, n = 11), grade 2 breast tumors (G2, n = 52), grade 3 breast tumors (G3, n = 21), and lymph node metastases (LN, n = 13) (left panel). Negative (secondary antibody alone) and positive controls (tonsils) are shown (right panel). Anti-IRF8 immunoreactivity is shown as the brown-stained cells, whereas cells that are unreactive to the anti-IRF8 antibody are indicated by the blue (hematoxylin) counterstain. Magnification, × 400. b Representative pictures of the different staining patterns for the entire score range from 0 to 3 (upper panel). Stratification of tumors according to staining intensity (score) for IRF8 (0: negative, + 1: weak, + 2: moderate, + 3: strong) (lower panel). c Stratification of the tumors as low or high IRF8 expression according to score classification (low: < 2 score, high: ≥ 2). p value as determined by Fisher’s exact test
Fig. 2
Fig. 2
Methylation of IRF8 in BC cell lines and samples. a Methylation of the IRF8 promoter was evaluated by methylation-specific PCR (MSP) in the BC cell lines MDA231 and MCF7 (M: methylated; U: unmethylated). b Expression of IRF8 evaluated by western blot in MDA231 and MCF7 cells. c Correlation of IRF8 promoter methylation and gene expression in BC samples. Data are from The MethHC database tool (http://methhc.mbc.nctu.edu.tw/). Gene expression value was obtained from RNA Seq RPKM (reads per kilobase per million mapped reads) values in TCGA Data Portal. Data shown in a and b are representative of two experiments performed
Fig. 3
Fig. 3
IRF8 is a prognostic marker in breast cancer ER-negative cancer. Kaplan-Meier plots of overall survival (OS) and relapse-free survival (RFS) by IRF8 status within molecular subtype BC. IRF8 groups were stratified using median cutoff of IRF8 value. The relationship between IRF8 expression and BC patients OS (a) and RFS (b) was analyzed using the Kaplan-Meier plotter data base (http://kmplot.com/analysis/). c) RFS was compared between high- and low-IRF8-expressing breast tumors for grade 1, grade 2, and grade 3 tumors. ER+: G1 (n = 323), G2 (n = 820), G3 (n = 492); ER−: G1 (n = 22), G2 (n = 81), G3 (n = 411). Patient samples were grouped based on the expression of IRF8 using the median cutoff value
Fig. 4
Fig. 4
IRF8 is a predictive marker for complete pathological response to trastuzumab and FAC treatment in HER2+ and TNBC. IRF8 expression in non-responder (NR) and responder (R) patients to the different therapeutic regimes. ER+ BC: endocrine therapy treatment (n = 60), TNBC: FAC (n = 54), CMF (n = 28) or anthracycline (n = 473) treatments, and HER2+ BC: trastuzumab treatment (n = 66). Endocrine therapy involves: tamoxifen and aromatase inhibitors. FAC: fluorouracil, adriamycin (doxorubicin), and cytoxan (cyclophosphamide). CMF: cyclophosphamide, methotrexate, and fluorouracil
Fig. 5
Fig. 5
Multiparameter cytometric image analysis for quantification of multiplex IHC. Image cytometry-based cell population analyses for the lymphoid and myeloid biomarker panels are shown in a and b, respectively. Gating thresholds for qualitative identification were determined based on data in negative controls. TMA of BC samples were stained with the lymphoid (c) and myeloid (d) biomarker panels by pseudo-coloring. Scale bars, 50 μm
Fig. 6
Fig. 6
Higher cancer cell IRF8 expression levels is associated with an increased infiltration of CD8+ T cells. a Lymphoid cell percentages were quantified as a percentage of total CD45+ cells in ER-negative BC samples classified according to IRF8 cancer cell expression as in Fig. 1. b Representative images of CD8 staining in ER-negative BC by using quantitative multiplex immunohistochemistry (AEC chromogenic staining). c Percentage of CD8+GrzmB+ cells in the total CD8+ T cell population infiltrating tumors. d Percentage of Ki67+ in CD8+GrzmB+ T cell population. e Correlation between IRF8 protein expression and molecules associated with the antitumor immune response. *p < 0.05
Fig. 7
Fig. 7
Higher cancer cell IRF8 expression levels is associated with an increased infiltration of CD45+ HLA-DR+ cells. a Myeloid cell percentages were quantified as a percentage of total CD45+ cells. b MHC II expression on CD45+ CD66b tryptase CD68 cells. c Correlation between IRF8 protein expression and HLA-DRA evaluated using iTRAQ. d Immature (DCsign+) dendritic cells (iDC) and mature (LAMP+) dendritic cells (mDC) percentages were quantified as a percentage of CD45+ CD66b tryptase CD68 HLA-DR+ cells. e Frequency of macrophages expressing Ki67, IL10, or IDO. *p < 0.05

References

    1. Feng J, Wang H, Shin DM, Masiuk M, Qi CF, Morse HC., 3rd IFN regulatory factor 8 restricts the size of the marginal zone and follicular B cell pools. J Immunol. 2011;186(3):1458–1466. doi: 10.4049/jimmunol.1001950. - DOI - PMC - PubMed
    1. Holtschke T, Löhler J, Kanno Y, Fehr T, Giese N, Rosenbauer F, Lou J, Knobeloch KP, Gabriele L, Waring JF, Bachmann MF, Zinkernagel RM, Morse HC, III, Ozato K, Horak I. Immunodeficiency and chronic myelogenous leukemia-like syndrome in mice with a targeted mutation of the ICSBP gene. Cell. 1996;87(2):307–317. doi: 10.1016/S0092-8674(00)81348-3. - DOI - PubMed
    1. Kim SH, Burton J, Yu CR, Sun L, He C, Wang H, Morse HC, 3rd, Egwuagu CE. Dual-function of the IRF8 transcription factor in autoimmune uveitis: loss of IRF8 in T cells exacerbates uveitis while Irf8 deletion in the retina confers protection. J Immunol. 2015;195(4):1480–1488. doi: 10.4049/jimmunol.1500653. - DOI - PMC - PubMed
    1. Durai V, Bagadia P, Granja JM, Satpathy AT, Kulkarni DH, Davidson JT, Wu R, Patel SJ, Iwata A, Liu TT, et al. Cryptic activation of an Irf8 enhancer governs cDC1 fate specification. Nat Immunol. 2019;20(9):1161–1173. doi: 10.1038/s41590-019-0450-x. - DOI - PMC - PubMed
    1. Bagadia P, Huang X, Liu TT, Durai V, Grajales-Reyes GE, Nitschké M, Modrusan Z, Granja JM, Satpathy AT, Briseño CG, Gargaro M, Iwata A, Kim S, Chang HY, Shaw AS, Murphy TL, Murphy KM. An Nfil3-Zeb2-Id2 pathway imposes Irf8 enhancer switching during cDC1 development. Nat Immunol. 2019;20(9):1174–1185. doi: 10.1038/s41590-019-0449-3. - DOI - PMC - PubMed

Publication types

Substances