Plasma neurofilament light and phosphorylated tau 181 as biomarkers of Alzheimer's disease pathology and clinical disease progression
- PMID: 33766131
- PMCID: PMC7995778
- DOI: 10.1186/s13195-021-00805-8
Plasma neurofilament light and phosphorylated tau 181 as biomarkers of Alzheimer's disease pathology and clinical disease progression
Abstract
Background: To assess the performance of plasma neurofilament light (NfL) and phosphorylated tau 181 (p-tau181) to inform about cerebral Alzheimer's disease (AD) pathology and predict clinical progression in a memory clinic setting.
Methods: Plasma NfL and p-tau181, along with established cerebrospinal fluid (CSF) biomarkers of AD pathology, were measured in participants with normal cognition (CN) and memory clinic patients with cognitive impairment (mild cognitive impairment and dementia, CI). Clinical and neuropsychological assessments were performed at inclusion and follow-up visits at 18 and 36 months. Multivariate analysis assessed associations of plasma NfL and p-tau181 levels with AD, single CSF biomarkers, hippocampal volume, and clinical measures of disease progression.
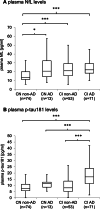
Results: Plasma NfL levels were higher in CN participants with an AD CSF profile (defined by a CSF p-tau181/Aβ1-42 > 0.0779) as compared with CN non-AD, while p-tau181 plasma levels were higher in CI patients with AD. Plasma NfL levels correlated with CSF tau and p-tau181 in CN, and with CSF tau in CI patients. Plasma p-tau181 correlated with CSF p-tau181 in CN and with CSF tau, p-tau181, Aβ1-42, and Aβ1-42/Aβ1-40 in CI participants. Compared with a reference model, adding plasma p-tau181 improved the prediction of AD in CI patients while adding NfL did not. Adding p-tau181, but not NfL levels, to a reference model improved prediction of cognitive decline in CI participants.
Conclusion: Plasma NfL indicates neurodegeneration while plasma p-tau181 levels can serve as a biomarker of cerebral AD pathology and cognitive decline. Their predictive performance depends on the presence of cognitive impairment.
Keywords: Alzheimer’s; Biomarkers; Neurofilament light; Plasma; p-tau181.
Conflict of interest statement
PL received consultation and/or lecture honoraria from IBL International, Fujirebio Europe, AJ Roboscreen, and Roche. KB has served as a consultant, at advisory boards, or at data monitoring committees for Abcam, Axon, Biogen, JOMDD/Shimadzu. Julius Clinical, Lilly, MagQu, Novartis, Roche Diagnostics, and Siemens Healthineers, and is a co-founder of Brain Biomarker Solutions in Gothenburg AB (BBS), which is a part of the GU Ventures Incubator Program. HZ has served at scientific advisory boards for Denali, Roche Diagnostics, Wave, Samumed, Siemens Healthineers, Pinteon Therapeutics and CogRx, has given lectures in symposia sponsored by Fujirebio, Alzecure and Biogen, and is a co-founder of Brain Biomarker Solutions in Gothenburg AB (BBS), which is a part of the GU Ventures Incubator Program (outside submitted work). JR owns shares in Siemens healthcare. JP received consultation and speaker honoraria from Nestle Institute of Health Sciences, Innovation Campus, EPFL, Lausanne, Switzerland, Ono Pharma, OM Pharma Suisse and from Fujirebio Europe. The other authors declare no potential conflicts of interest.
Figures


Similar articles
-
Plasma Aβ42/40 ratio, p-tau181, GFAP, and NfL across the Alzheimer's disease continuum: A cross-sectional and longitudinal study in the AIBL cohort.Alzheimers Dement. 2023 Apr;19(4):1117-1134. doi: 10.1002/alz.12724. Epub 2022 Jul 21. Alzheimers Dement. 2023. PMID: 36574591
-
Future perspective and clinical applicability of the combined use of plasma phosphorylated tau 181 and neurofilament light chain in Subjective Cognitive Decline and Mild Cognitive Impairment.Sci Rep. 2024 May 17;14(1):11307. doi: 10.1038/s41598-024-61655-6. Sci Rep. 2024. PMID: 38760423 Free PMC article.
-
Longitudinal Associations of Blood Phosphorylated Tau181 and Neurofilament Light Chain With Neurodegeneration in Alzheimer Disease.JAMA Neurol. 2021 Apr 1;78(4):396-406. doi: 10.1001/jamaneurol.2020.4986. JAMA Neurol. 2021. PMID: 33427873 Free PMC article.
-
The Associations of Phosphorylated Tau 181 and Tau 231 Levels in Plasma and Cerebrospinal Fluid with Cognitive Function in Alzheimer's Disease: A Systematic Review and Meta-Analysis.J Alzheimers Dis. 2024;98(1):13-32. doi: 10.3233/JAD-230799. J Alzheimers Dis. 2024. PMID: 38339929
-
Predictive Accuracy of Blood-Derived Biomarkers for Amyloid-β Brain Deposition Along with the Alzheimer's Disease Continuum: A Systematic Review.J Alzheimers Dis. 2021;84(1):393-407. doi: 10.3233/JAD-210496. J Alzheimers Dis. 2021. PMID: 34542072
Cited by
-
Modulating heart rate oscillation affects plasma amyloid beta and tau levels in younger and older adults.Sci Rep. 2023 Mar 9;13(1):3967. doi: 10.1038/s41598-023-30167-0. Sci Rep. 2023. PMID: 36894565 Free PMC article.
-
A Peek into Pandora's Box: COVID-19 and Neurodegeneration.Brain Sci. 2022 Jan 30;12(2):190. doi: 10.3390/brainsci12020190. Brain Sci. 2022. PMID: 35203953 Free PMC article. Review.
-
All the Tau We Cannot See.Annu Rev Med. 2023 Jan 27;74:503-514. doi: 10.1146/annurev-med-042921-023749. Epub 2022 Nov 15. Annu Rev Med. 2023. PMID: 36378913 Free PMC article. Review.
-
Annexin A6 membrane repair protein protects against amyloid-induced dystrophic neurites and tau phosphorylation in Alzheimer's disease model mice.Acta Neuropathol. 2025 May 24;149(1):51. doi: 10.1007/s00401-025-02888-1. Acta Neuropathol. 2025. PMID: 40411591 Free PMC article.
-
The Role of Glial Fibrillary Acidic Protein in the Neuropathology of Alzheimer's Disease and Its Potential as a Blood Biomarker for Early Diagnosis and Progression.Mol Neurobiol. 2025 Jul 21. doi: 10.1007/s12035-025-05219-3. Online ahead of print. Mol Neurobiol. 2025. PMID: 40690136 Review.
References
-
- Molinuevo JL, Ayton S, Batrla R, Bednar MM, Bittner T, Cummings J, Fagan AM, Hampel H, Mielke MM, Mikulskis A, O’Bryant S, Scheltens P, Sevigny J, Shaw LM, Soares HD, Tong G, Trojanowski JQ, Zetterberg H, Blennow K. Current state of Alzheimer’s fluid biomarkers. Acta Neuropathol. 2018;136(6):821–853. doi: 10.1007/s00401-018-1932-x. - DOI - PMC - PubMed
-
- Lewczuk P, Ermann N, Andreasson U, Schultheis C, Podhorna J, Spitzer P, Maler JM, Kornhuber J, Blennow K, Zetterberg H. Plasma neurofilament light as a potential biomarker of neurodegeneration in Alzheimer’s disease. Alzheimers Res Ther. 2018;10(1):71. doi: 10.1186/s13195-018-0404-9. - DOI - PMC - PubMed
Publication types
MeSH terms
Substances
LinkOut - more resources
Full Text Sources
Other Literature Sources
Medical

