

Myocardial T1 and T2 Mapping by Magnetic Resonance in Patients With Immune Checkpoint Inhibitor-Associated Myocarditis
- PMID: 33766256
- PMCID: PMC8442989
- DOI: 10.1016/j.jacc.2021.01.050
Myocardial T1 and T2 Mapping by Magnetic Resonance in Patients With Immune Checkpoint Inhibitor-Associated Myocarditis
Abstract
Background: Myocarditis is a potentially fatal complication of immune checkpoint inhibitor (ICI) therapy. Data on the utility of cardiovascular magnetic resonance (CMR) T1 and T2 mapping in ICI myocarditis are limited.
Objectives: This study sought to assess the value of CMR T1 and T2 mapping in patients with ICI myocarditis.
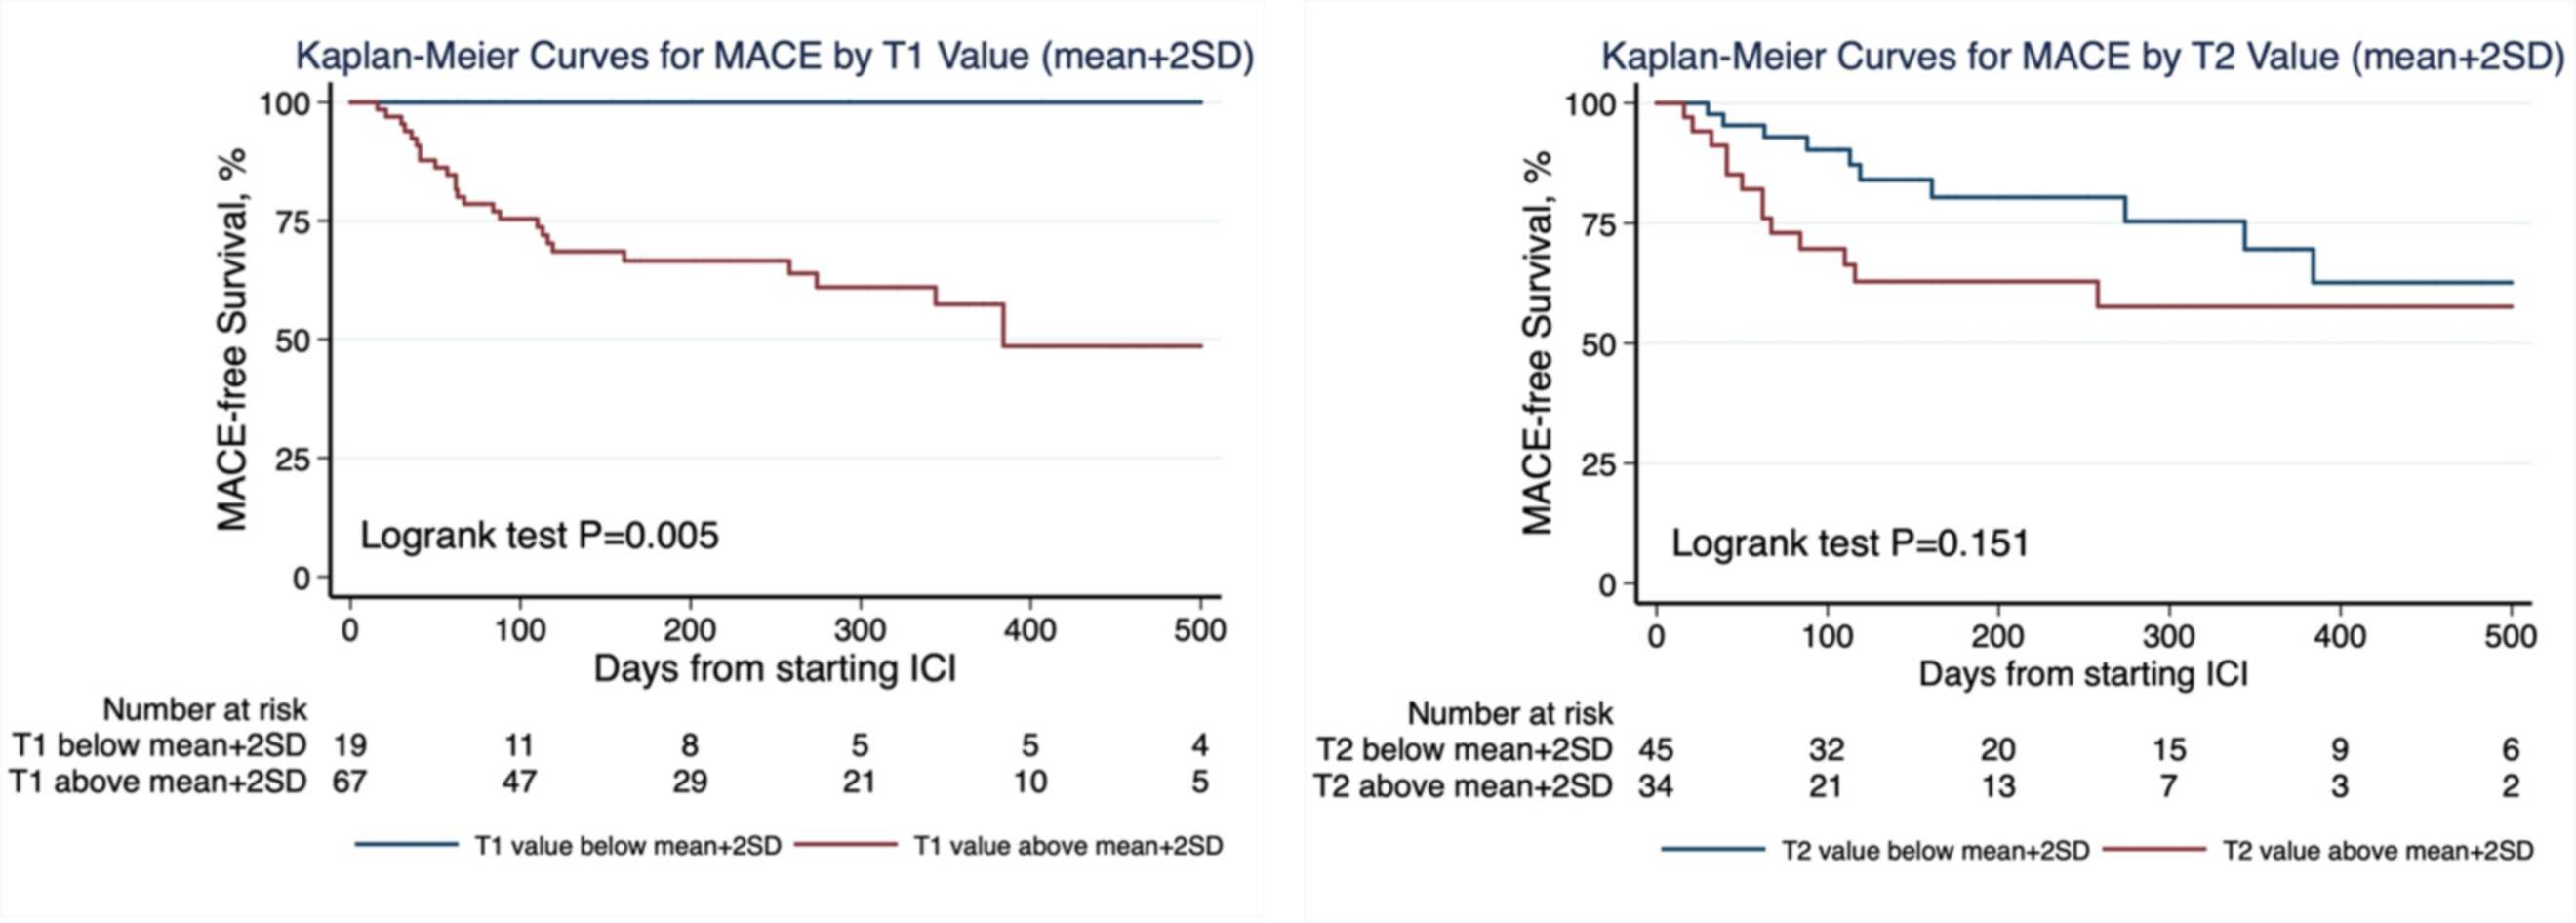
Methods: In this retrospective study from an international registry of patients with ICI myocarditis, clinical and CMR findings (including T1 and T2 maps) were collected. Abnormal T1 and T2 were defined as 2 SD above site (vendor/field strength specific) reference values and a z-score was calculated for each patient. Major adverse cardiovascular events (MACE) were a composite of cardiovascular death, cardiogenic shock, cardiac arrest, and complete heart block.
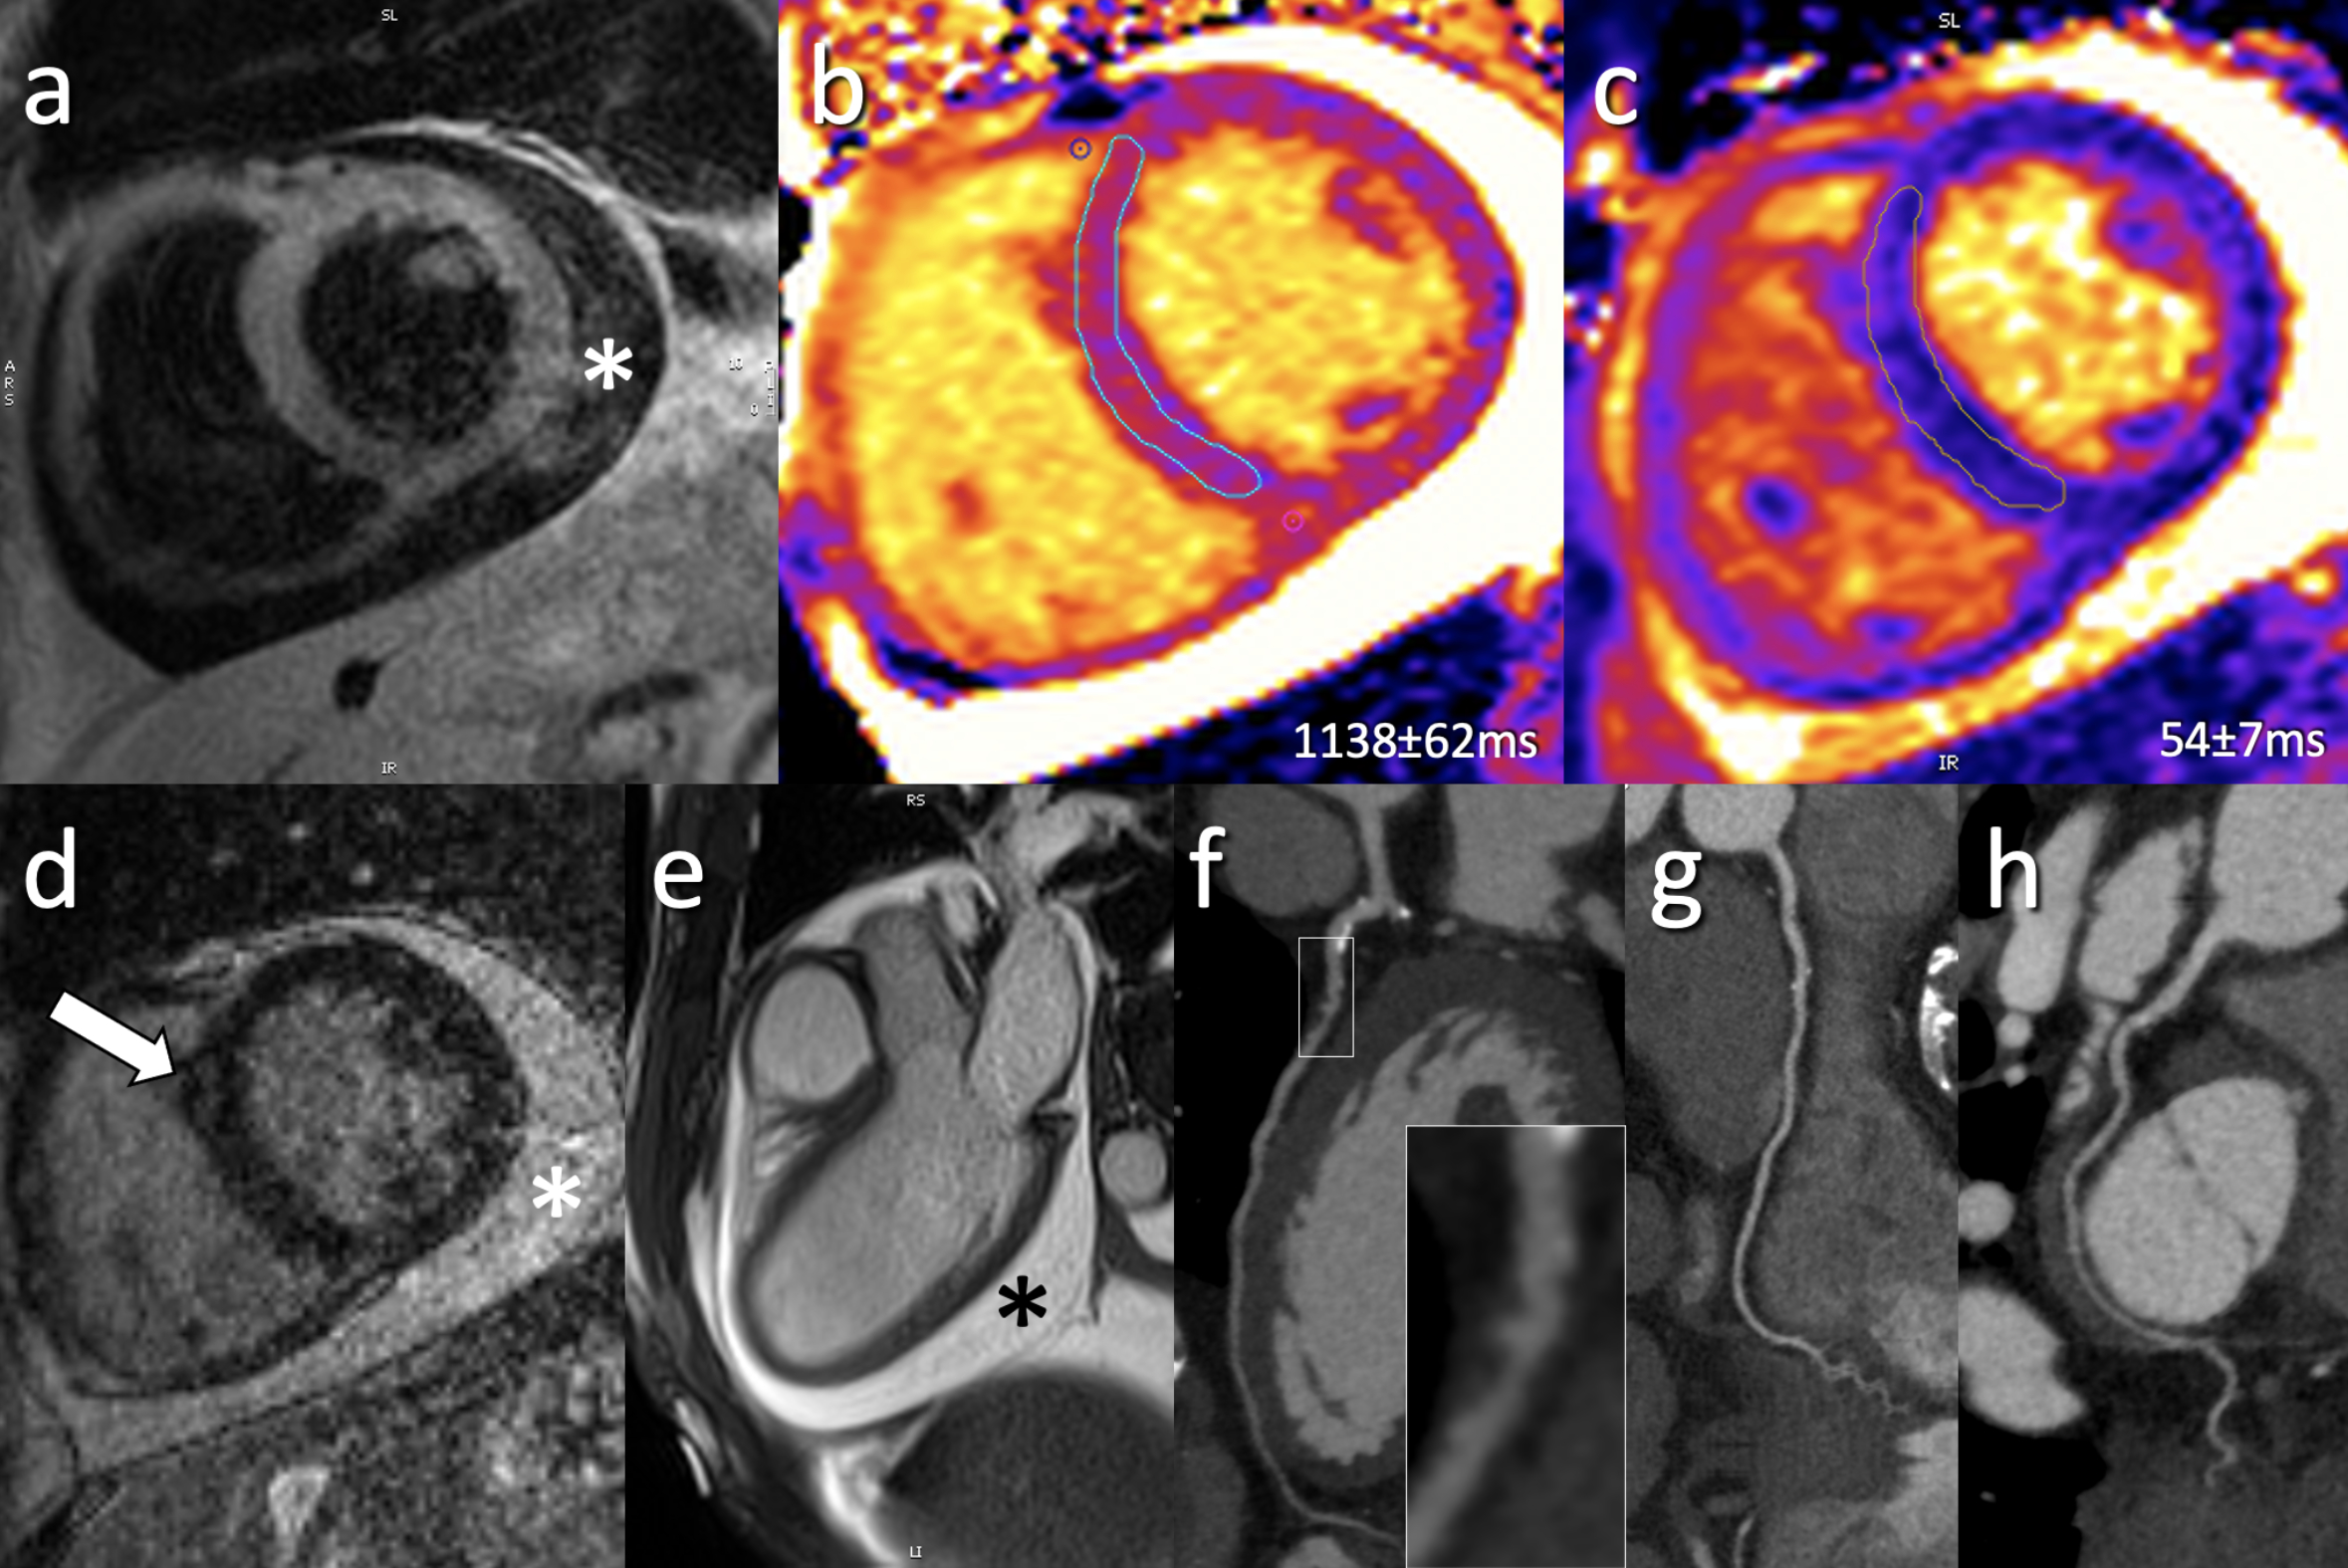
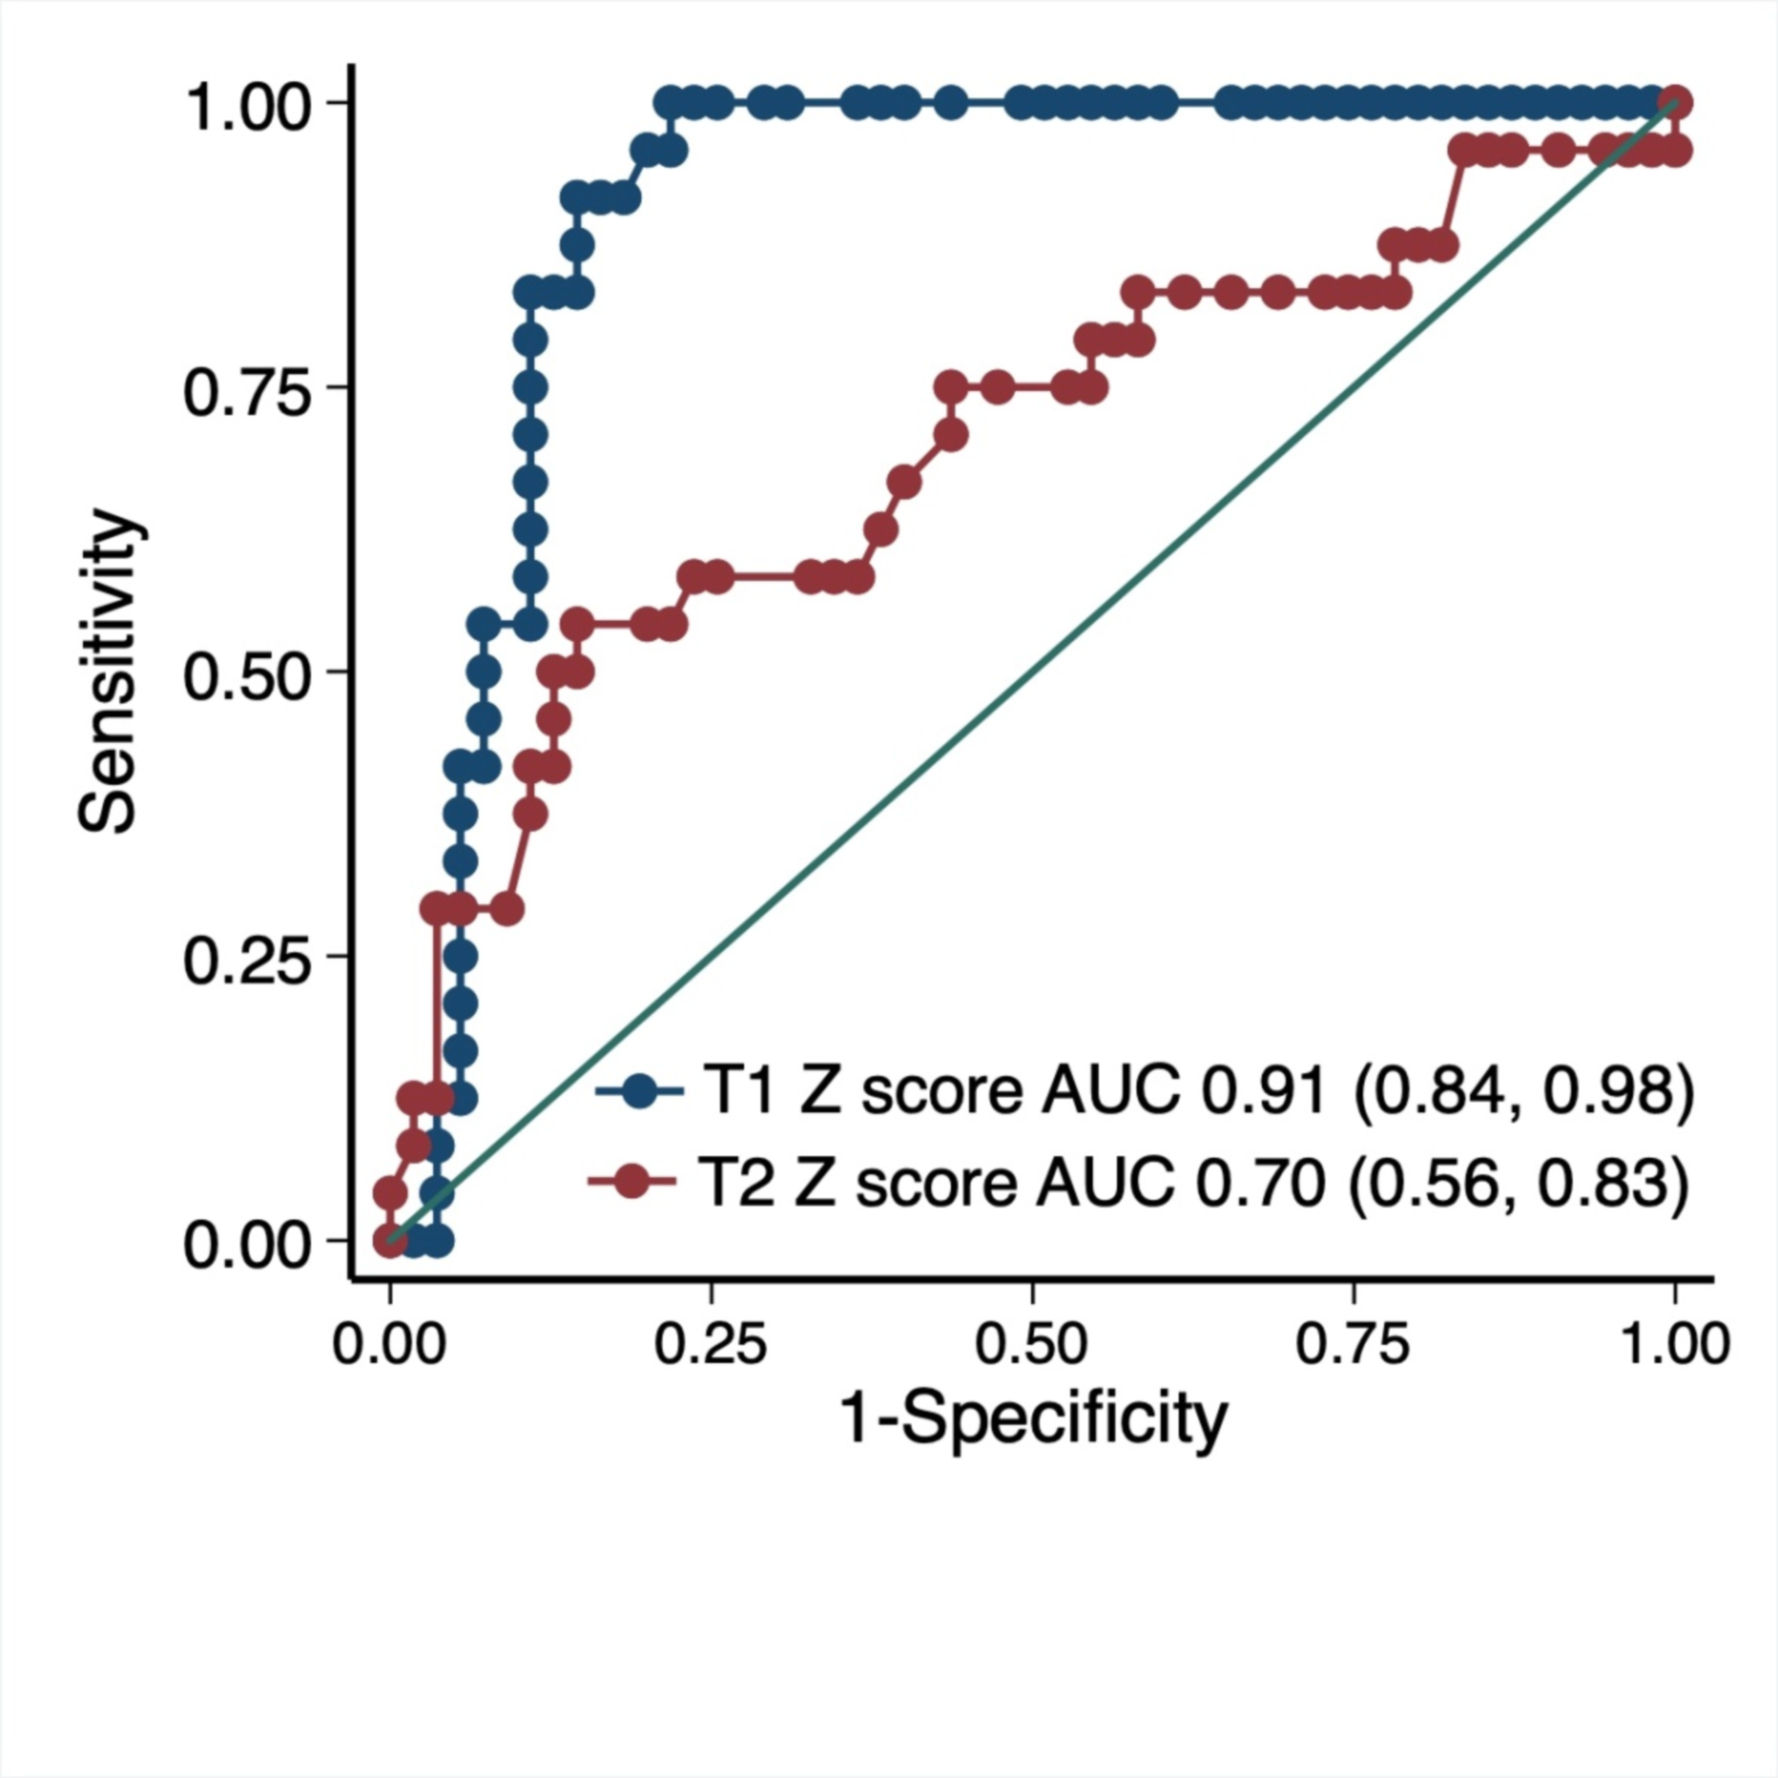
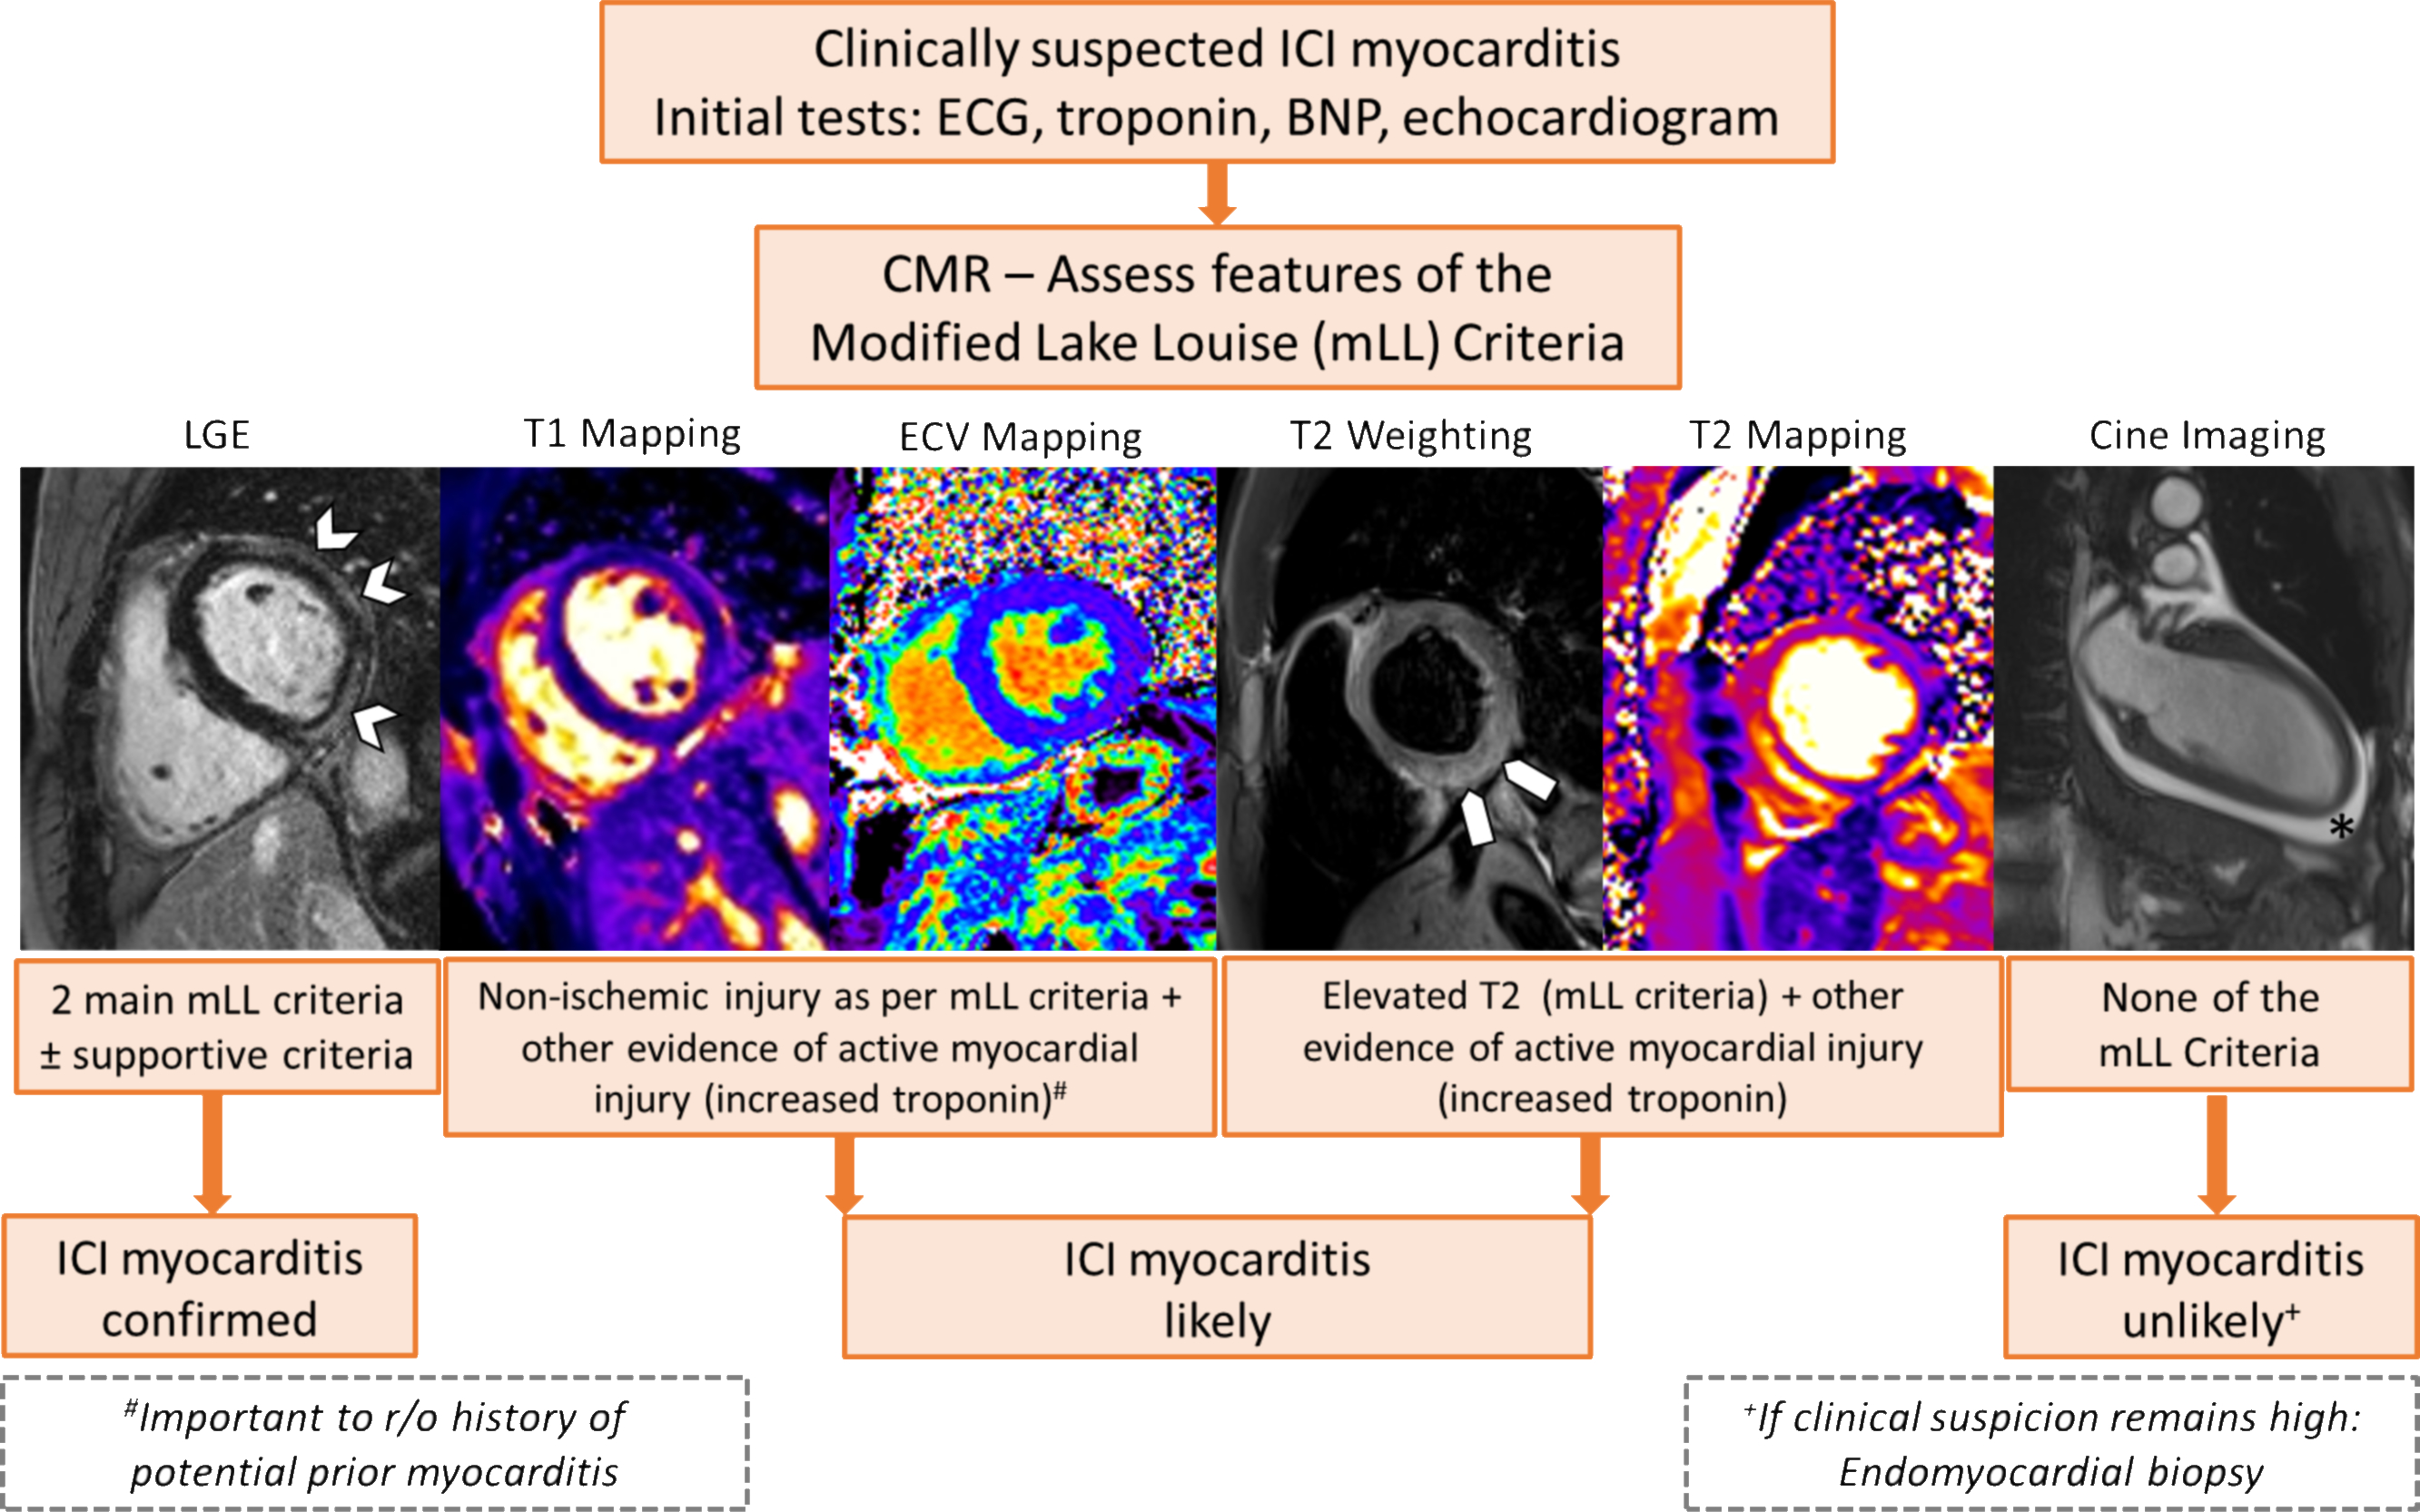
Results: Of 136 patients with ICI myocarditis with a CMR, 86 (63%) had T1 maps and 79 (58%) also had T2 maps. Among the 86 patients (66.3 ± 13.1 years of age), 36 (41.9%) had a left ventricular ejection fraction <55%. Across all patients, mean z-scores for T1 and T2 values were 2.9 ± 1.9 (p < 0.001) and 2.2 ± 2.1 (p < 0.001), respectively. On Siemens 1.5-T scanner (n = 67), native T1 (1,079.0 ± 55.5 ms vs. 1,000.3 ± 22.1 ms; p < 0.001) and T2 (56.2 ± 4.9 ms vs. 49.8 ± 2.2 ms; p < 0.001) values were elevated compared with reference values. Abnormal T1 and T2 values were seen in 78% and 43% of the patients, respectively. Applying the modified Lake Louise Criteria, 95% met the nonischemic myocardial injury criteria and 53% met the myocardial edema criteria. Native T1 values had excellent discriminatory value for subsequent MACE, with an area under the curve of 0.91 (95% confidence interval: 0.84 to 0.98). Native T1 values (for every 1-unit increase in z-score, hazard ratio: 1.44; 95% confidence interval: 1.12 to 1.84; p = 0.004) but not T2 values were independently associated with subsequent MACE.
Conclusions: The use of T1 mapping and application of the modified Lake Louise Criteria provides important diagnostic value, and T1 mapping provides prognostic value in patients with ICI myocarditis.
Keywords: Lake Louise Criteria; T1 mapping; T2 mapping; cardiovascular magnetic resonance; immune checkpoint inhibitor; major adverse cardiovascular event; myocarditis.
Copyright © 2021 American College of Cardiology Foundation. Published by Elsevier Inc. All rights reserved.
Conflict of interest statement
Funding Support and Author Disclosures Dr. Thavendiranathan was supported, in part, through the Canadian Institutes of Health Research New Investigator Award (FRN 147814) and a Canada Research Chair in Cardio-Oncology. This work is supported by the New York Academy of Medicine's Glorney-Raisbeck Award to Dr. Mahmood. Dr. Sullivan was supported, in part, through the National Institutes of Health (NIH)/National Cancer Institute (RO1CA229851, UH2CA207355, RO1CA193970). Dr. C.L. Chen, and Dr. D. Gupta were supported, in part, through the NIH/National Cancer Institute P30CA008748. Dr. Neilan was supported, in part, through the Kohlberg Foundation, the NIH/National Heart, Lung, and Blood Institute (RO1HL130539, RO1HL137562, and K24HL150238), and the NIH/Harvard Center for AIDS Research (P30 AI060354). Dr. Thavendiranathan has received Speakers Bureau fees from Amgen, Takeda, and BI. Dr. Mahmood has received consulting fees from OMR Globus, Alpha Detail, and Opinion Research Team. Dr. Nohria has received research grant support from Amgen; and has served a consultant for Takeda Oncology. Dr. Heinzerling has received consulting, advisory board, and speaker fees from MSD, BMS, Roche, Novartis, Amgen, and Curevac. Dr. Sullivan has served as a consultant for Merck and Novartis. Dr. Groarke has received research support from Amgen. Dr. Neilan has received advisory fees from Parexel, BMS, H3 Biomedicine, AbbVie, and Intrinsic Imaging. Dr. Neilan has received grant support from AstraZeneca. Dr. Wintersperger has received research support and speaker honoraria from Siemens Healthineers (the University Health Network has a master research agreement with Siemens Healthineers); and is an inventor of the IG fitting method owned by the University Health Network (US10314548B2). Dr. Yang has received research funding from CSL Behring. All other authors have reported that they have no relationships relevant to the contents of this paper to disclose.
Figures
Comment in
-
CMR Parametric Mapping in Immune Checkpoint Inhibitor Myocarditis: Novel Noninvasive Tools in a Lethal Condition.J Am Coll Cardiol. 2021 Mar 30;77(12):1517-1519. doi: 10.1016/j.jacc.2021.01.043. J Am Coll Cardiol. 2021. PMID: 33766257 No abstract available.
-
Imaging Edema in Immune Checkpoint Inhibitor Myocarditis: A Moving Target.J Am Coll Cardiol. 2021 Jul 27;78(4):416-417. doi: 10.1016/j.jacc.2021.04.095. J Am Coll Cardiol. 2021. PMID: 34294276 No abstract available.
-
Reply: Imaging Edema in Immune Checkpoint Inhibitor Myocarditis: A Moving Target.J Am Coll Cardiol. 2021 Jul 27;78(4):417-418. doi: 10.1016/j.jacc.2021.05.019. J Am Coll Cardiol. 2021. PMID: 34294277 No abstract available.
References
-
- Lyon AR, Yousaf N, Battisti NML, Moslehi J, Larkin J. Immune checkpoint inhibitors and cardiovascular toxicity. The lancet oncology 2018;19:e447–e458. - PubMed
-
- Biesbroek PS, Hirsch A, Zweerink A et al. Additional diagnostic value of CMR to the European Society of Cardiology (ESC) position statement criteria in a large clinical population of patients with suspected myocarditis. European heart journal cardiovascular Imaging 2018;19:1397–1407. - PubMed
Publication types
MeSH terms
Substances
Grants and funding
LinkOut - more resources
Full Text Sources
Other Literature Sources
Medical
Miscellaneous
