. 2021 Jan-Jun:296:100577.
doi: 10.1016/j.jbc.2021.100577. Epub 2021 Mar 23.

Calmodulin influences MAPK signaling by binding KSR1

Affiliations

Calmodulin influences MAPK signaling by binding KSR1

Swetha Parvathaneni et al. J Biol Chem. 2021 Jan-Jun.

Abstract

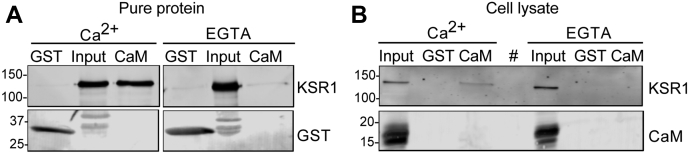
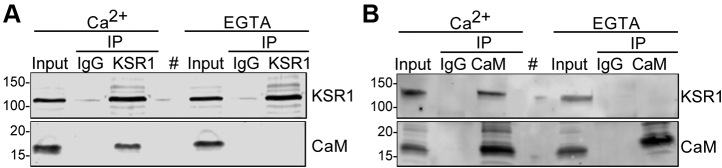
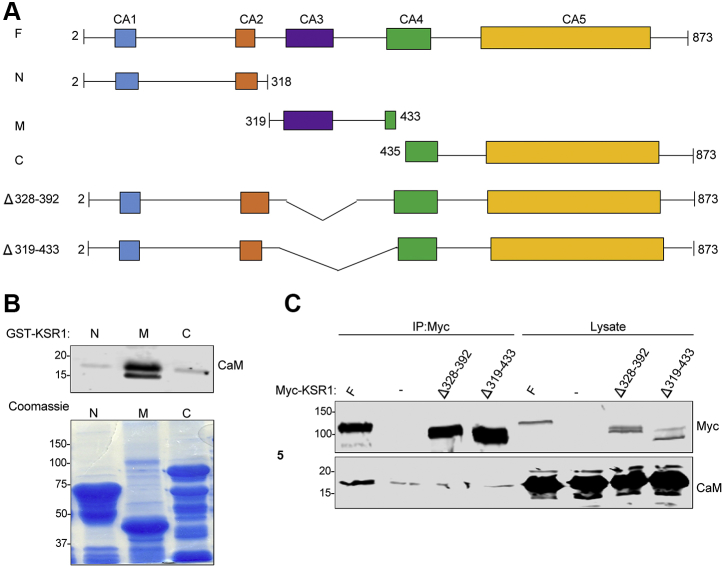
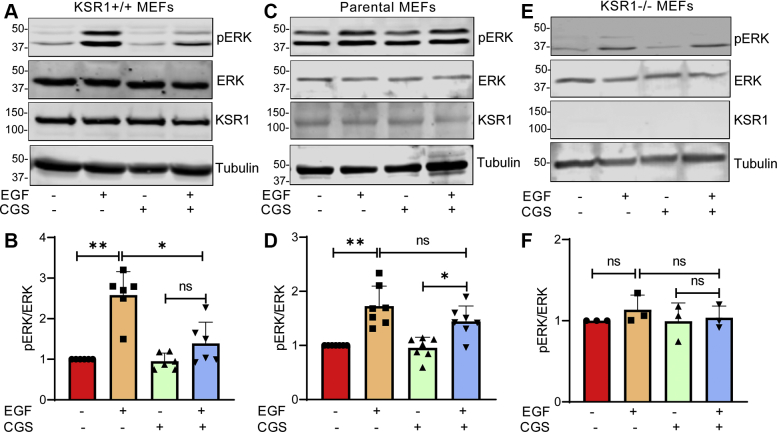
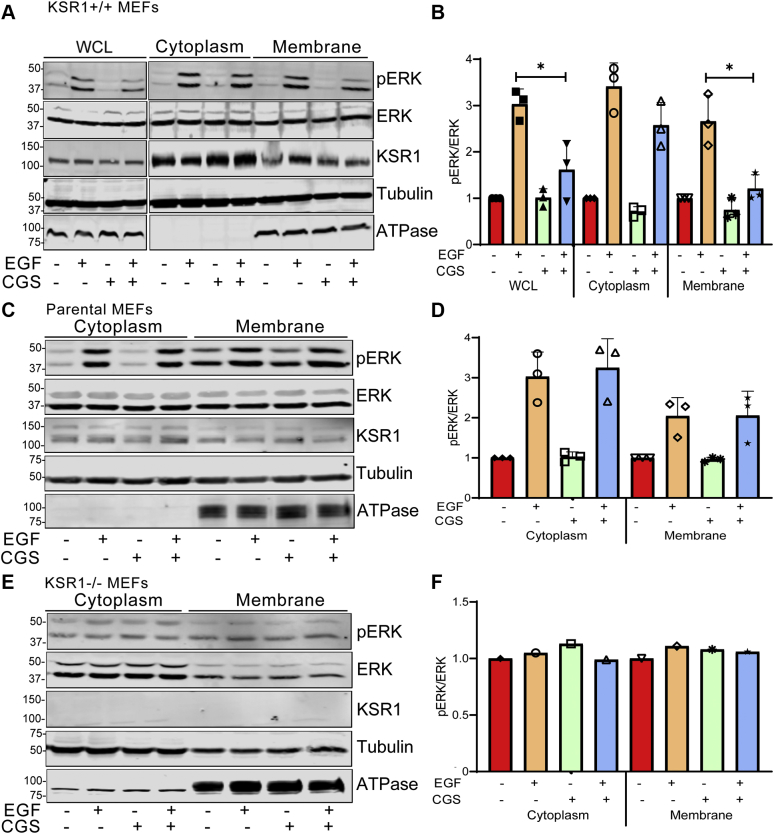
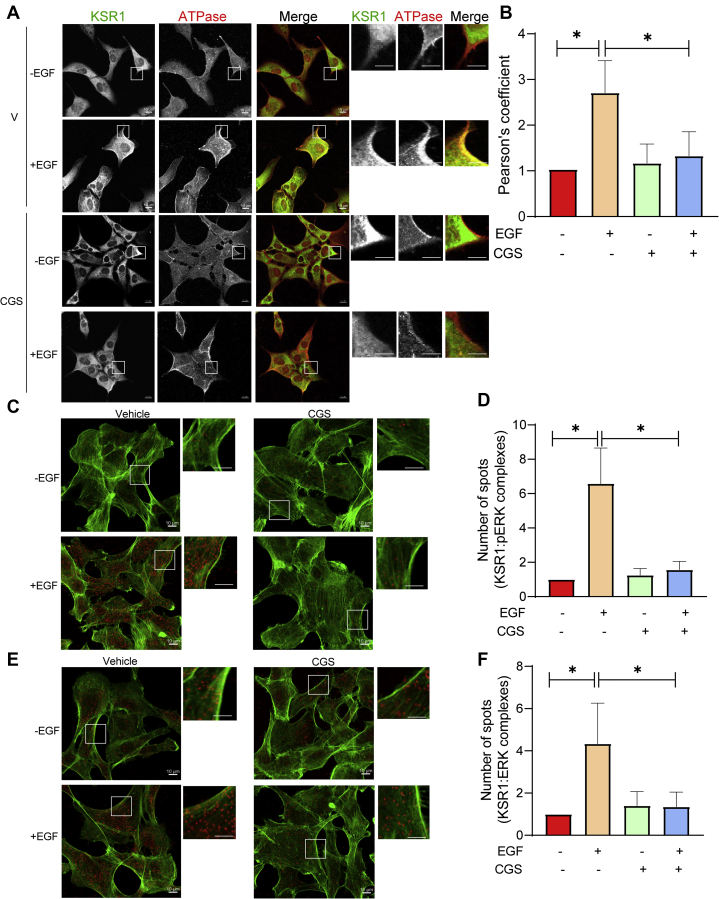
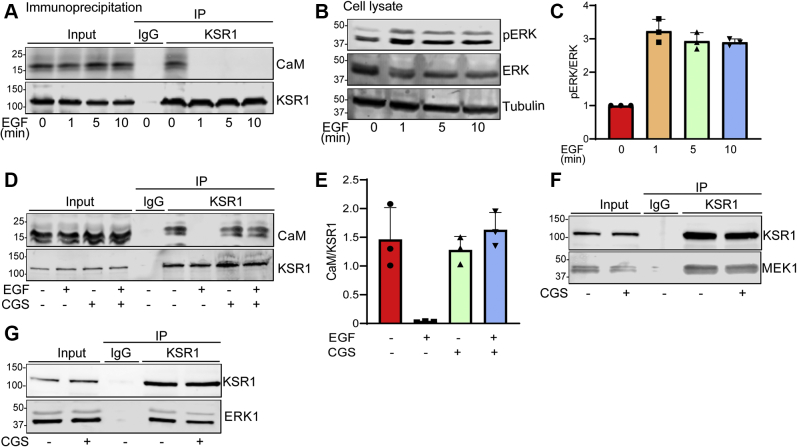
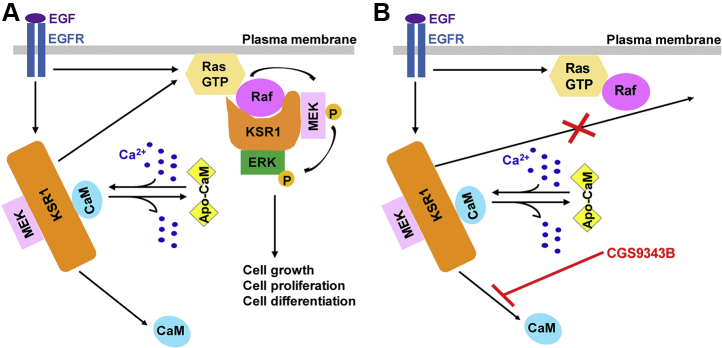
The mitogen-activated protein kinase (MAPK) cascade is a fundamental signaling pathway that regulates cell fate decisions in response to external stimuli. Several scaffold proteins bind directly to kinase components of this pathway and regulate their activation by growth factors. One of the best studied MAPK scaffolds is kinase suppressor of Ras1 (KSR1), which is induced by epidermal growth factor (EGF) to translocate to the plasma membrane where it activates extracellular signal-regulated kinase (ERK). While Ca2+ has been shown to modulate MAPK signaling, the molecular mechanisms by which this occurs are incompletely understood. Here we tested the hypothesis that Ca2+ alters MAPK activity at least in part via KSR1. Using several approaches, including fusion proteins, immunoprecipitation, confocal microscopy, and a cell-permeable chemical inhibitor, we investigated the functional interaction between KSR1 and calmodulin. In vitro analysis with pure proteins reveals that calmodulin binds directly to KSR1. Moreover, endogenous calmodulin and KSR1 co-immunoprecipitate from mammalian cell lysates. Importantly, Ca2+ is required for the association between calmodulin and KSR1, both in vitro and in cells. The cell-permeable calmodulin antagonist CGS9343B significantly reduced activation of ERK by EGF in mouse embryo fibroblasts that overexpress KSR1, but not in control cells. Moreover, CGS9343B impaired the ability of EGF to induce KSR1 translocation to the plasma membrane and to stimulate formation of KSR1-ERK and KSR1-pERK (phosphorylated ERK) complexes in cells. Collectively, our data identify a previously unrecognized mechanism by which the scaffold protein KSR1 couples Ca2+ and calmodulin signaling to the MAPK cascade.

Keywords: calcium; calmodulin; kinase suppressor of Ras1 (KSR1); mitogen-activated protein kinase (MAPK); protein–protein interaction; signaling.


Conflict of interest statement

Conflict of interest The authors declare that they have no conflicts of interest with the contents of this article.

Figures

Figure 1
Figure 1
KSR1 binds directly to calmodulin in a Ca2+-regulated manner.A, GST-Sepharose (GST) or calmodulin-Sepharose (CaM) was incubated with 500 ng of purified His-KSR1 in the presence of 1 mM Ca2+ or 1 mM EGTA. After washing the beads, attached proteins were resolved by SDS-PAGE and western blotting. Blots were probed with anti-KSR1 and anti-GST antibodies. Input is purified KSR1 not subjected to pull-down. The data are representative of two independent experiments. B, in total, 1 mg protein lysate prepared from KSR1+/+ MEFs in the presence of 1 mM Ca2+ or 1 mM EGTA was incubated with GST-Sepharose (GST) or calmodulin-Sepharose (CaM) beads. Samples were processed by SDS-PAGE and western blotting. Blots were probed with anti-KSR1 and anti-calmodulin (CaM) antibodies. Input is 20 μg lysate not subjected to pull-down. An empty lane is designated by (#). The data are representative of three independent experiments. The positions of migration of molecular mass markers are indicated on the left.
Figure 2
Figure 2
Calmodulin and KSR1 interact in cells.A, KSR1+/+ MEFs were lysed in buffer containing 1 mM Ca2+ or 1 mM EGTA and 1 mg of cell lysate was immunoprecipitated (IP) with anti-KSR1 antibody. A sample precipitated with mouse IgG was used as the negative control. Lysates not subjected to immunoprecipitation (Input) were processed in parallel. Samples were resolved by western blotting and probed with anti-KSR1 and anti-calmodulin (CaM) antibodies. An empty lane is designated by (#). The data are representative of three independent experiments. B, in total, 1 mg protein lysate from KSR1+/+ MEFs was immunoprecipitated with anti-calmodulin (CaM) antibody in the presence of Ca2+ or EGTA. A sample precipitated with mouse IgG was used as the negative control. Samples were processed as described for panel A. An empty lane is designated by (#). The data are representative of three independent experiments. The positions of migration of molecular mass markers are indicated on the left.
Figure 3
Figure 3
Identification of the calmodulin-binding region in KSR1.A, schematic representation of KSR1 constructs. KSR1 contains five distinct domains, termed conserved area 1 (CA1) through CA5. The KSR1 constructs are full-length (F, amino acids 2–873), N (2–318), M (319–433), and C (435–873). KSR1Δ328–392 has amino acids 328–392 deleted and KSR1Δ319–433 has amino acids 319 to 433 deleted. B, GST-tagged fragments of KSR1-N, -M or -C were incubated with purified calmodulin. Complexes were pulled down with glutathione-Sepharose beads and analyzed by SDS-PAGE. The gel was cut at ∼25 kDa. The lower portion of the gel was processed by western blotting and probed with anti-calmodulin (CaM) antibody. The upper portion of the gel was stained with Coomassie blue. Data are representative of two independent experiments. C, HEK293 cells were transfected with Myc-tagged KSR1 constructs (F, Δ328–392 or Δ319–433) or not transfected (−). Cells were lysed in buffer containing Ca2+ and complexes were immunoprecipitated (IP) with anti-Myc Affinity Gel. Samples were resolved by western blotting and probed with anti-Myc and anti-calmodulin antibodies. Lysates not subjected to immunoprecipitation were processed in parallel (Lysate). Data are representative of two independent experiments. The positions of migration of molecular mass markers are indicated on the left of the blots and gels.
Figure 4
Figure 4
Calmodulin influences EGF-induced activation of ERK. KSR1+/+ MEFs (panels A and B), parental MEFs (panels C and D), and KSR1-null MEFs (panels E and F) were cultured in serum-free medium. Vehicle (−) or 40 μM CGS9343B (+) was added for 16 h, followed by the addition of vehicle (−) or 100 ng/ml EGF (+) for 10 min. Cells were lysed, samples were resolved by western blotting, and blots were probed with antibodies to phosphorylated ERK (pERK), total ERK, KSR1, and β-tubulin. The data are representative of at least three independent experiments. B, D, and F, pERK and total ERK bands were quantified with Image Studio 2.0 (LI-COR Biosciences). Graphs depict the ratio of pERK to total ERK in the same sample, with vehicle-treated samples (no CGS9343B or EGF) set as 1.0. Data represent means ± SD of 3 to 7 experiments. ∗p < 0.001; ∗∗p < 0.0001 using one-way ANOVA, with Tukey’s post-hoc test. ns, not significant.
Figure 5
Figure 5
CGS9343B prevents EGF from activating ERK at the plasma membrane. Serum-starved KSR1+/+ MEFs (panels A and B), parental MEFs (C and D), and KSR1−/− MEFs (E and F) were pretreated with DMSO (−) or 40 μM CGS9343 (CGS, +) for 16 h, followed by incubation with vehicle (−) or 100 ng/ml EGF (+) for 5 min. Cell lysates were separated into cytoplasmic and membrane fractions as described under Experimental procedures. In total, 10 μl of whole-cell lysate (WCL; panel A, only), cytoplasmic and membrane fractions were resolved by SDS-PAGE and transferred to PVDF membranes. Blots were probed with anti-pERK, anti-ERK, anti-KSR1, anti-β-tubulin, and anti-Na+K+ ATPase antibodies. Na+K+ ATPase is the control for membrane fractions. Data in panels A and C are representative of three independent experiments and data in panel E are from a single experiment. B, D, and F, phosphorylation of ERK was quantified by densitometry using Image Studio 2.0 (LI-COR) and corrected for the amount of total ERK in the same sample. Data represent the means ± SD (panels B and D, n = 3 independent experiments) or a single value (panel F), with vehicle-treated cells set as 1.0. ∗p < 0.001 using one-way ANOVA, with Tukey’s post-hoc test.
Figure 6
Figure 6
Inhibiting calmodulin attenuates EGF-induced translocation of KSR1 to the plasma membrane and its association with ERK and pERK.A, serum-starved KSR1+/+ MEFs were pretreated with DMSO (V) or 40 μM CGS9343B (CGS). After 16 h, cells were incubated without (−) or with (+) 100 ng/ml EGF for 5 min. Cells were fixed, then probed with anti-KSR1 and anti-Na+K+ ATPase antibodies. Following incubation with the appropriate fluorescent-conjugated secondary antibodies, images were analyzed by Zeiss LSM780 confocal microscopy. The smaller panels on the right side are higher power magnifications of the areas encompassed by the white boxes on the images on the left. Merge is a composite of both channels; KSR1 is green, Na+K+ ATPase is red, and yellow indicates colocalization. Scale bars: full panels, 10 μm; insets, 3 μm. The data are representative of 50 cells for each condition. Negative controls showed no evidence of nonspecific staining or bleed-through. B, Pearson’s correlation coefficient was determined for colocalization of KSR1 and Na+K+ ATPase with Zen software. The data are expressed as means ± SD (n = 50 cells), with vehicle-treated cells set as 1. ∗p < 0.0001 using one-way ANOVA, with Tukey’s post-hoc test. C and E, KSR1+/+ MEFs were treated as described for panel A, then stained with both anti-KSR1 and anti-pERK (C) or anti-KSR1 and anti-ERK (E) antibodies. PLA was performed using Duolink detection reagents as described under Experimental procedures. Red spots indicate positive PLA. Actin was stained with Alexa Fluor 488 phalloidin (green). Representative images of 50 cells for each condition are shown. The smaller panels on the right side are higher power magnifications of the areas encompassed by the white boxes on the images on the left. Scale bar, full panels, 10 μm; insets, 3 μ. D and F, the number of PLA spots per cell was quantified with Image J software from confocal images of 50 cells for each condition. The data are expressed as means ± S.D. (error bars), with the number of spots in vehicle-treated cells set to 1. ∗p < 0.0001 by one-way ANOVA, with Tukey’s post-hoc test.
Figure 7
Figure 7
EGF modulates the interaction between KSR1 and calmodulin.A, KSR1+/+ MEFs were serum-starved for 16 h, followed by incubation with 100 ng/ml EGF for 0, 1, 5, or 10 min. Cells were lysed in buffer containing 1 mM Ca2+ and 1 mg protein lysate was immunoprecipitated with anti-KSR1 antibody. A sample precipitated with mouse IgG was processed in parallel as negative control. Both unprocessed lysate (Input) and immunoprecipitates (IP) were resolved by western blotting and blots were probed with anti-calmodulin (CaM) and anti-KSR1 antibodies. B, equal aliquots of protein from the cell lysates used for immunoprecipitation were resolved by western blotting and probed with antibodies to phosphorylated ERK (pERK), total ERK, and β-tubulin (loading control). C, pERK and total ERK bands were quantified with Image Studio 2.0 (LI-COR Biosciences). Graphs depict the ratio of pERK to total ERK in the same sample, with vehicle-treated samples set as 1.0. Data represent means ± SD of three independent experiments. D, serum-starved cells were incubated with vehicle (−) or 40 μM CGS9343B (CGS, +). After 16 h, DMSO (−) or 100 ng/ml EGF (+) was added for 10 min. Samples were processed as described for panel A. All images are representative of three independent experiments. E, the calmodulin and KSR1 bands were quantified with Image Studio 2.0 (LI-COR Biosciences). Graphs depict the ratio of calmodulin (CaM) to KSR1 in the same sample. Data represent means ± SD of three independent experiments. F, serum-starved KSR1+/+ MEFs were incubated with vehicle (−) or 40 μM CGS9343B (CGS, +) for 16 h. Cells were lysed and 1 mg protein lysate was immunoprecipitated with anti-KSR1 antibody. A sample precipitated with mouse IgG was processed in parallel as negative control. Both unprocessed lysate (Input) and immunoprecipitates (IP) were resolved by western blotting and blots were probed with anti-KSR1 and anti-MEK1 antibodies. G, cells were treated as described for panel F, except the blots were probed with anti-KSR1 and anti-ERK antibodies. All data are representative of three independent experiments.
Figure 8
Figure 8
Model depicting the interaction between Ca2+/calmodulin and KSR1 in MAPK signaling. A, Ca2+/calmodulin binds constitutively to KSR1. Stimulation of EGFR induces both the activation of Ras at the plasma membrane and dissociation of Ca2+/calmodulin from KSR1. The latter enables KSR1 to translocate to the plasma membrane where it scaffolds Raf/MEK/ERK, enabling ERK activation. B, the calmodulin antagonist CGS9343B prevents the dissociation of Ca2+/calmodulin from KSR1. The Ca2+/calmodulin-KSR1 complex is unable to move to the plasma membrane, attenuating MAPK activation. Other proteins that bind KSR1 are not included for clarity. CaM, calmodulin; EGFR, EGF receptor; P, phosphate.

References

    1. Lavoie H., Gagnon J., Therrien M. ERK signalling: A master regulator of cell behaviour, life and fate. Nat. Rev. Mol. Cell Biol. 2020;21:607–632. - PubMed
    1. Morrison D.K., Davis R.J. Regulation of MAP kinase signaling modules by scaffold proteins in mammals. Annu. Rev. Cell Dev. Biol. 2003;19:91–118. - PubMed
    1. Brown M.D., Sacks D.B. Protein scaffolds in MAP kinase signalling. Cell. Signal. 2009;21:462–469. - PMC - PubMed
    1. Kolch W. Coordinating ERK/MAPK signalling through scaffolds and inhibitors. Nat. Rev. Mol. Cell Biol. 2005;6:827–837. - PubMed
    1. Hao N., Nayak S., Behar M., Shanks R.H., Nagiec M.J., Errede B., Hasty J., Elston T.C., Dohlman H.G. Regulation of cell signaling dynamics by the protein kinase-scaffold Ste5. Mol. Cell. 2008;30:649–656. - PMC - PubMed

Publication types

LinkOut - more resources