. 2021 Mar 25;6(57):eabg5413.
doi: 10.1126/sciimmunol.abg5413.

Cytomegaloviral determinants of CD8+ T cell programming and RhCMV/SIV vaccine efficacy

Affiliations

Cytomegaloviral determinants of CD8+ T cell programming and RhCMV/SIV vaccine efficacy

Daniel Malouli et al. Sci Immunol. .

Abstract

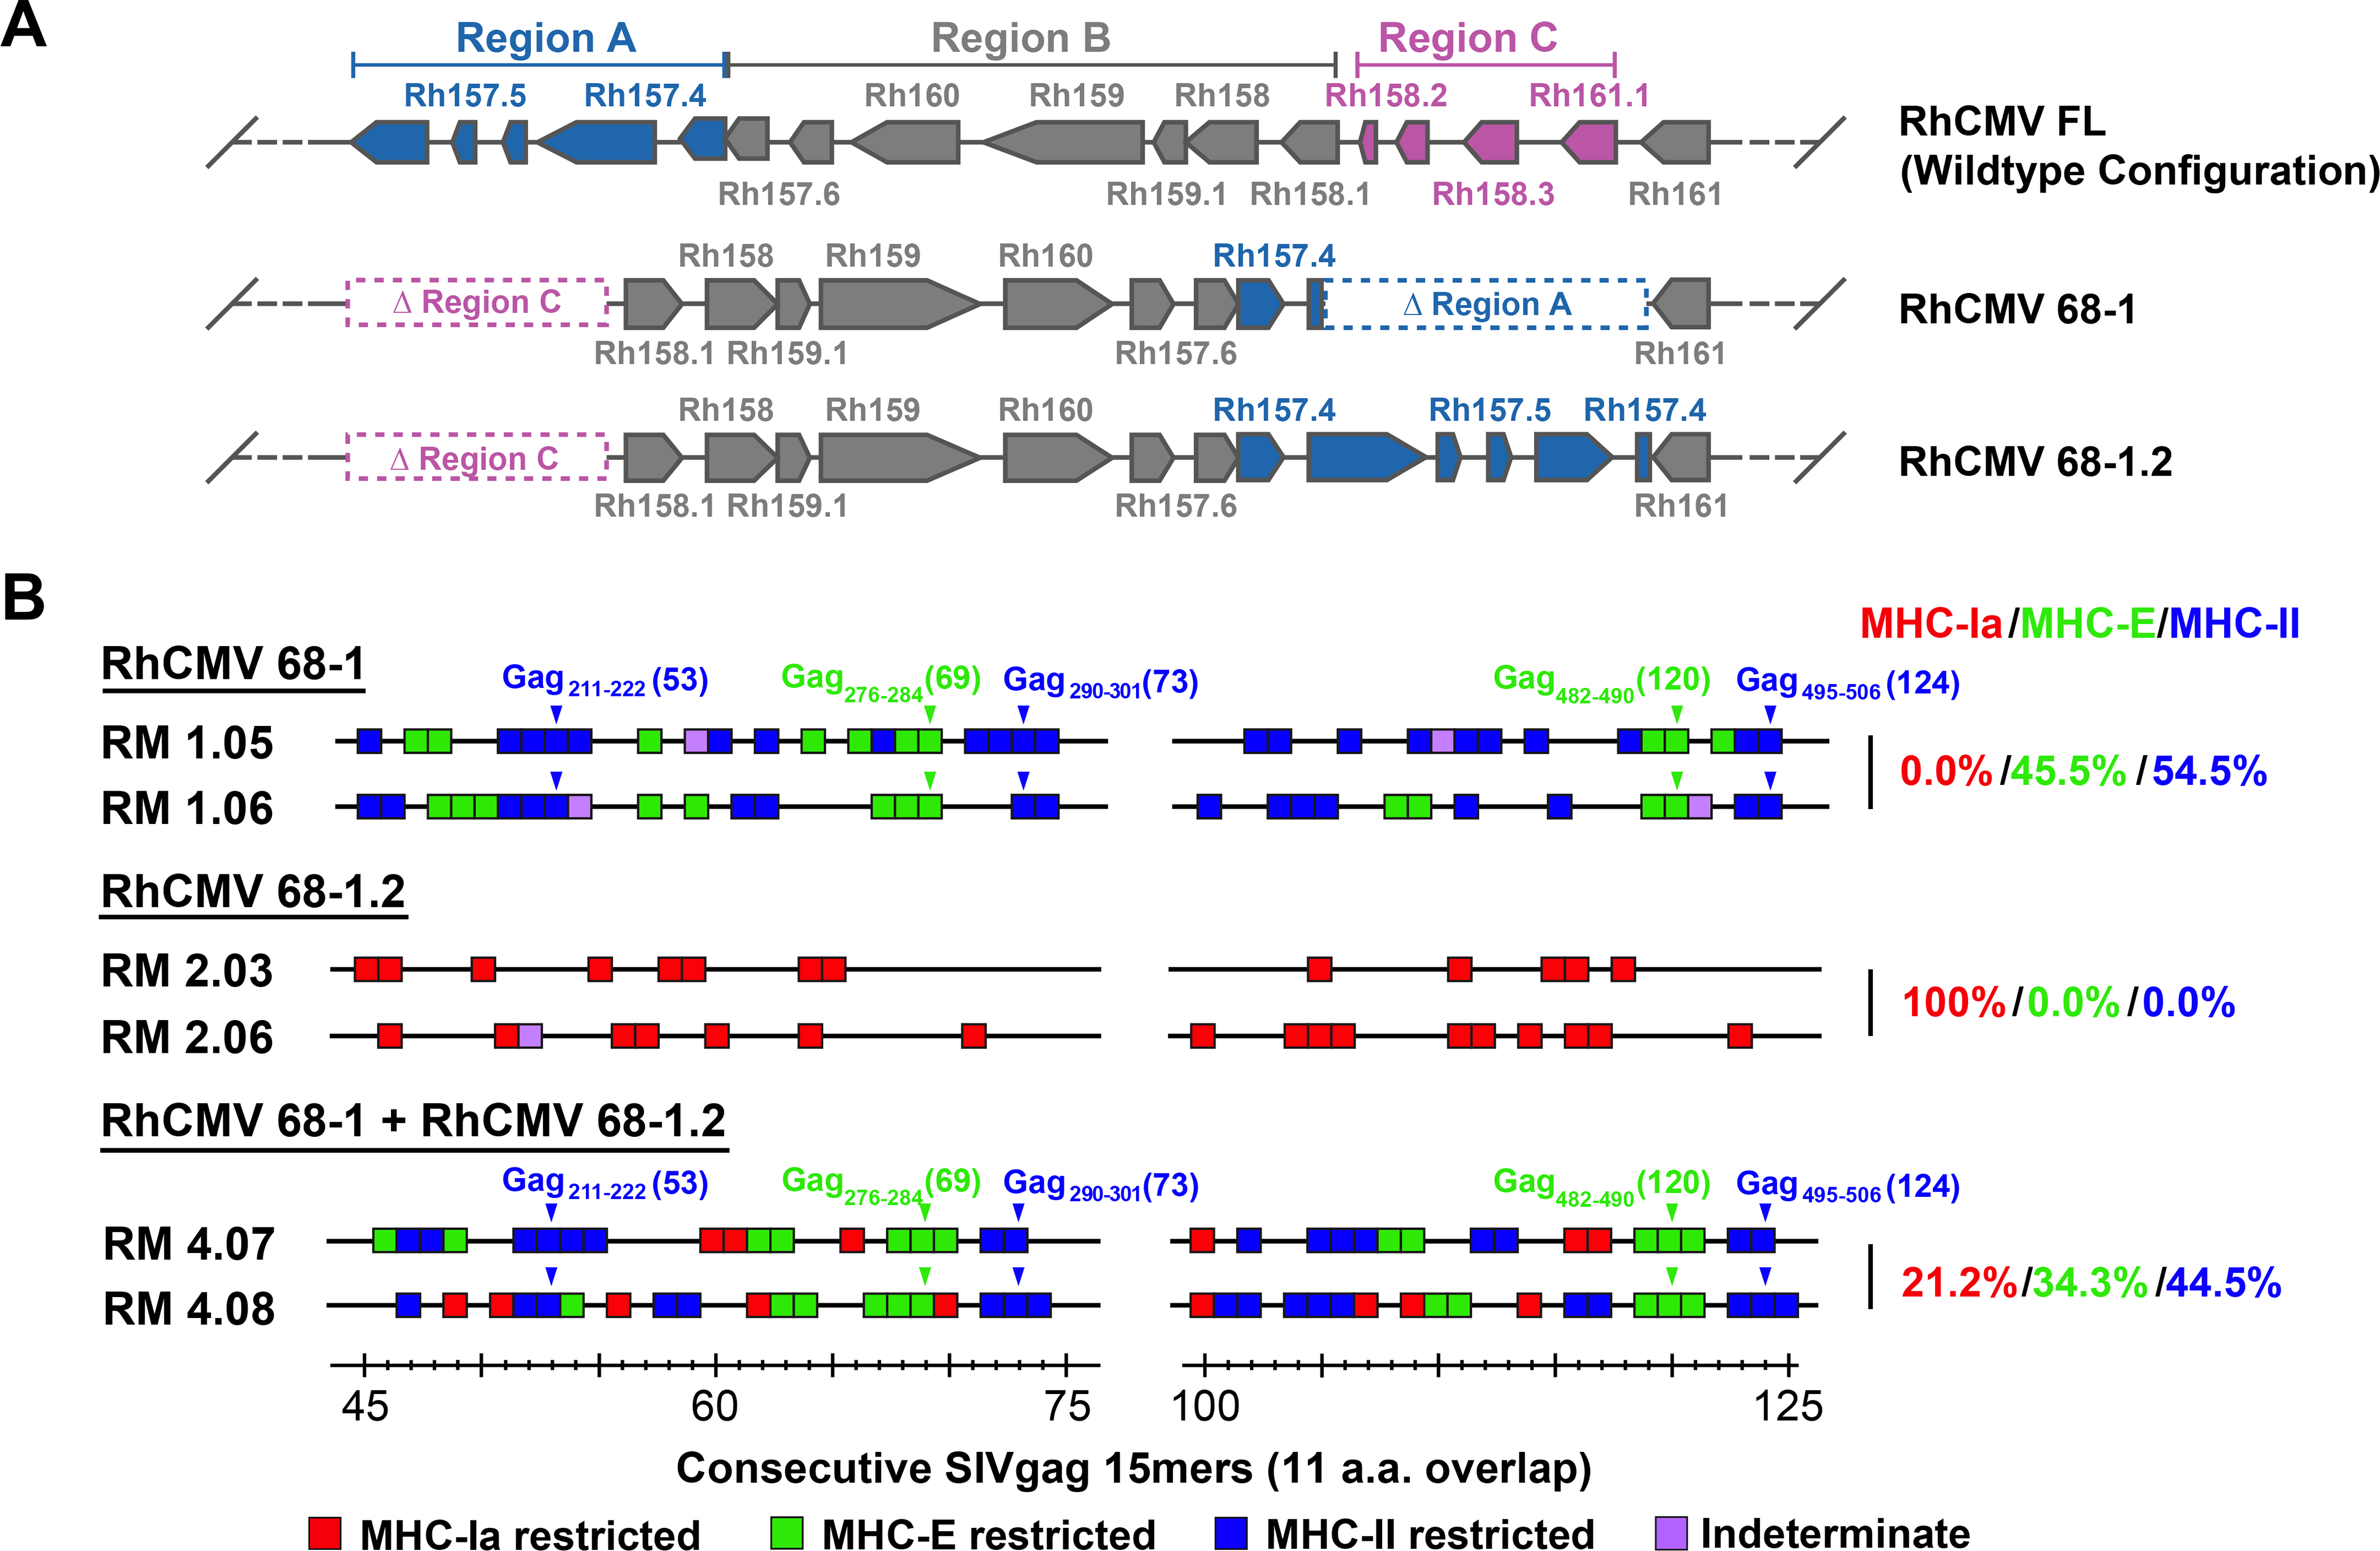
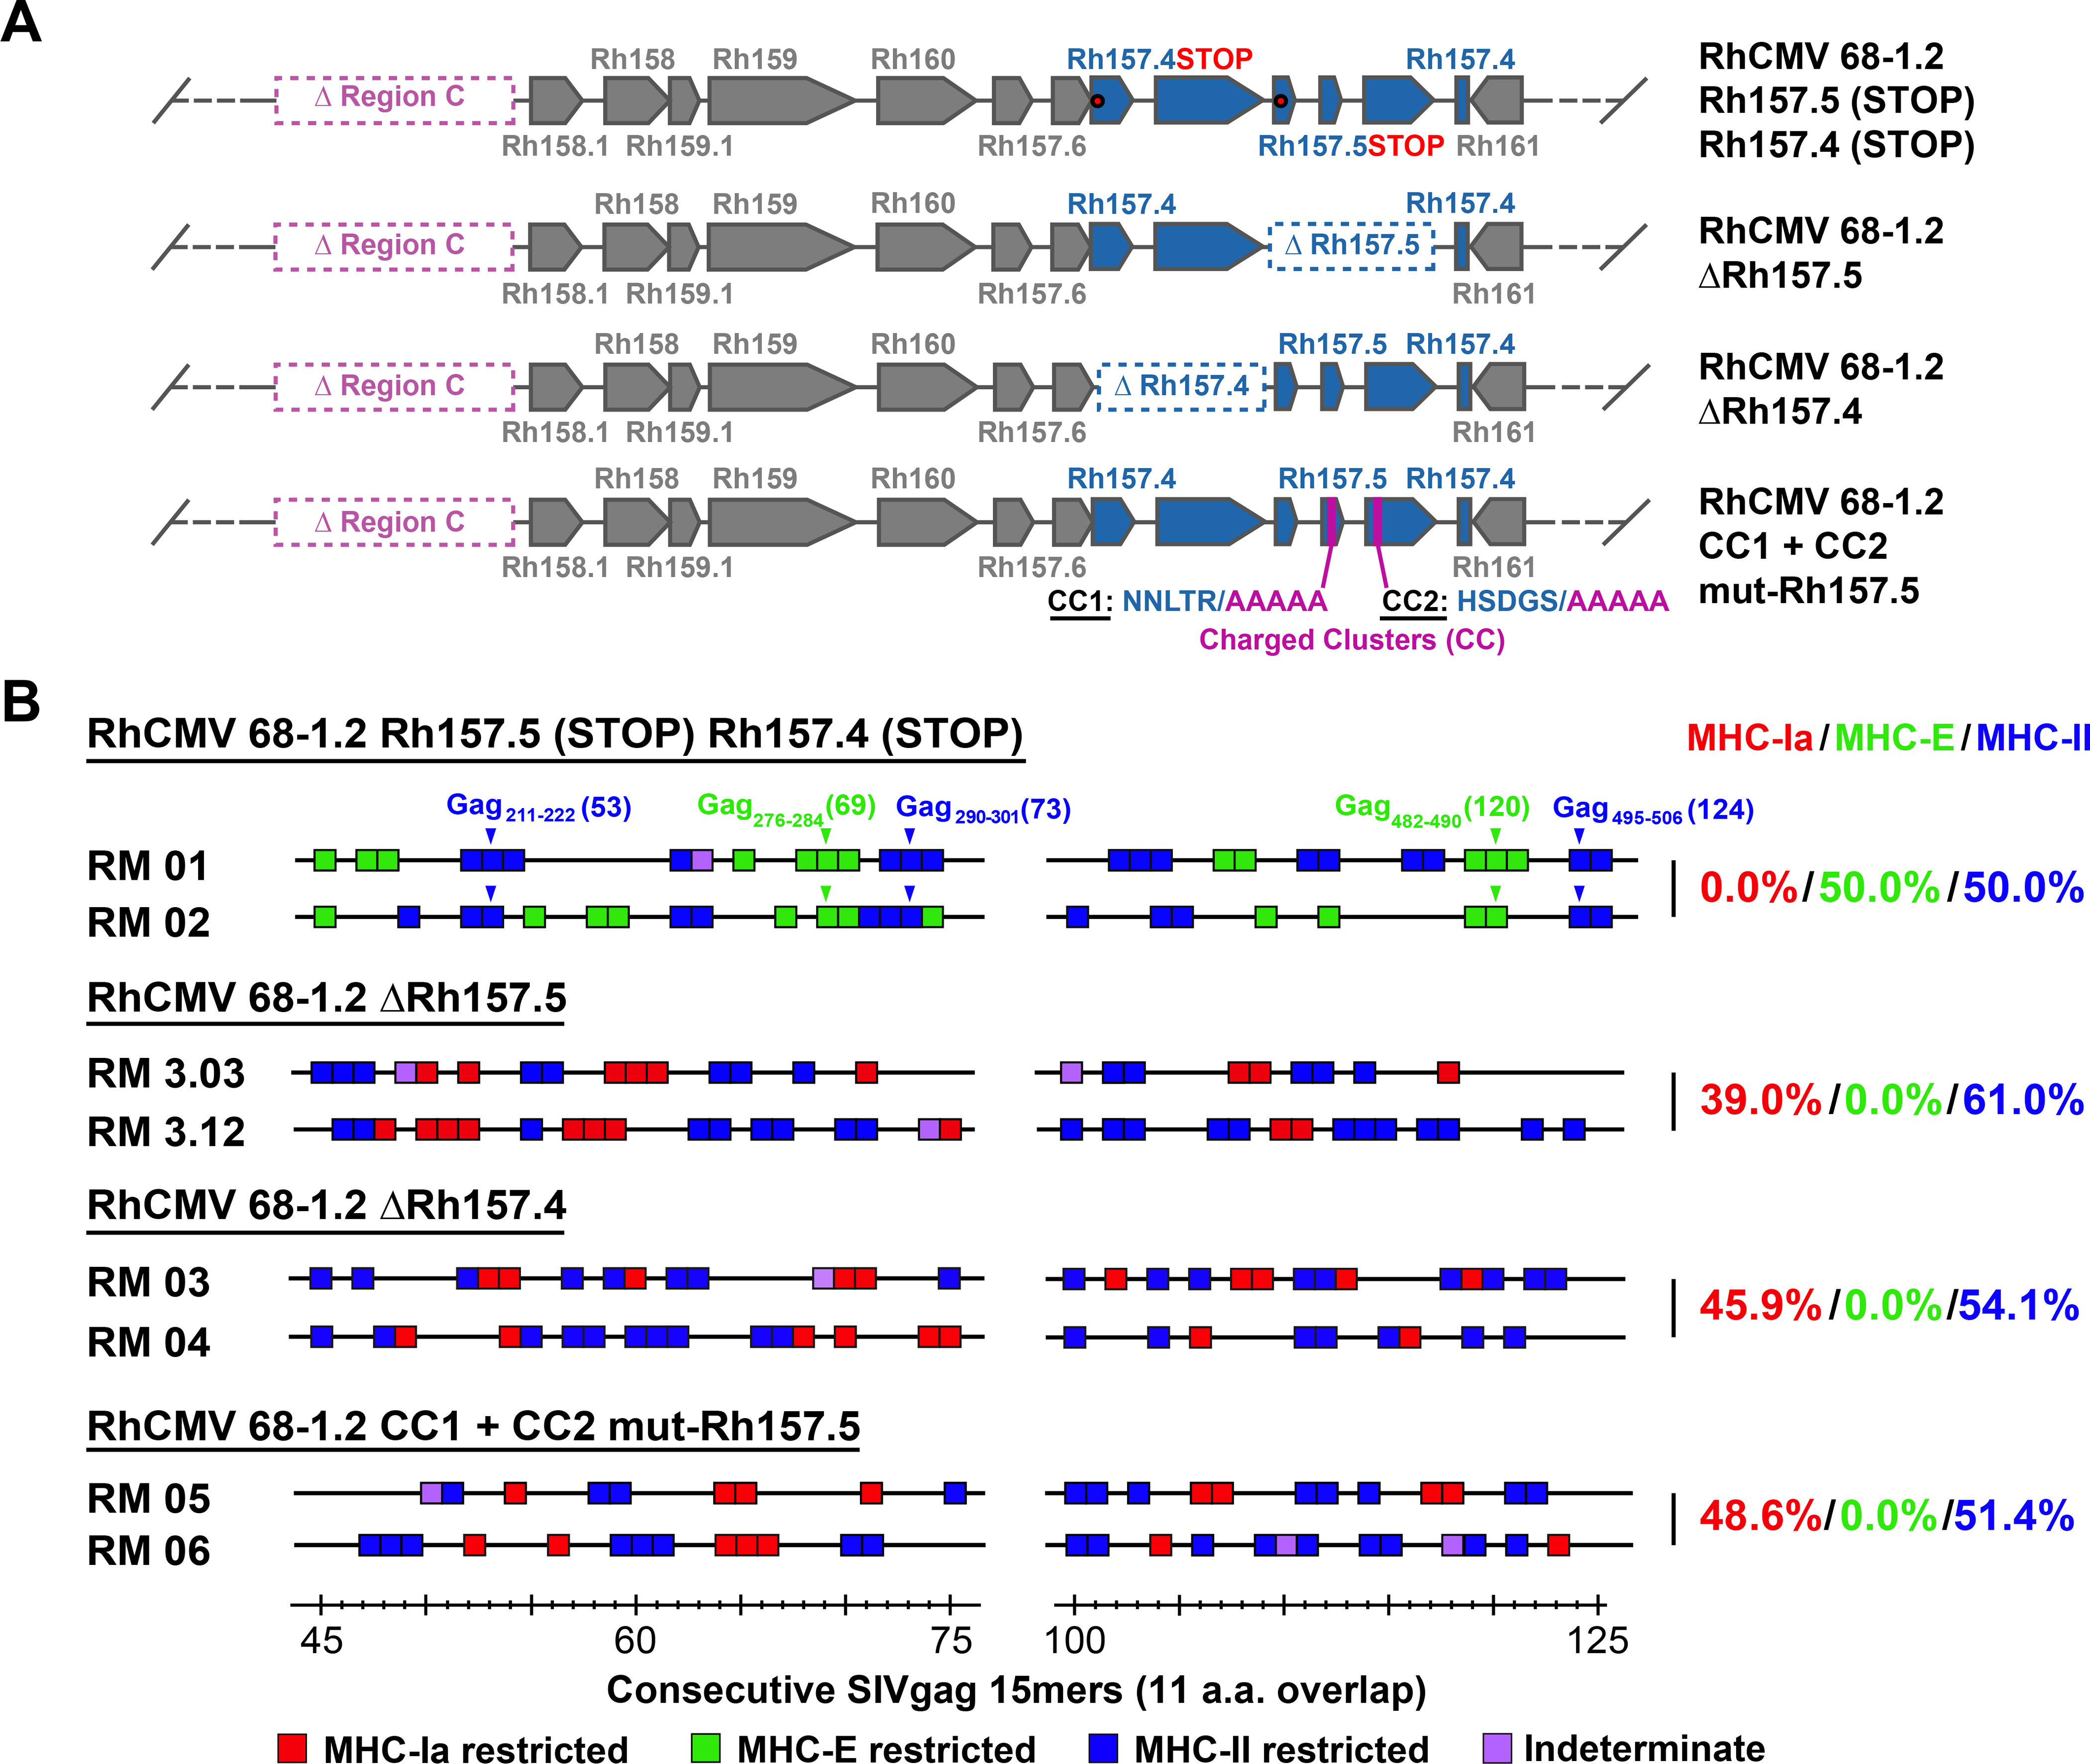
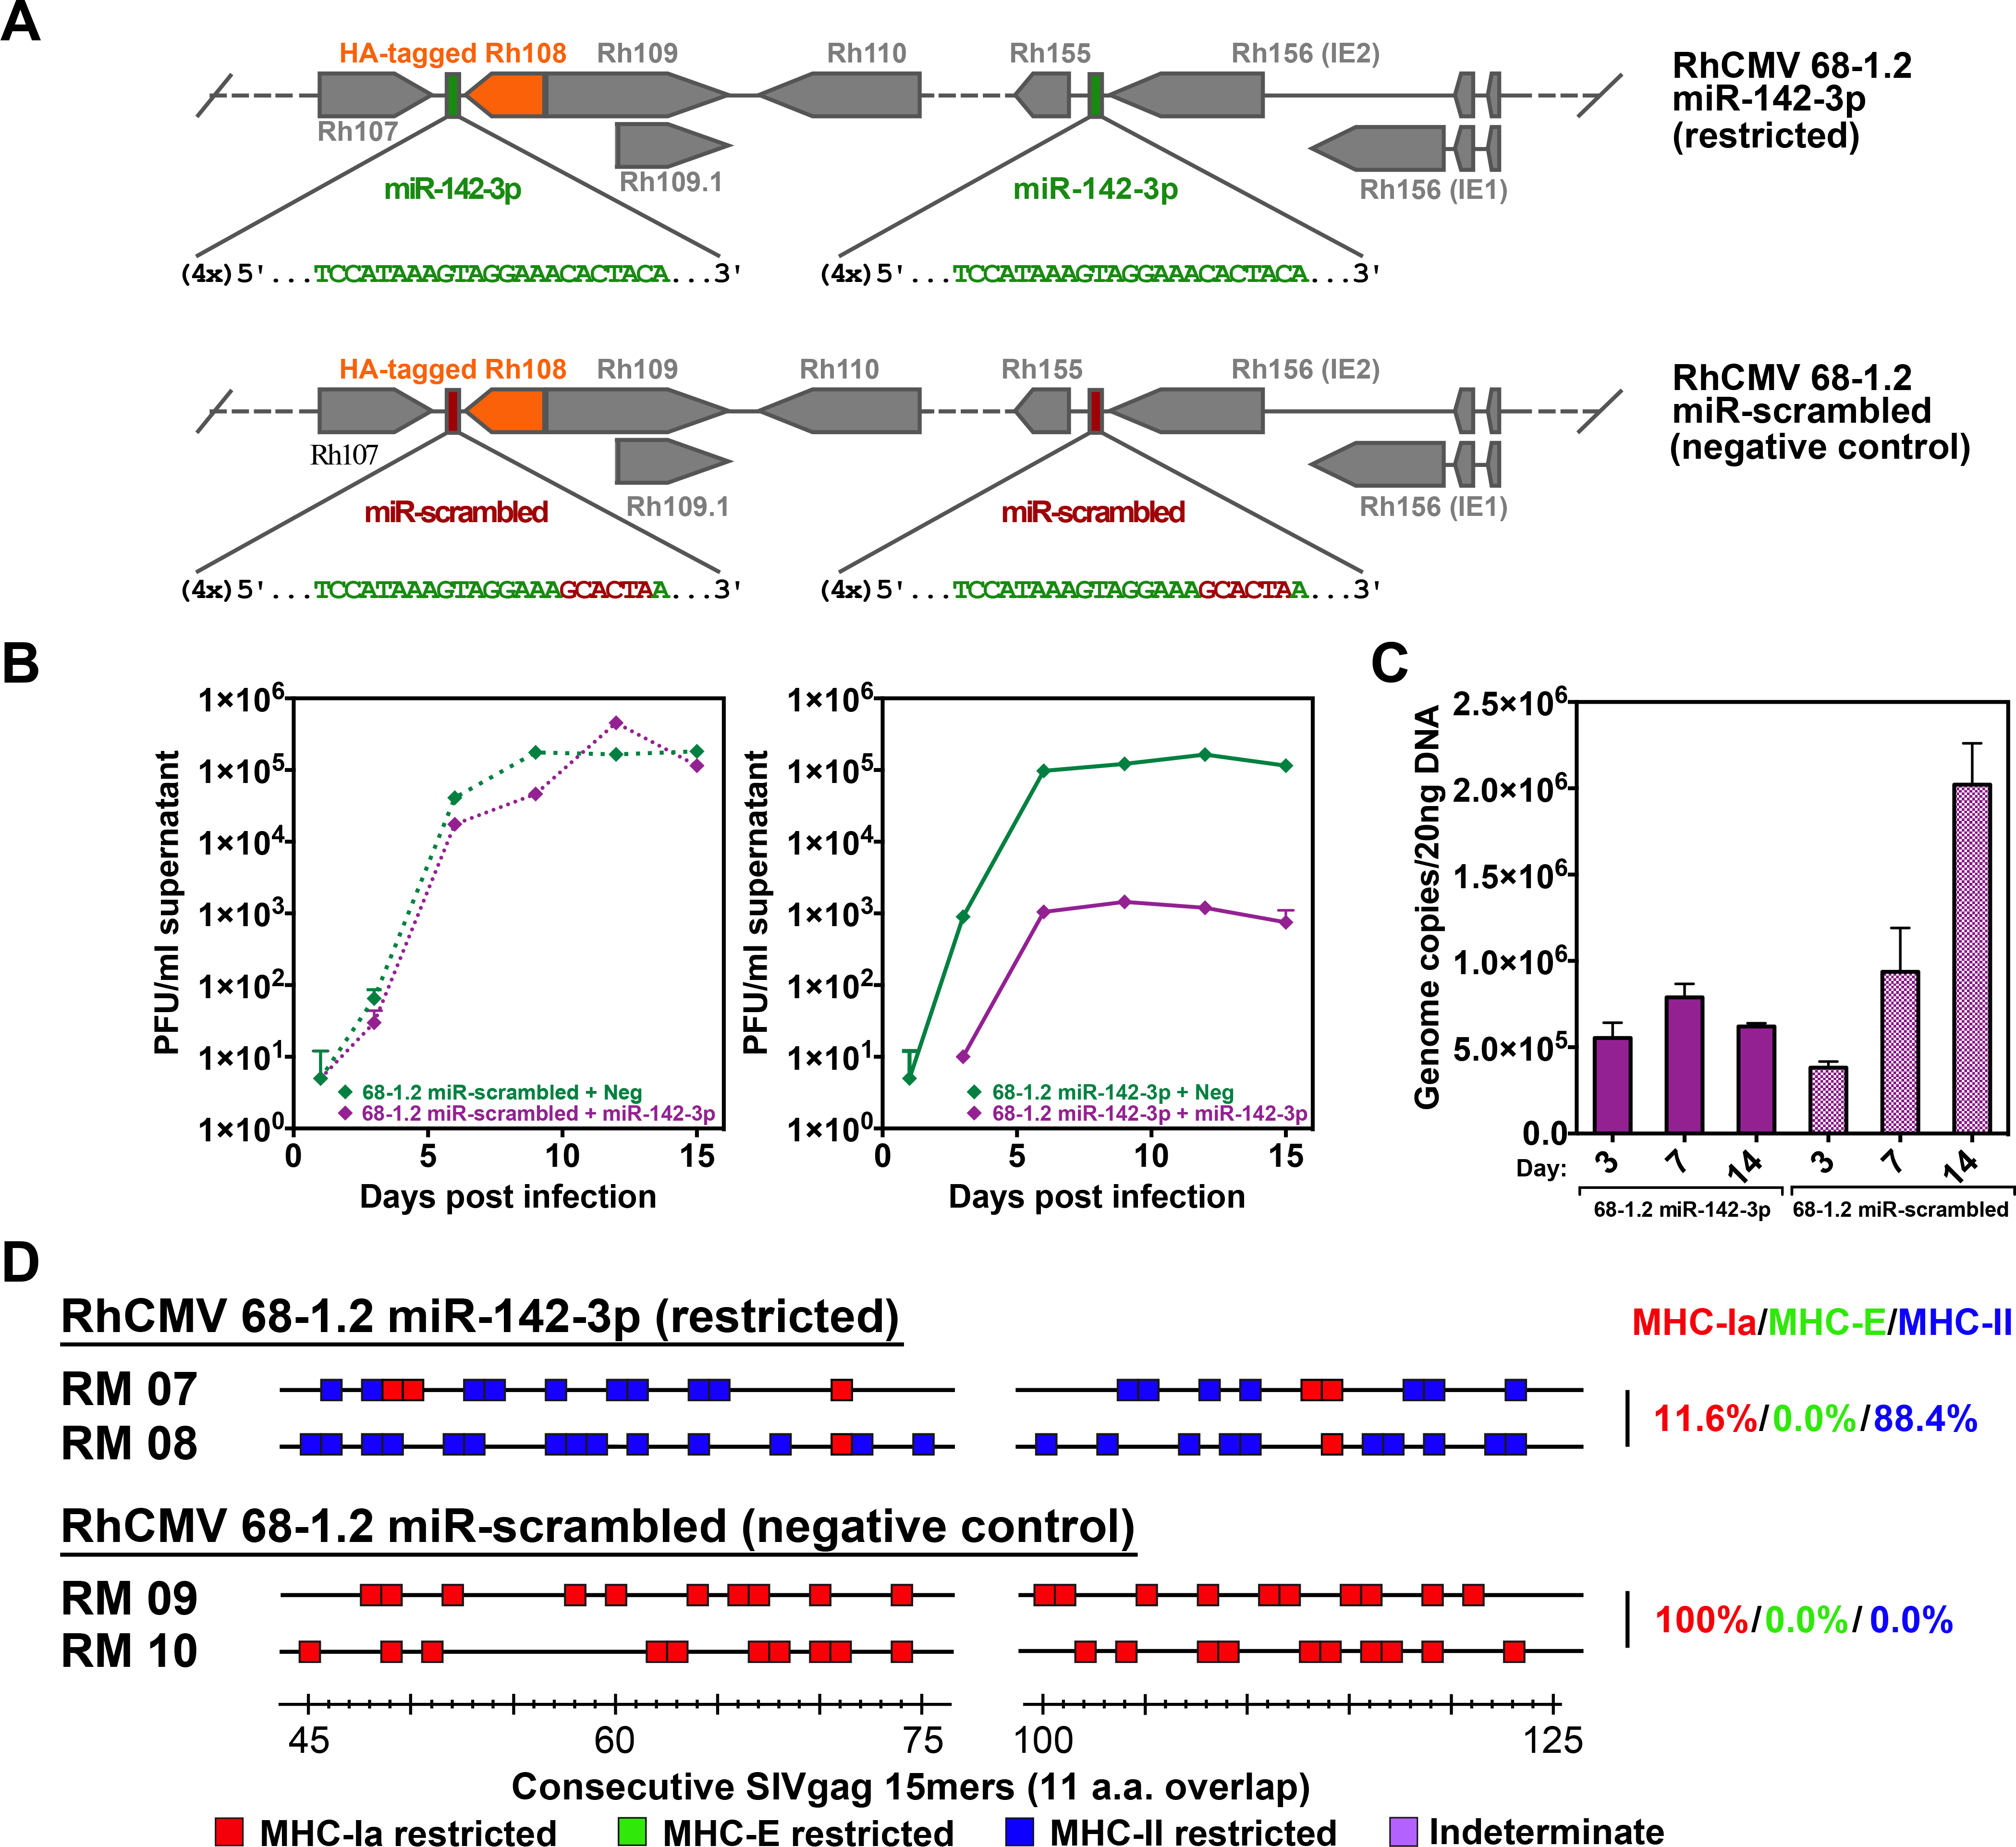
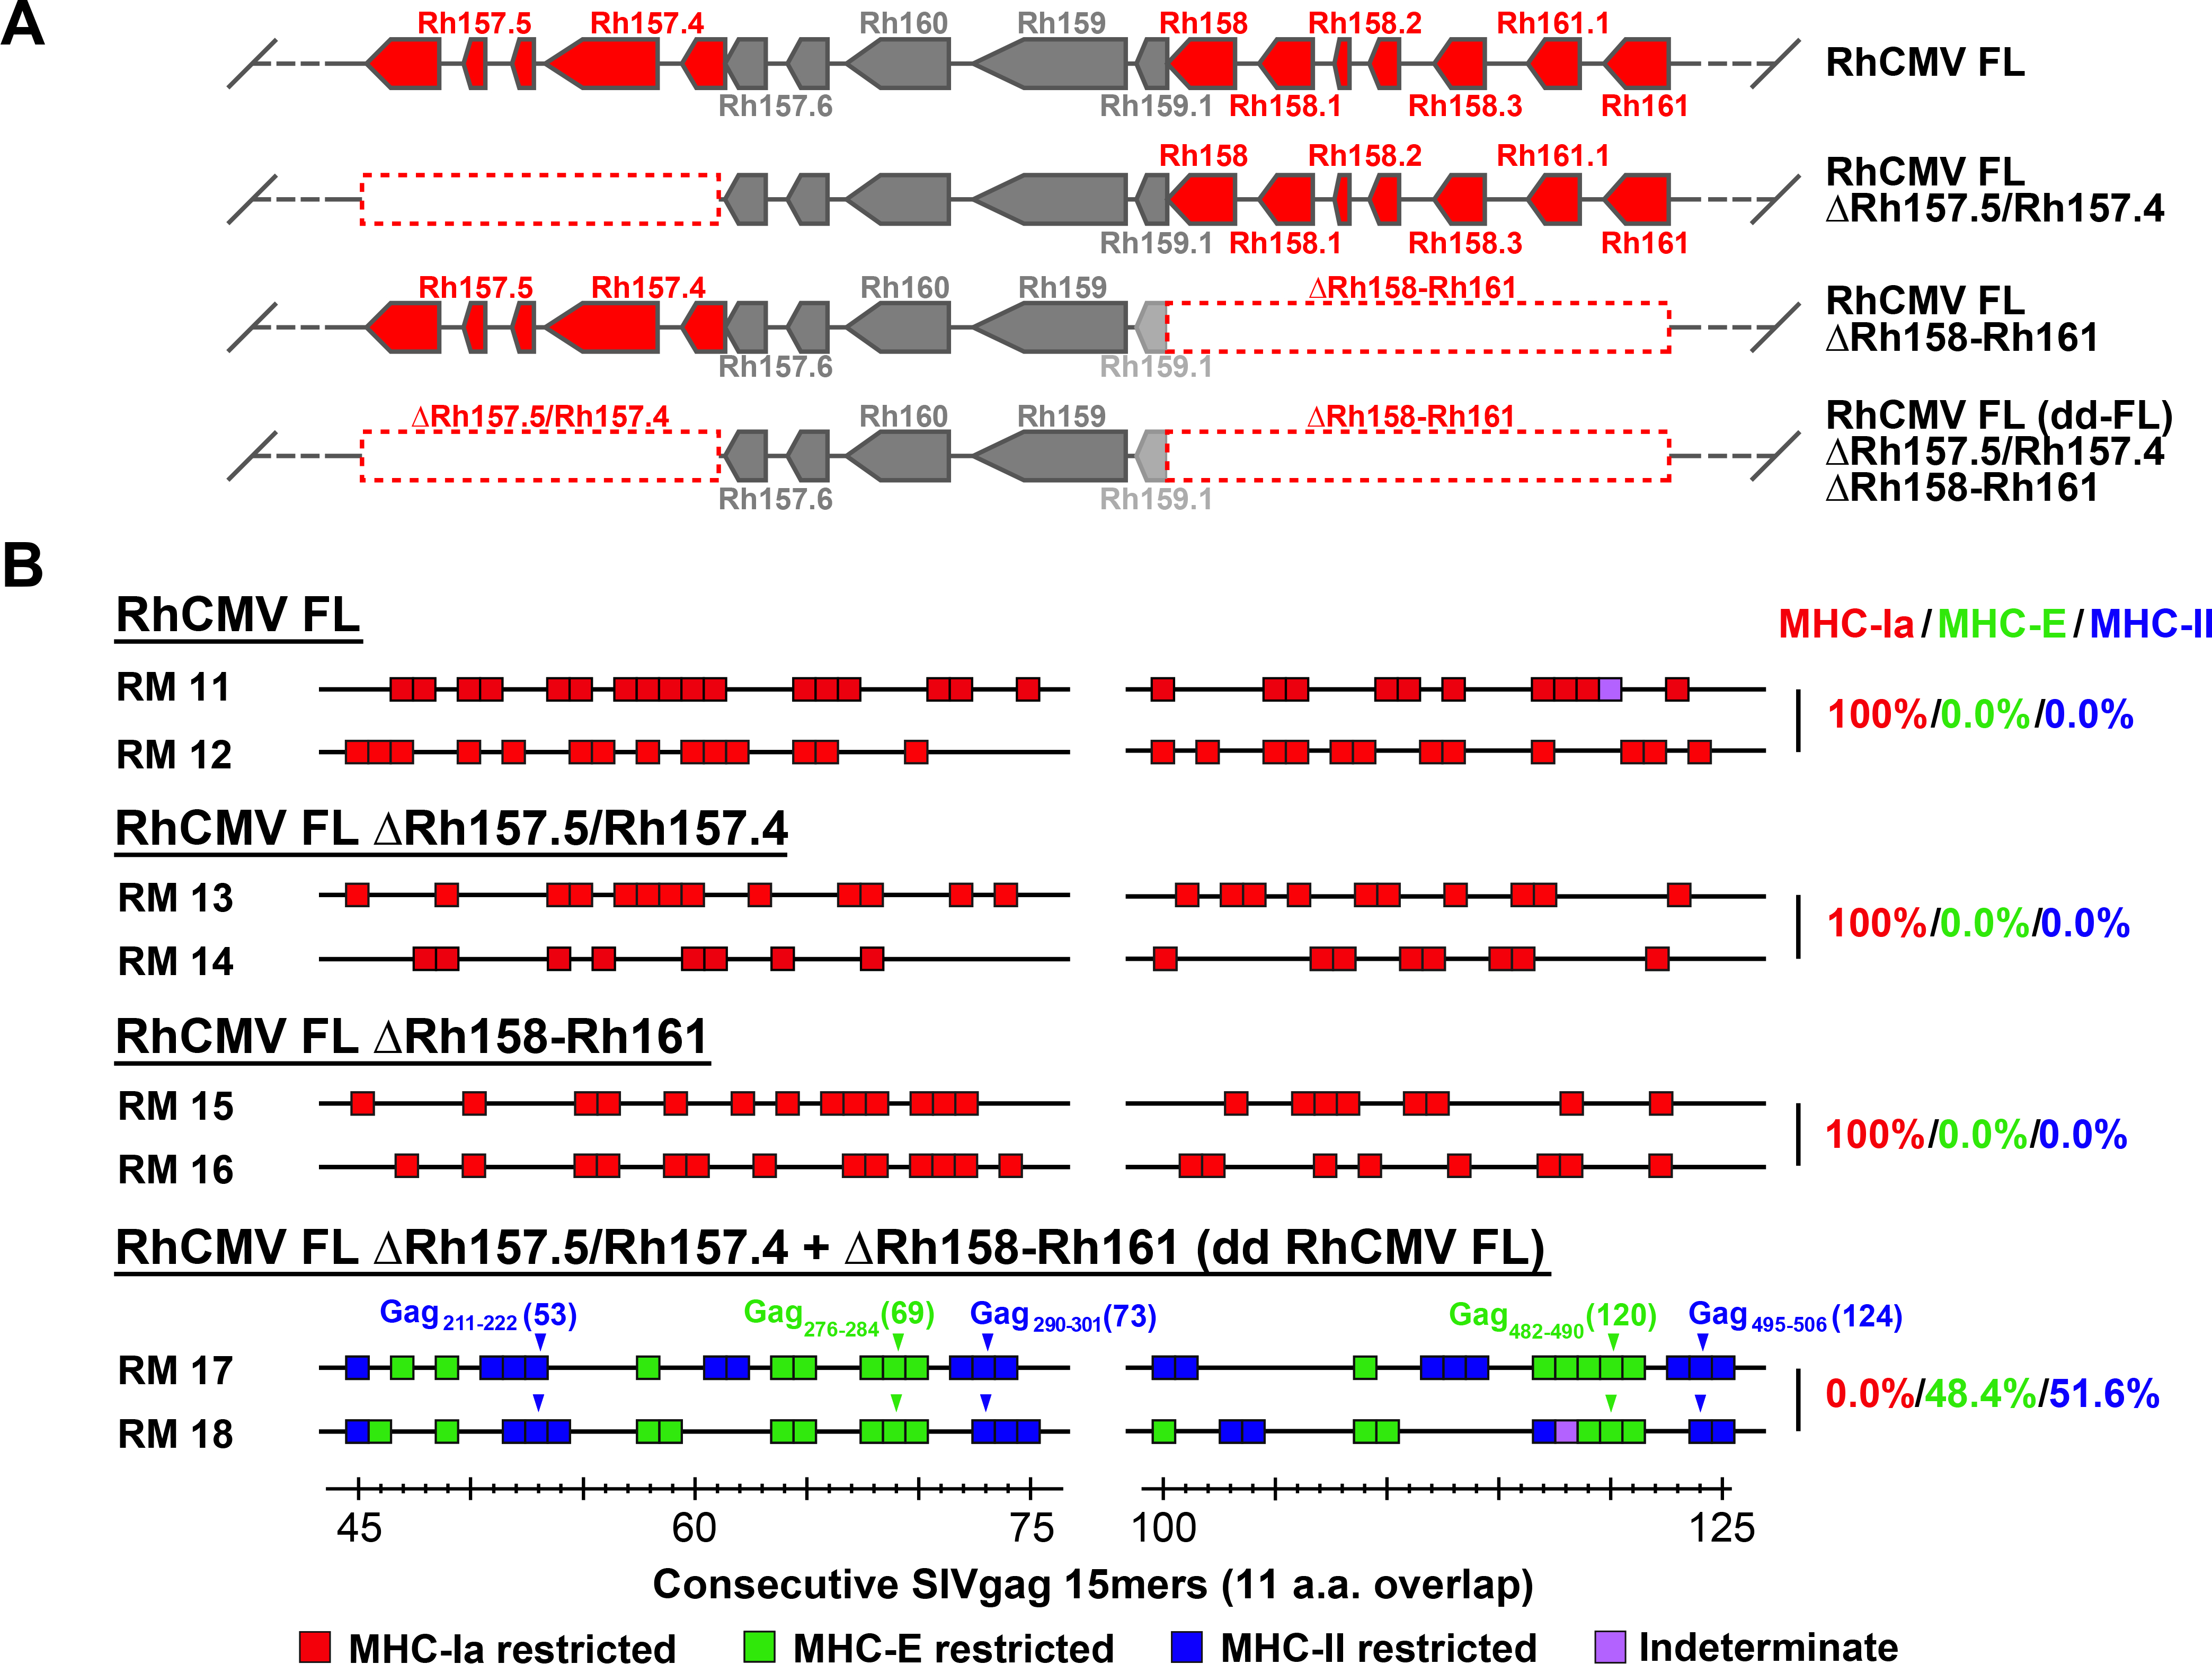
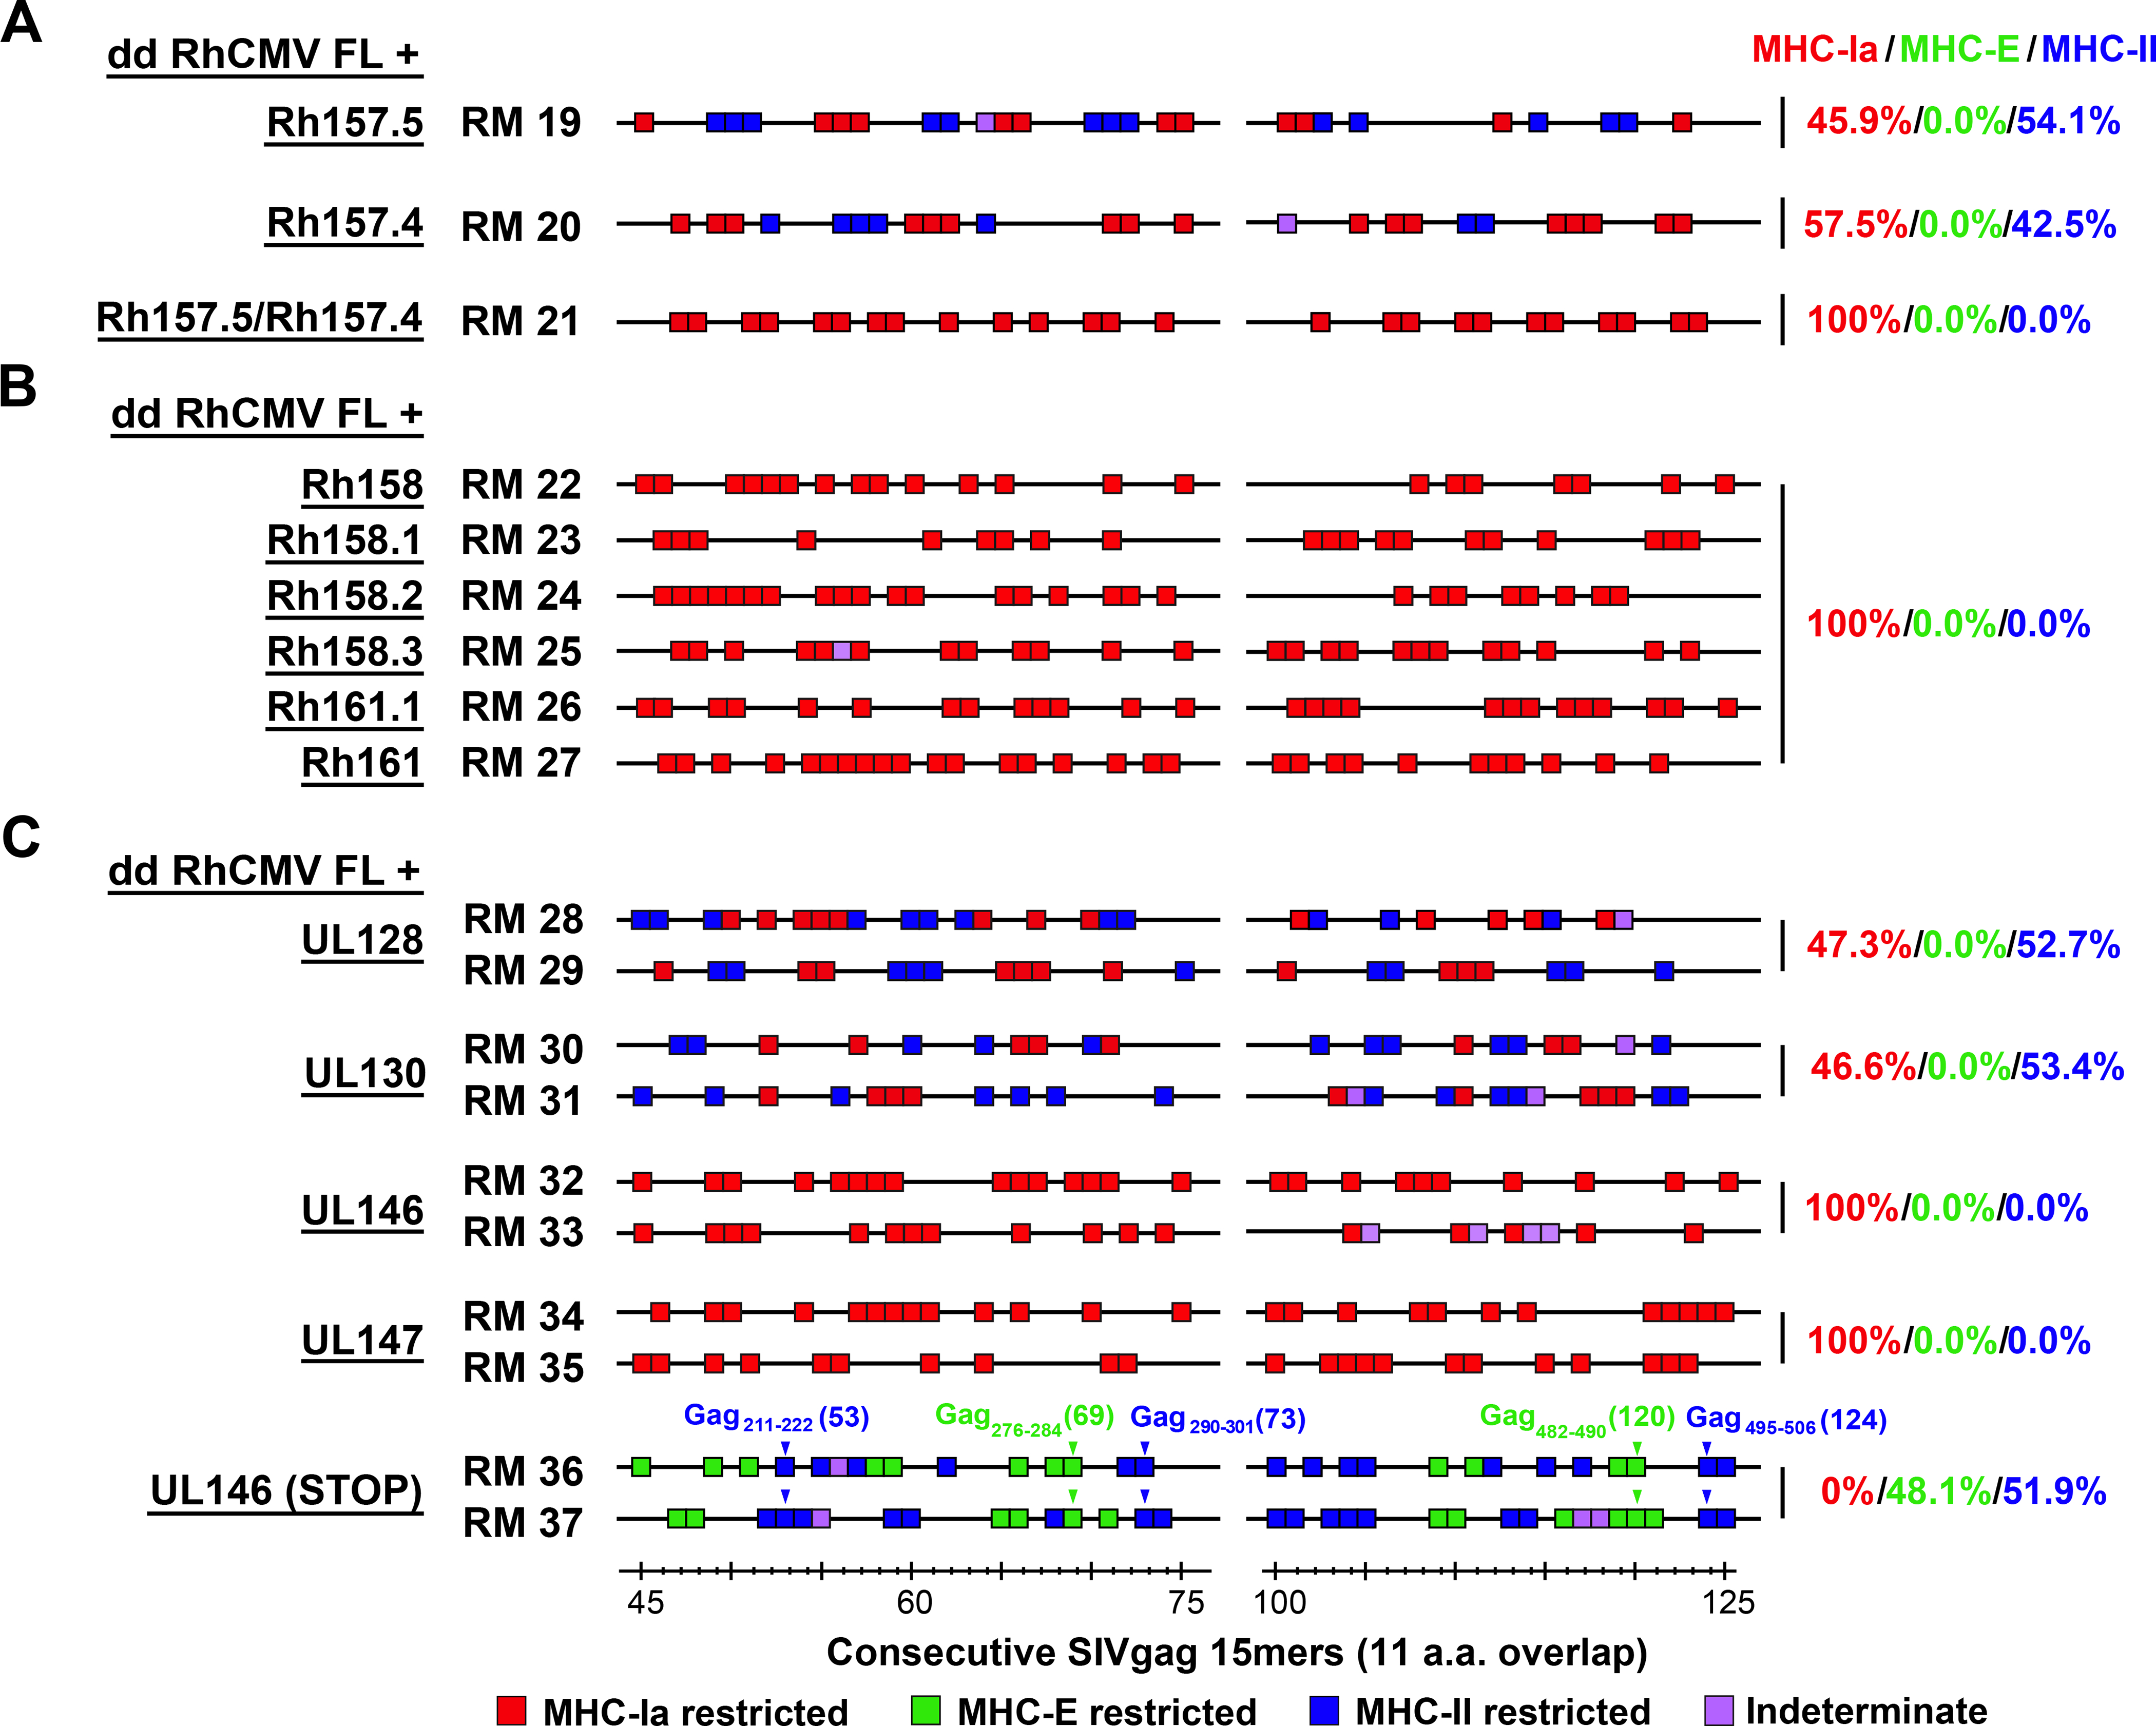
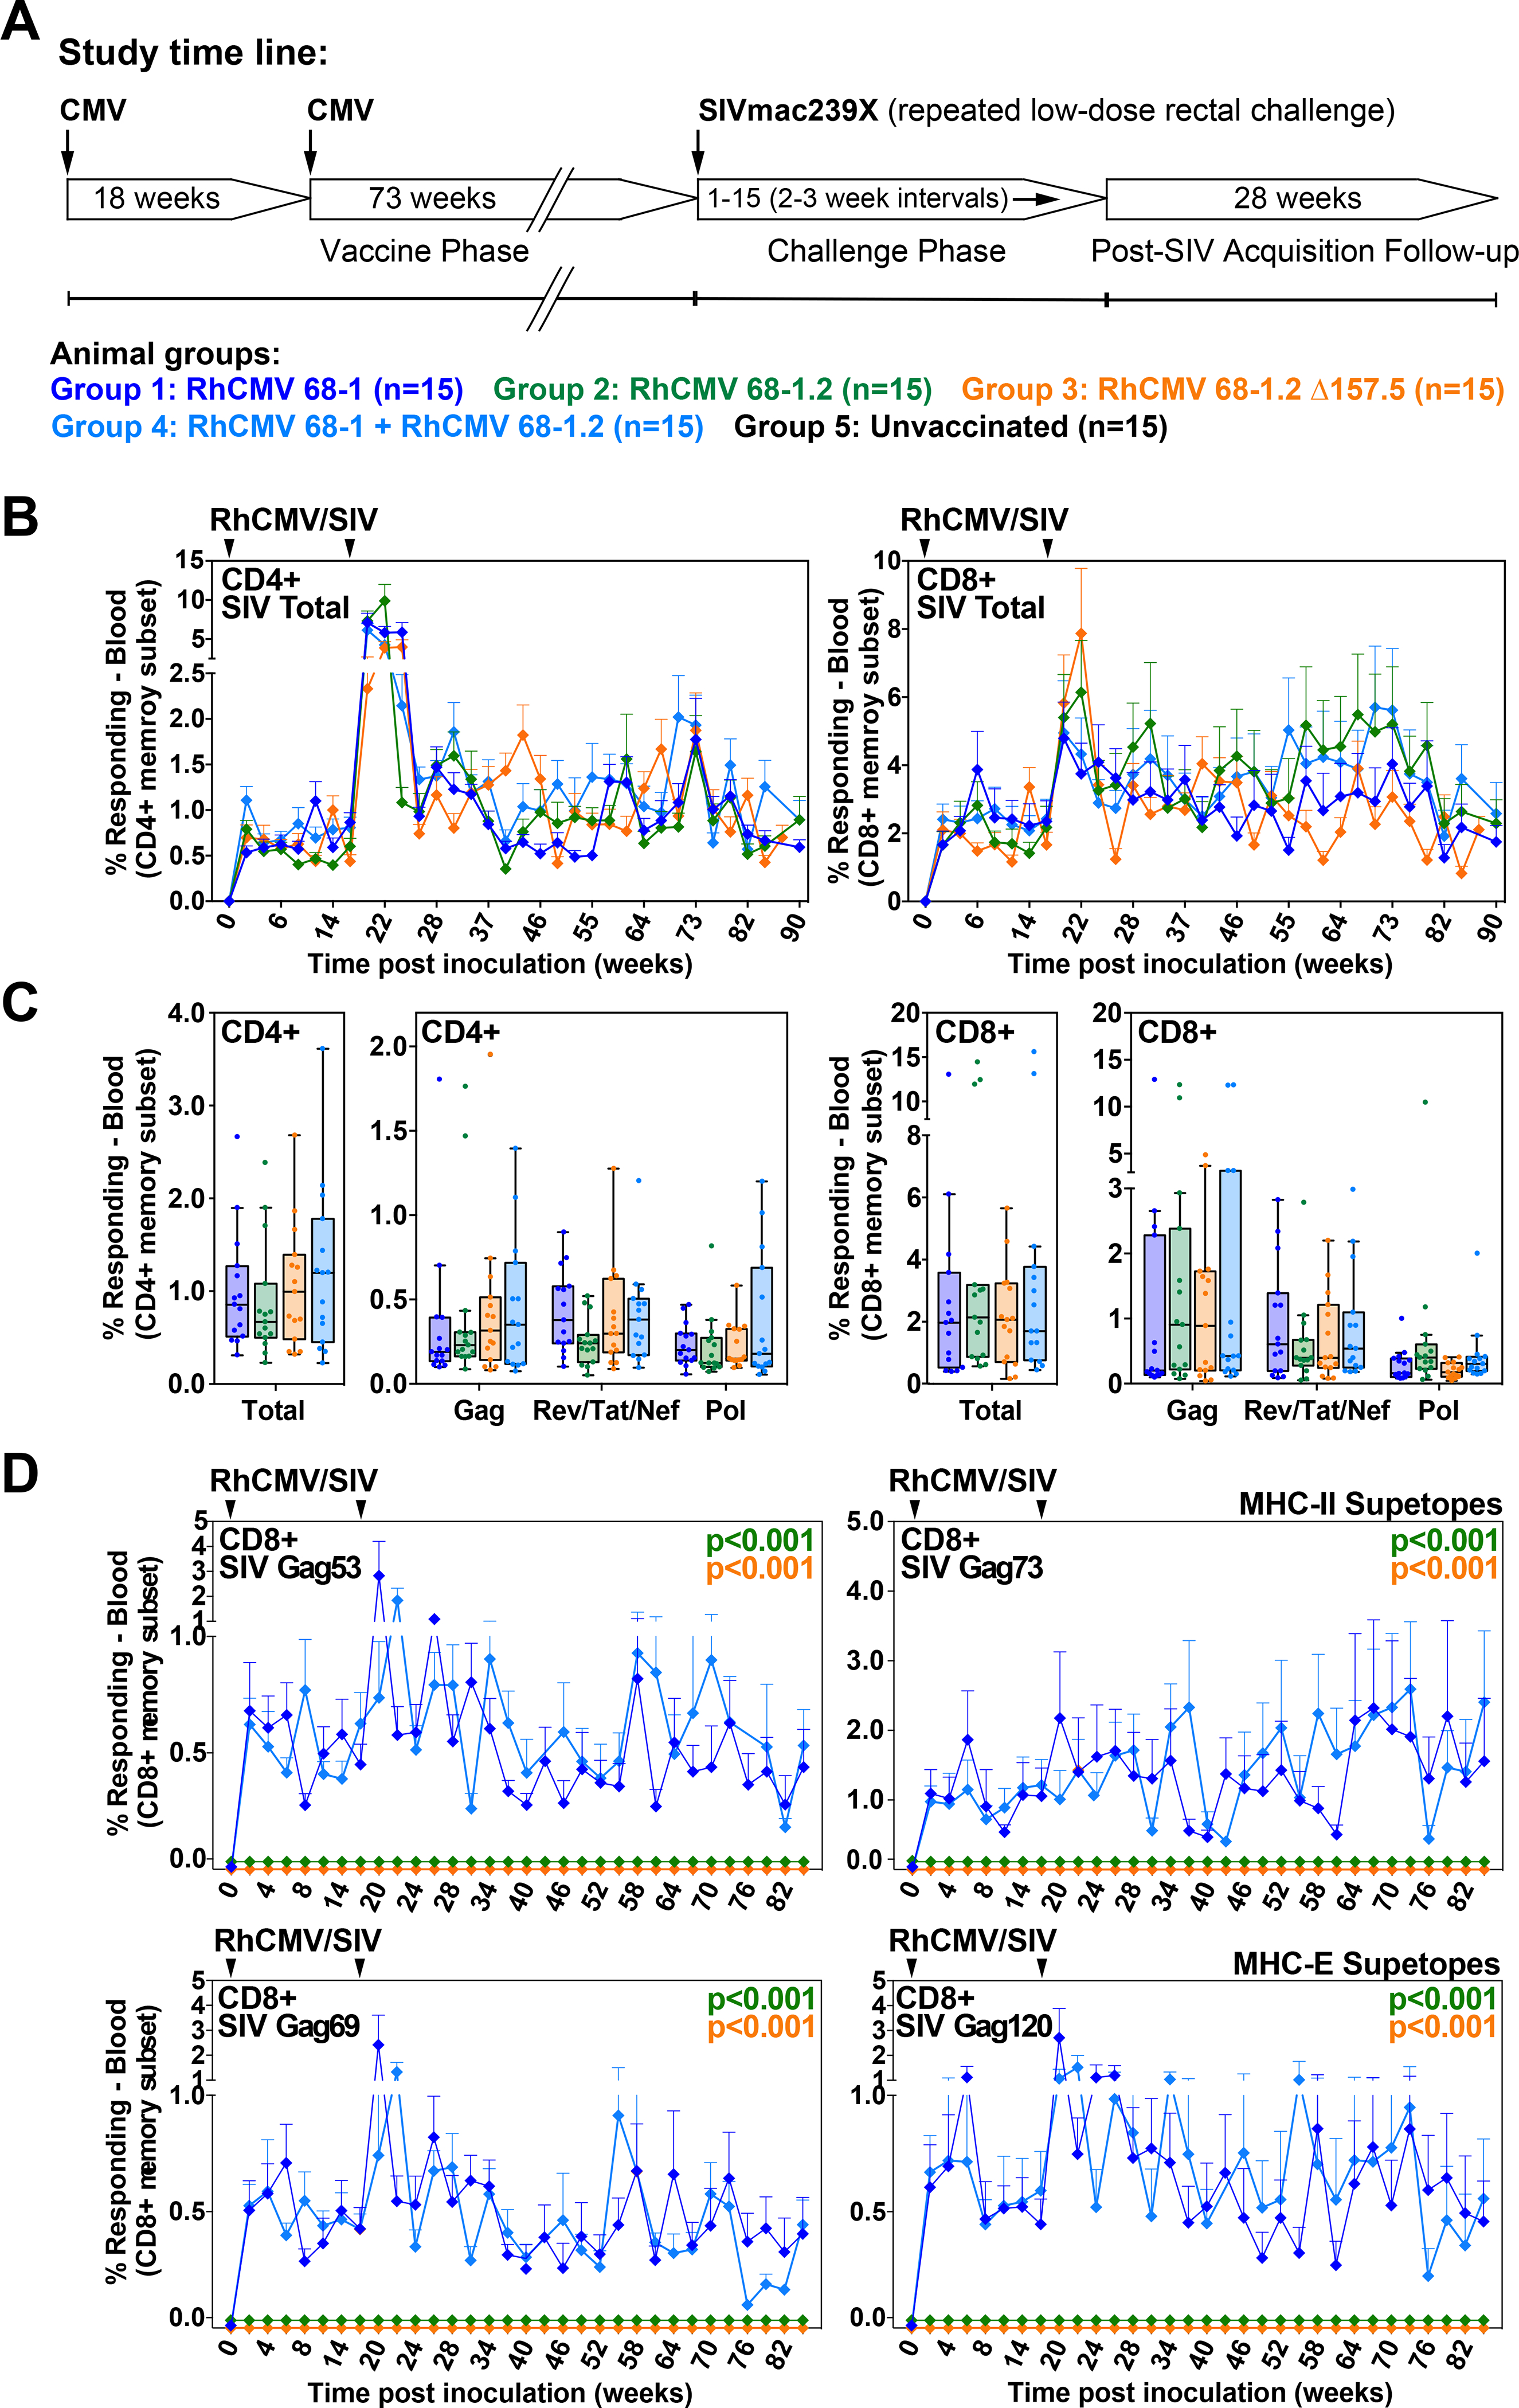
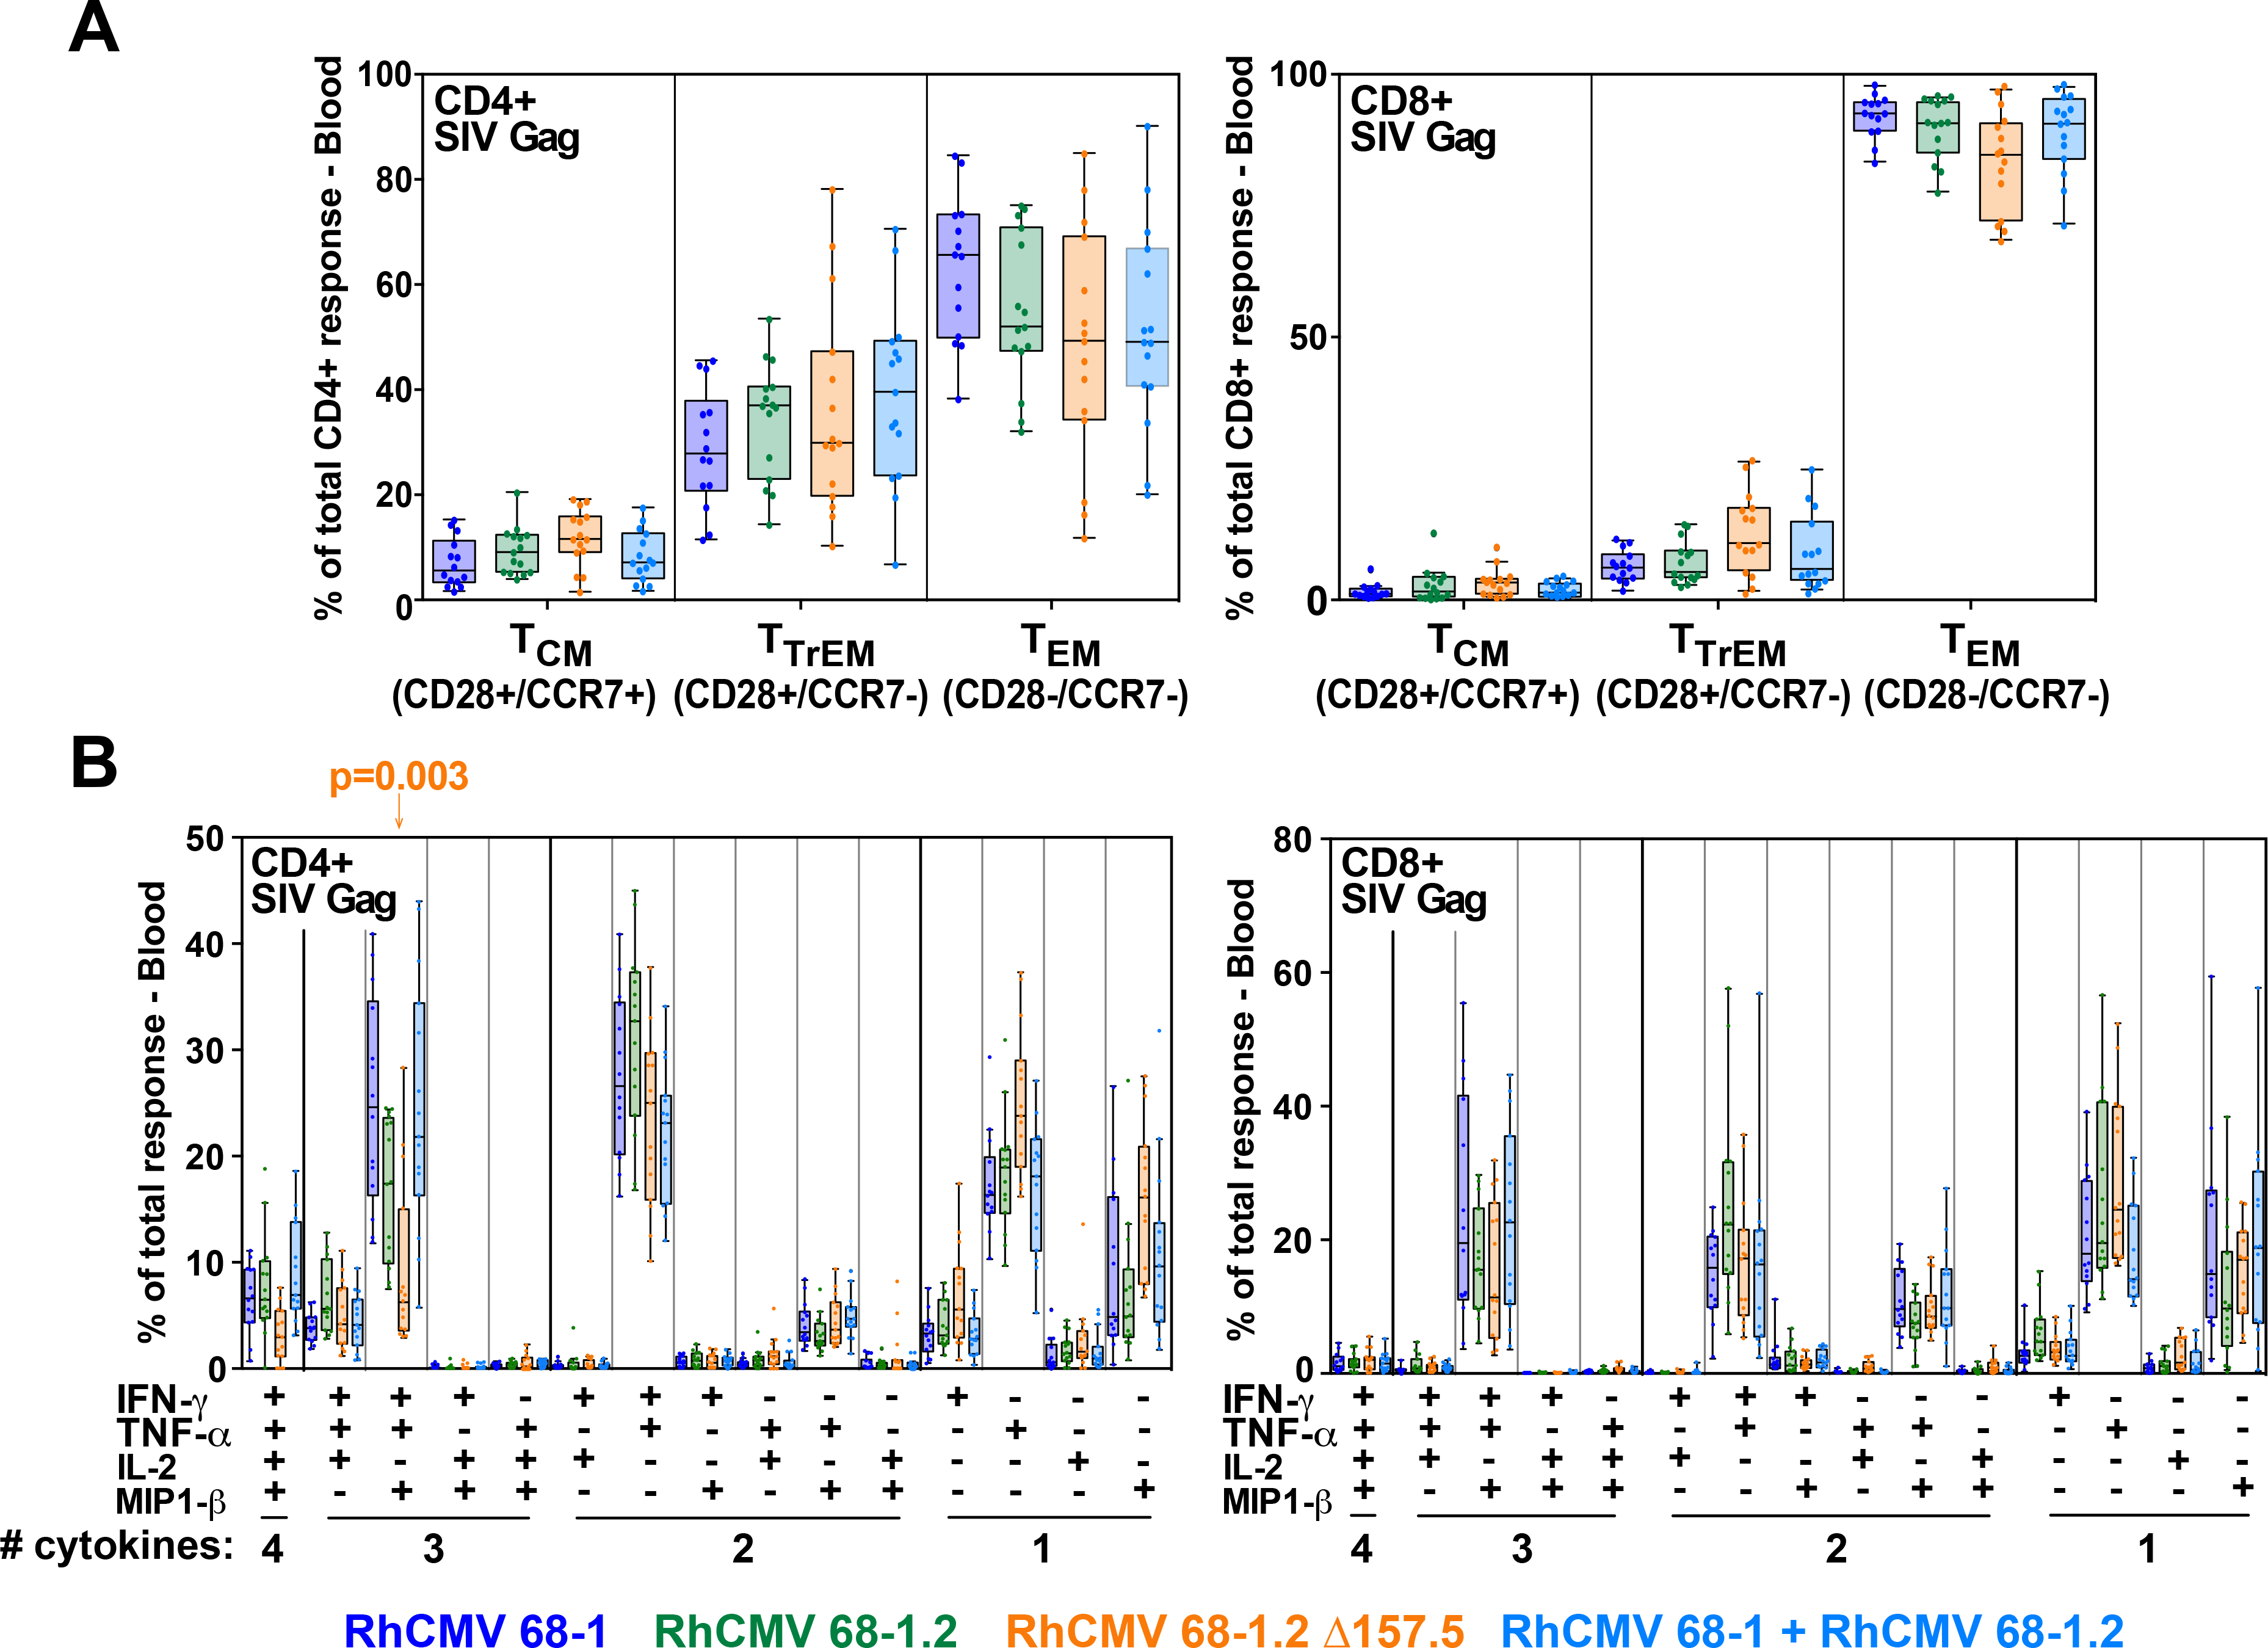
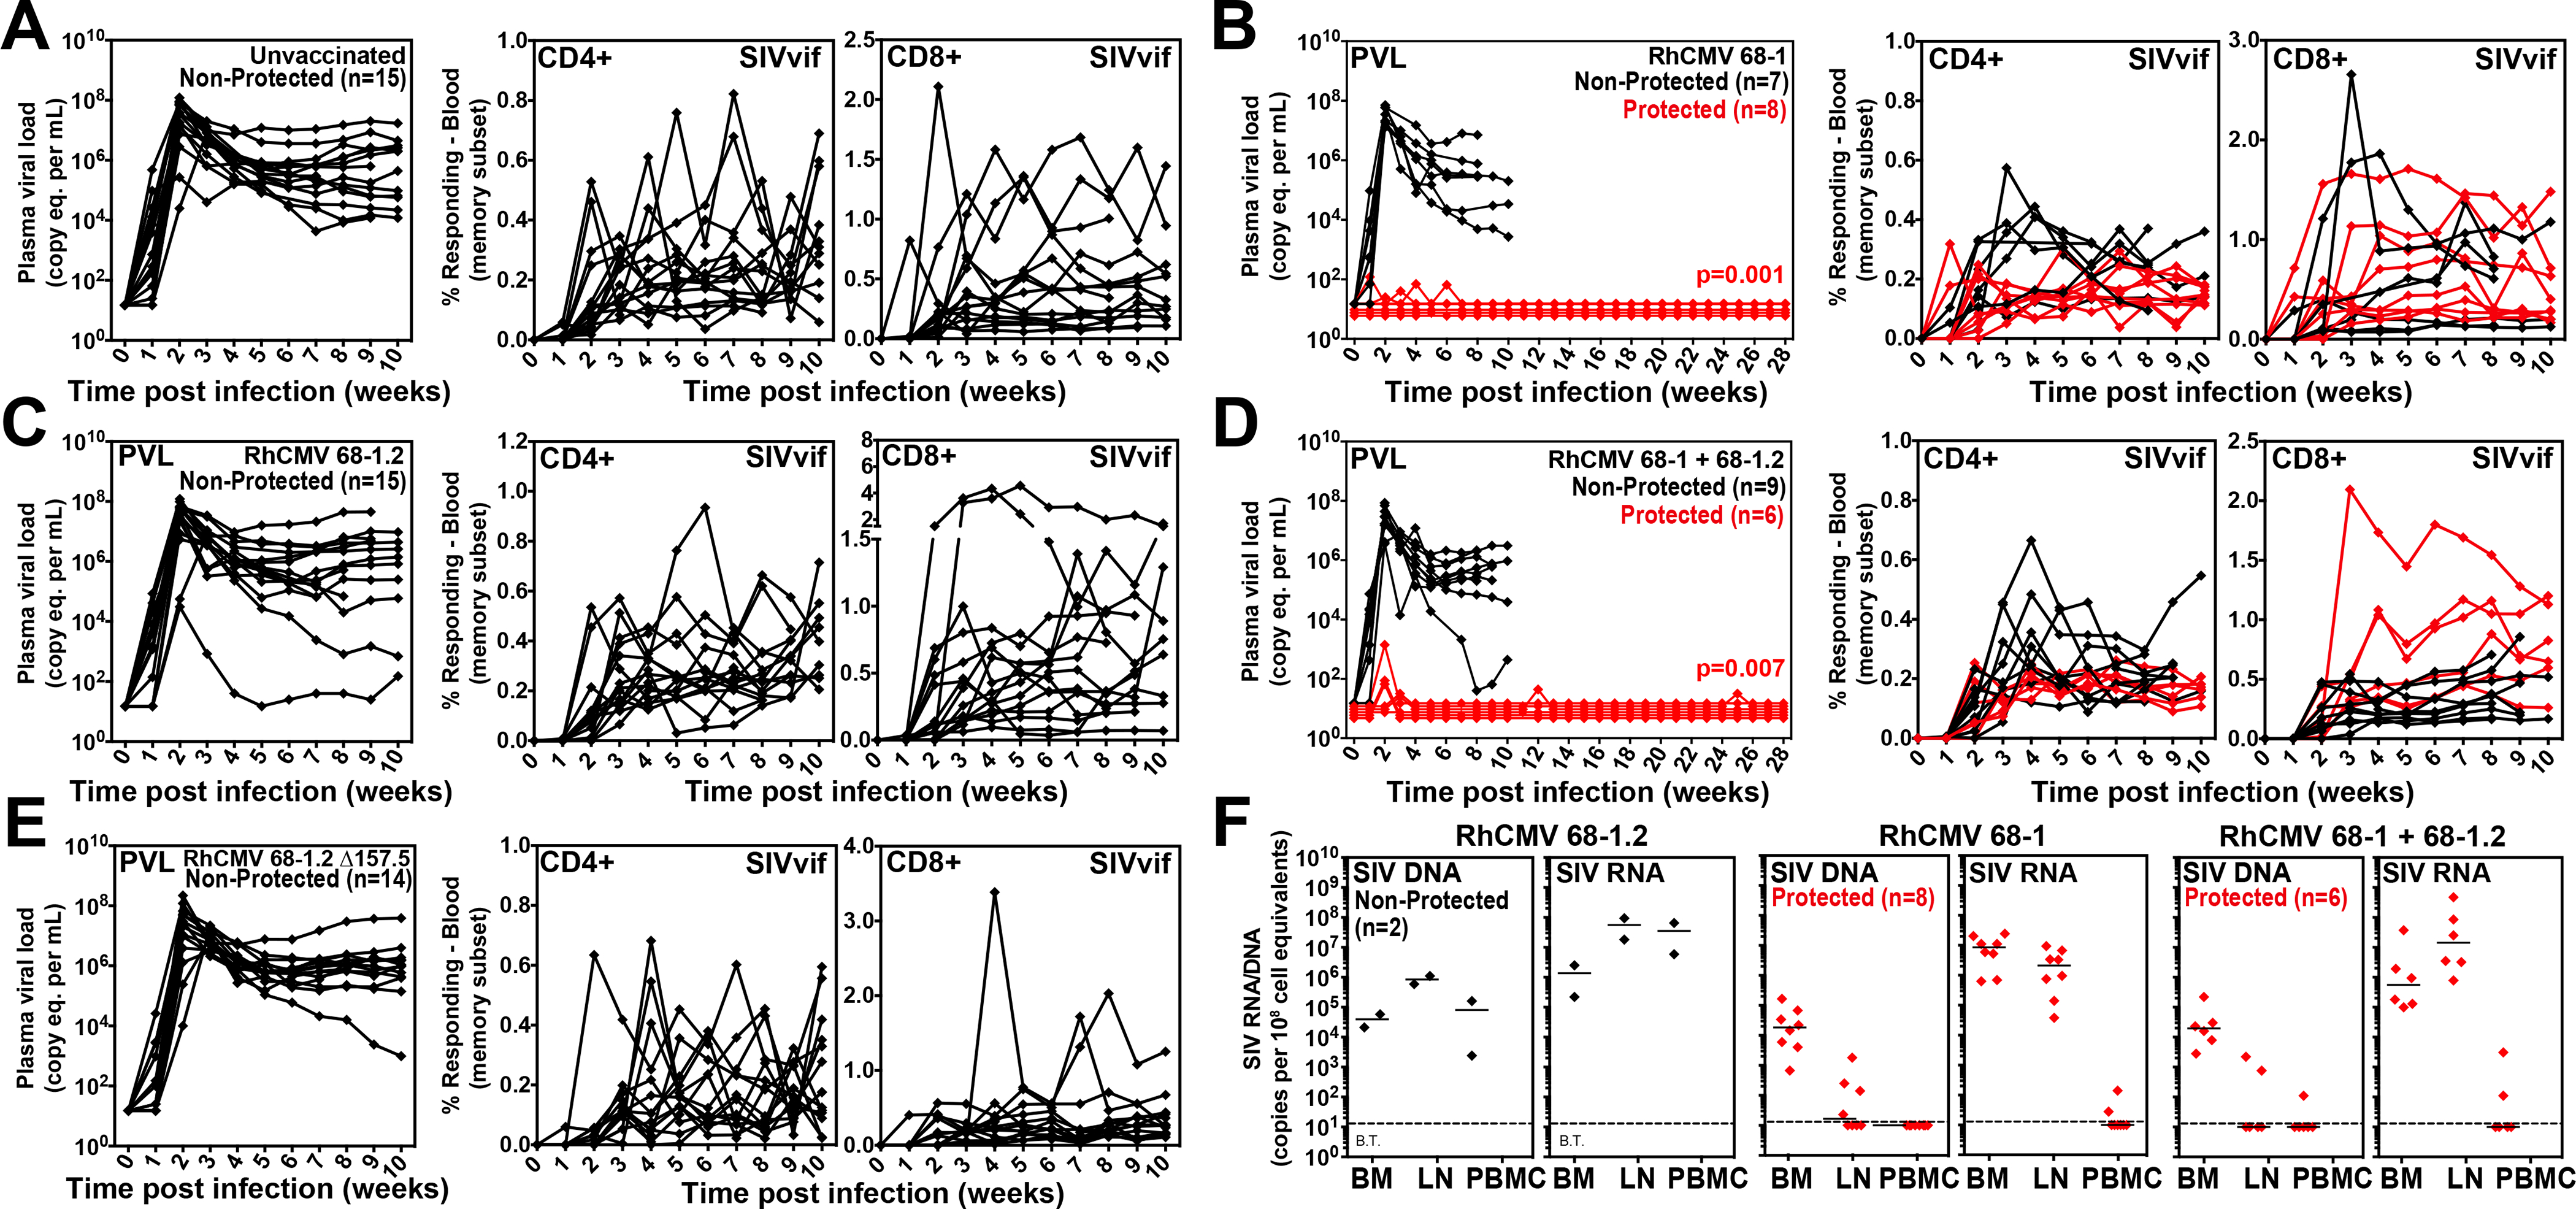
Simian immunodeficiency virus (SIV) insert-expressing, 68-1 rhesus cytomegalovirus (RhCMV/SIV) vectors elicit major histocompatibility complex E (MHC-E)- and MHC-II-restricted, SIV-specific CD8+ T cell responses, but the basis of these unconventional responses and their contribution to demonstrated vaccine efficacy against SIV challenge in the rhesus monkeys (RMs) have not been characterized. We show that these unconventional responses resulted from a chance genetic rearrangement in 68-1 RhCMV that abrogated the function of eight distinct immunomodulatory gene products encoded in two RhCMV genomic regions (Rh157.5/Rh157.4 and Rh158-161), revealing three patterns of unconventional response inhibition. Differential repair of these genes with either RhCMV-derived or orthologous human CMV (HCMV)-derived sequences (UL128/UL130; UL146/UL147) leads to either of two distinct CD8+ T cell response types-MHC-Ia-restricted only or a mix of MHC-II- and MHC-Ia-restricted CD8+ T cells. Response magnitude and functional differentiation are similar to RhCMV 68-1, but neither alternative response type mediated protection against SIV challenge. These findings implicate MHC-E-restricted CD8+ T cell responses as mediators of anti-SIV efficacy and indicate that translation of RhCMV/SIV vector efficacy to humans will likely require deletion of all genes that inhibit these responses from the HCMV/HIV vector.


Conflict of interest statement

Competing interests: OHSU, LJP, SGH, JAN, and KF have a substantial financial interest in Vir Biotechnology, Inc., a company that may have a commercial interest in the results of this research and technology. LJP, SGH, JAN, and KF are also consultants to Vir Biotechnology, Inc., and JBS has received compensation for consulting for Vir Biotechnology, Inc. LJP, SGH, JAN, and KF are co-inventors of patent WO 2011/143650 A2 “Recombinant RhCMV and HCMV vectors and uses thereof” licensed to Vir Biotechnology, Inc. LJP, SGH, KF, and DM are co-inventors of patent US2016/0010112 A1 “Cytomegalovirus vectors enabling control of T cell targeting” licensed to Vir Biotechnology, Inc. JAN, SGH, MHH, LJP and KF are co-inventors of patent US2017/0143809 A1 “CMV vectors comprising microRNA recognition elements” licensed to Vir Biotechnology, Inc. These potential individual and institutional conflicts of interest have been reviewed and managed by OHSU.

Figures

Figure 1.
Figure 1.. RhCMV strain differences.
(A) Schematic of the genetic differences between 68–1, 68–1.2, and FL (wildtype) RhCMV in the region of the genome encoding the pentameric complex (analogous to the ULb’ region of HCMV), showing the inversion-deletion event that occurred during in vitro passage of the 68–1 strain and its partial repair in 68–1.2 (with pointed boxes representing distinct exons, the point indicating the 3’ end of the ORF). The genomic segments of inversion and deletion indicated by the letters A, B and C were adapted from Oxford at al. (11). (B) Representative MHC restriction analysis of SIVgag-specific CD8+ T cell responses elicited by strain 68–1 vs. 68–1.2 RhCMV/SIVgag vectors, alone and in combination, assessed by ICS analysis of consecutive 15mer peptides with 11 amino acid overlap comprising the SIVgag protein sequence. Boxes reflect any above-threshold single 15mer response, which were then color-coded based on MHC restriction type analysis (see Methods). In addition, responsiveness to the designated MHC-E and MHC-II optimal supertope peptides are indicated by green and blue arrowheads, respectively. The figure shows only the SIVgag regions from amino acid 45–75 and amino acid 100–125 (the regions including the supertopes) of 2 representative RMs, but complete epitope analysis results are presented in table S1. These overall data were used to calculate the % of the total MHC restriction-assignable SIVgag epitopes that were MHC-Ia-, MHC-E-, and MHC-II-restricted, shown at right in red/green/blue, respectively.
Figure 2.
Figure 2.. Role of the pentameric complex in RhCMV vector CD8+ T cell response programming.
(A) Schematic of the genetic configuration of 68–1.2 RhCMV/SIVgag vectors with modified Rh157.5 and Rh157.4 genes. (B) Representative MHC restriction analysis of SIVgag-specific CD8+ T cell responses elicited by the designated Rh157.5 and/or Rh157.4 gene-modified RhCMV vectors, as described in Fig. 1 legend. Overall epitope analysis results are shown in table S1.
Figure 3.
Figure 3.. Role of myeloid cell tropism in RhCMV vector CD8+ T cell response programming.
(A) Schematic of the miR-142–3p target sites inserted downstream of both Rh156 and Rh108 (homologs of HCMV IE2 and UL79), which are essential for viral replication. Green sequences represent insertion of four miR-142–3p recognition sites. Red sequences indicate scrambled nucleotides of the miR-142–3p sequence used to create a control vector. Orange boxes represent the Rh108 ORF with a hemagglutinin (HA) epitope-tag. (B) Growth analysis of the 68–1.2 control (scrambled sequence) RhCMV vector (left) vs. 68–1.2 miR-142–3p RhCMV vector (right) in the presence or absence of miR-142–3p expression. Primary rhesus fibroblasts were transfected with negative control or miR-142–3p mimic and infected 24 hours later with the 68–1.2 miR-142–3p or control RhCMV vectors at an MOI of 0.01. Cell supernatants were harvested at the indicated timepoints and titered on primary rhesus fibroblasts. Results are representative of 2 independent experiments. (C) Analysis of 68–1.2 miR-142–3p vs control RhCMV vector replication in primary macrophages. Macrophages were differentiated in vitro from peripheral blood of 3 RMs and infected with 68–1.2 miR-142–3p or scrambled RhCMV at MOI = 5. At the indicated times post-infection viral DNA was isolated and total DNA copies were determined using qPCR (mean + SEM of 3 independent experiments shown). (D) Representative MHC restriction analysis of SIVgag-specific CD8+ T cell responses elicited by 68–1.2 miR-142–3p vs. scrambled RhCMV/SIVgag vectors, as described in Fig. 1. Overall epitope analysis results are shown in table S1.
Figure 4.
Figure 4.. Regulation of RhCMV vector CD8+ T cell response programming by non-pentameric complex-related genes in the same RhCMV genomic region.
(A) Schematic representation of the configuration of FL-RhCMV vector in the genetic region of the 68–1 inversion/deletion, compared to modified FL-RhCMV vectors in which the gene segments involved in each end of the 68–1 inversion/deletion (Rh157.5/Rh157.4 and Rh158–162) are separately deleted (single-deleted vectors) or both deleted (e.g., double-deleted or dd vector). (B) Representative MHC restriction analysis of SIVgag-specific CD8+ T cell responses elicited by FL, double-deleted and both single-deleted RhCMV/SIVgag vectors, as described in Fig. 1. Overall epitope analysis results are shown in table S1.
Figure 5.
Figure 5.. Identification of CMV-encoded inhibitors of unconventionally restricted CD8+ T cell response priming.
(A,B) Representative MHC restriction analysis of SIV-specific CD8+ T cell responses elicited by double-deleted (dd) FL-RhCMV/SIVgag vectors which were engineered to express Rh157.5 and Rh157.4 alone, Rh157.5 + Rh157.4, or each of the Rh158-Rh161 alone (see fig. S3A–C for genetic configurations), as described in Fig. 1. (C) Representative MHC restriction analysis of SIV-specific CD8+ T cell responses elicited by double-deleted FL-RhCMV/SIVgag vectors which are engineered to individually express UL128, UL130, UL146 and UL147, the HCMV orthologs of the Rh157.5-Rh157.4 and Rh158-Rh161 genes (see fig. S3D for genetic configurations). Note that MHC restriction analysis of the parent dd FL-RhCMV/SIVgag vector-elicited CD8+ T cell response is shown in Fig. 4B (bottom panel). For A-C, overall epitope analysis results are shown in table S1.
Figure 6.
Figure 6.. Immunogenicity of differentially CD8+ T cell response-programmed RhCMV vectors.
(A) Protocol for the comparison of the immunogenicity and efficacy of 68–1, 68–1.2, and ΔRh157.5 68–1.2 RhCMV/SIV vector sets (each set comprised of 3 vectors individually expressing SIV Gag, Rev/Tat/Nef, and 5’-Pol inserts), and the combination of 68–1 and 68–1.2 vector sets (n = 15 RMs per group). (B,C) Longitudinal and plateau-phase analysis of the vaccine-elicited SIV Gag-, Rev/Tat/Nef-, and 5’-Pol-specific CD4+ and CD8+ T cell responses in peripheral blood of the RMs vaccinated with the designated vector sets. In B, the background-subtracted frequencies of cells producing TNF and/or IFN-γ by flow cytometric ICS assay to peptide mixes comprising each of the SIV inserts within the memory CD4+ or CD8+ T cell subsets were summed for overall responses with the figure showing the mean (+ SEM) of these overall responses at each time point (area-under-the-curve was used to quantitatively compare longitudinal response profiles). In C, boxplots compare the total and individual SIV insert-specific CD4+ and CD8+ T cell response frequencies between the vaccine groups during the vaccine phase plateau (each data point is the mean of response frequencies in all samples from weeks 61–90 post-first vaccination). (D) Longitudinal analysis of the vaccine-elicited CD8+ T cell responses to MHC-E-restricted [Gag276–284 (69) and Gag482–490 (120)] and MHC-II-restricted [Gag211–222 (53) and Gag290–301 (73)] SIVgag supertopes in peripheral blood of each vaccine group by ICS assay. Wilcoxon p-values for comparison of all response parameters shown in panels B-D for the 68–1-only vaccine to all other vaccines (which are individually designated by the color code shown in panel A) are shown where significant (adjusted for multiple comparisons in panels C and D).
Figure 7.
Figure 7.. Differentiation of CD8+ T cells elicited by differentially response-programmed RhCMV vectors.
(A) Boxplots compare the memory differentiation phenotype of the vaccine-elicited CD4+ and CD8+ memory T cells in peripheral blood of the same RM cohorts reported in Fig. 6 responding to overall SIV Gag 15mer peptide mix with TNF and/or IFN-γ production during the vaccine phase plateau (24–85 weeks post-first vaccination). Memory differentiation state was based on CD28 and CCR7 expression, delineating central memory (TCM), transitional effector-memory (TTrEM), and effector-memory (TEM), as designated. (B) Boxplots compare the frequency of vaccine-elicited CD4+ and CD8+ memory T cells in peripheral blood responding to the overall SIV Gag 15mer peptide mix with TNF, IFN-γ, IL-2, and MIP-1β production, alone and in all combinations, in the same samples as panel A. Wilcoxon p-values for comparison of all response parameters shown in panels A and B for the 68–1-only vaccine to all other vaccines are shown where significant (adjusted for multiple comparisons).
Figure 8.
Figure 8.. Efficacy of differentially programmed RhCMV vectors.
(A-E) Assessment of the outcome of SIV infection after repeated, limiting dose SIVmac239 challenge (see Fig. 6A) of the designated vaccine groups by longitudinal analysis of plasma viral load (left panels) and de novo development of SIVvif-specific CD4+ (middle panels) and CD8+ (right panels) T cell responses. RMs were challenged until the onset of any sustained above-threshold SIVvif-specific T cell response, with the SIV dose administered 2 or 3 weeks prior to the initial response detection considered the infecting challenge (week 0). The n in each panel reflects the total number of RMs with such documented take of SIV infection during the challenge period. RMs with sustained viremia were considered non-protected (black); RMs with no or transient viremia but demonstrating sustained above-threshold SIVvif-specific T cell responses were considered protected (red) (–8). Binomial exact p-values are shown where the proportion of protected RMs in a vaccine group differs significantly from the unvaccinated group. (F) Bone marrow (BM), peripheral lymph node (LN) and peripheral blood mononuclear cell (PBMC) samples from all vaccine-protected RMs (red) and 2 non-protected RMs (black) for comparison (left panel), collected from between day 28 and 56 post-SIV infection, were analyzed by nested, quantitative PCR/RT-PCR for cell-associated SIV DNA and RNA. The dotted line indicates the threshold of detection (B.T. = below threshold) with data points below this line reflecting no positive reactions across all replicates.

Comment in

Similar articles

Cited by

References

    1. Jarvis MA, Hansen SG, Nelson JA, Picker LJ, Früh K, in Cytomegaloviruses: From Molecular Pathogenesis to Intervention Reddehase MJ, Ed. (Caister Academic Press, 2013), vol. 2, chap. 21.
    1. Vieira Braga FA, Hertoghs KM, van Lier RA, van Gisbergen KP, Molecular characterization of HCMV-specific immune responses: Parallels between CD8(+) T cells, CD4(+) T cells, and NK cells. Eur J Immunol 45, 2433–2445 (2015). - PubMed
    1. Klenerman P, Oxenius A, T cell responses to cytomegalovirus. Nat Rev Immunol 16, 367–377 (2016). - PubMed
    1. Masopust D, Picker LJ, Hidden memories: frontline memory T cells and early pathogen interception. J Immunol 188, 5811–5817 (2012). - PMC - PubMed
    1. Picker LJ, Hansen SG, Lifson JD, New paradigms for HIV/AIDS vaccine development. Annu Rev Med 63, 95–111 (2012). - PMC - PubMed

Publication types

MeSH terms