. 2021 Mar 30;118(13):e2025102118.
doi: 10.1073/pnas.2025102118.

A RIPK1-regulated inflammatory microglial state in amyotrophic lateral sclerosis

Affiliations

A RIPK1-regulated inflammatory microglial state in amyotrophic lateral sclerosis

Lauren Mifflin et al. Proc Natl Acad Sci U S A. .

Abstract

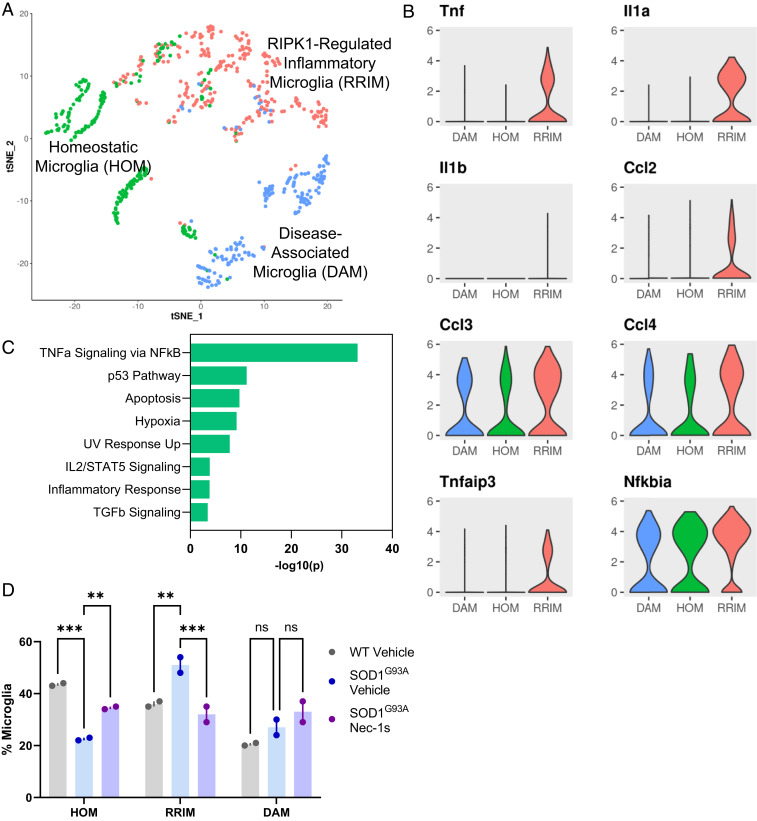
Microglial-derived inflammation has been linked to a broad range of neurodegenerative and neuropsychiatric conditions, including amyotrophic lateral sclerosis (ALS). Using single-cell RNA sequencing, a class of Disease-Associated Microglia (DAMs) have been characterized in neurodegeneration. However, the DAM phenotype alone is insufficient to explain the functional complexity of microglia, particularly with regard to regulating inflammation that is a hallmark of many neurodegenerative diseases. Here, we identify a subclass of microglia in mouse models of ALS which we term RIPK1-Regulated Inflammatory Microglia (RRIMs). RRIMs show significant up-regulation of classical proinflammatory pathways, including increased levels of Tnf and Il1b RNA and protein. We find that RRIMs are highly regulated by TNFα signaling and that the prevalence of these microglia can be suppressed by inhibiting receptor-interacting protein kinase 1 (RIPK1) activity downstream of the TNF receptor 1. These findings help to elucidate a mechanism by which RIPK1 kinase inhibition has been shown to provide therapeutic benefit in mouse models of ALS and may provide an additional biomarker for analysis in ongoing phase 2 clinical trials of RIPK1 inhibitors in ALS.

Keywords: ALS; RIPK1; microglia; neuroinflammation; scRNAseq.


Conflict of interest statement

Competing interest statement: J.Y. is a consultant for Denali Therapeutics and Sanofi. J.Y. and J.M.H. are co-authors on a 2018 Nomenclature review article.

Figures

Fig. 1.
Fig. 1.
scRNAseq of spinal cords in SOD1G93A mouse model of ALS. (A) Schematic summarizing experimental design: whole spinal cords from 3.5-mo-old WT and SOD1G93A littermate male mice (n = 2 per group) treated with either a vehicle control or Nec-1s for 4 wk in drinking water were prepared using Drop-Seq and sequenced. (B) tSNE plot of cells isolated from all groups and identified based on differentially expressed genes generated using Seurat. n = 6 animals. (C) Proportion of each cell population across all samples. n = 6 animals. (D) tSNE plots of cells isolated plotted by group. n = 2 animals per group.
Fig. 2.
Fig. 2.
RIPK1-regulated inflammatory microglia are up-regulated in SOD1G93A mice. (A) tSNE plot of microglia from all groups reclustered in Seurat using semisupervised clustering to identify three subpopulations, including previously identified DAM and HOM. n = 6 animals. (B) Violin plots of marker genes for the RRIM subcluster from all groups generated using Seurat. Values plotted are transcripts per million (TPM). n = 6 animals. (C) GO analysis of pathways enriched in marker genes (padj < 0.01, logFC >1.5) for RRIM subcluster analyzed using GSEA. (D) Proportion of RRIM cluster as a percentage of total microglia was calculated for each animal and quantified using two-way ANOVA with multiple comparison testing relative to SOD1G93A Vehicle group. n = 2 animals per group. **P < 0.01; ***P < 0.001; ns, not significant. Data are represented as mean ± SEM.
Fig. 3.
Fig. 3.
RRIMs are increased in the Optn−/− mouse model of ALS. (A) inDrop isolated spinal cords enriched for CD45+ cells of 3.5-mo-old OptnFl/Fl and Optn−/− male mice (n = 2 per group) treated with either a vehicle control or Nec-1s. tSNE plot of cells isolated from all groups and identified based on differentially expressed genes generated using Seurat. n = 6 animals. (B) tSNE plot of microglia from all Optn groups reclustered in Seurat using semisupervised clustering to identify four subpopulations, including HOM, DAM, and RRIM. n = 6 animals. (C) Violin plots of marker genes for RRIM subcluster from all Optn groups generated using Seurat. Values plotted are TPM. n = 6 animals. (D) GO analysis of pathways enriched in marker genes (padj < 0.01, logFC >1.5) for RRIM subcluster analyzed using GSEA. (E) Proportion of RRIM cluster as a percentage of total microglia were calculated for each animal and quantified using two-way ANOVA with multiple comparison testing relative to Optn−/− Vehicle group. n = 2 animals per group. *P < 0.05; ns, not significant. Data are represented as mean ± SEM. (F) SmartSeq2 prepared scRNAseq of FACS microglia from 3.5-mo-old Optn−/− untreated male mice (n = 2). tSNE plot of all cells generated using Seurat. (G) Volcano plot of transcriptional alterations between RRIM and HOM subclusters in SmartSeq2 Optn dataset. Significant genes indicated in red as logFC > 1.5 and −Log10P ≥ 10.
Fig. 4.
Fig. 4.
Validation of RRIMs in ALS mouse models using in situ hybridization. (A) Fresh-frozen spinal cords from 3.5-mo-old WT and SOD1G93A littermates treated with either vehicle or Nec-1s for 4 wk were sectioned and prepared using RNAscope with the indicated probes, followed by confocal imaging. Representative images from n = 3 mixed gender animals per group; n = 5 to 6 images from ventral horn (1 image per section). (Scale bar, 5 μm.) (B) Fresh-frozen spinal cords from 3.5-mo-old OptnFl/Fl, Optn−/−, and Optn−/−;Ripk1D138N animals were sectioned and prepared using RNAscope with the indicated probes, followed by confocal imaging. Representative images from n = 3 mixed gender animals per group; n = 5 to 6 images from ventral horn (1 image per section). (Scale bar, 5 μm.) (C) Quantification of (A) average of 14 microglia analyzed per image using CellProfiler. n = 3 mixed gender animals per group; n = 5 to 6 images from ventral horn (1 image per section). Two-way ANOVA with multiple comparison testing relative to SOD1G93A Vehicle group. *P < 0.05; **P < 0.01; ***P < 0.001; ns, not significant. Data are represented as mean ± SEM. (D) Quantification of (B) average of 17 microglia analyzed per image using CellProfiler. n = 3 mixed gender animals per group; n = 5 to 6 images from ventral horn (1 image per section). Two-way ANOVA with multiple comparison testing relative to Optn−/− Vehicle group. ****P < 0.0001; ns, not significant. Data are represented as mean ± SEM.
Fig. 5.
Fig. 5.
Validation of RRIMs in ALS mouse models using immunofluorescence. (A) Spinal cords from 4-mo-old WT and SOD1G93A littermates treated with either vehicle or Nec-1s for 4 wk were sectioned and immunostained for TNF, pS166 RIPK1, and IBA1. White arrow indicates representative TNF+pRIPK1+IBA1+ RRIM. n = 3 mixed gender animals per group; n = 5 to 6 images from ventral horn. One-way ANOVA with multiple comparison testing relative to SOD1G93A Vehicle group. **P < 0.01; ***P < 0.001. Data are represented as mean ± SEM. (Scale bar, 20 μm.) (B) Spinal cords from 3.5-mo-old OptnFl/Fl, Optn−/−, and Optn−/−;Ripk1D138N mice were sectioned and immunostained for TNF, pS166 RIPK1, and IBA1. White arrow indicates representative TNF+pRIPK1+IBA1+ RRIM. n = 3 mixed gender animals per group; n = 5 to 6 images from ventral horn. One-way ANOVA with multiple comparison testing relative to Optn−/− Vehicle group. ***P < 0.001. Data are represented as mean ± SEM. (Scale bar, 10 μm.)

References

    1. Ransohoff R. M., How neuroinflammation contributes to neurodegeneration. Science 353, 777–783 (2016). - PubMed
    1. Salter M. W., Stevens B., Microglia emerge as central players in brain disease. Nat. Med. 23, 1018–1027 (2017). - PubMed
    1. Tremblay M. E., et al. ., The role of microglia in the healthy brain. J. Neurosci. 31, 16064–16069 (2011). - PMC - PubMed
    1. Wu Y., Dissing-Olesen L., MacVicar B. A., Stevens B., Microglia: Dynamic mediators of synapse development and plasticity. Trends Immunol. 36, 605–613 (2015). - PMC - PubMed
    1. Hammond T. R., et al. ., Single-cell RNA sequencing of microglia throughout the mouse lifespan and in the injured brain reveals complex cell-state changes. Immunity 50, 253–271.e6 (2019). - PMC - PubMed

Publication types

MeSH terms