. 2021 Apr 1;35(7-8):512-527.
doi: 10.1101/gad.348220.120. Epub 2021 Mar 25.

WWTR1(TAZ)- CAMTA1 gene fusion is sufficient to dysregulate YAP/TAZ signaling and drive epithelioid hemangioendothelioma tumorigenesis

Affiliations

WWTR1(TAZ)- CAMTA1 gene fusion is sufficient to dysregulate YAP/TAZ signaling and drive epithelioid hemangioendothelioma tumorigenesis

Caleb N Seavey et al. Genes Dev. .

Abstract

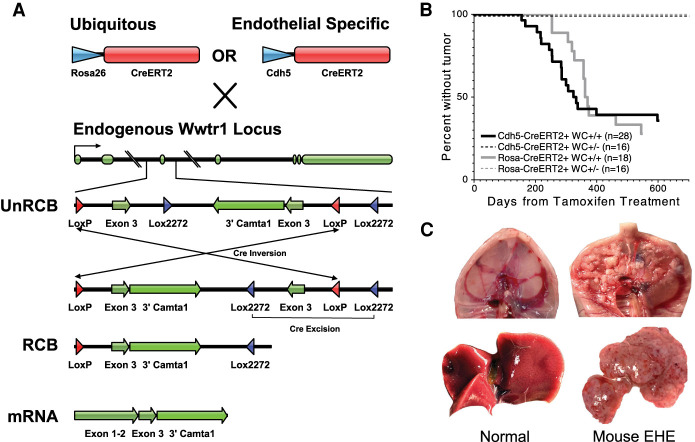
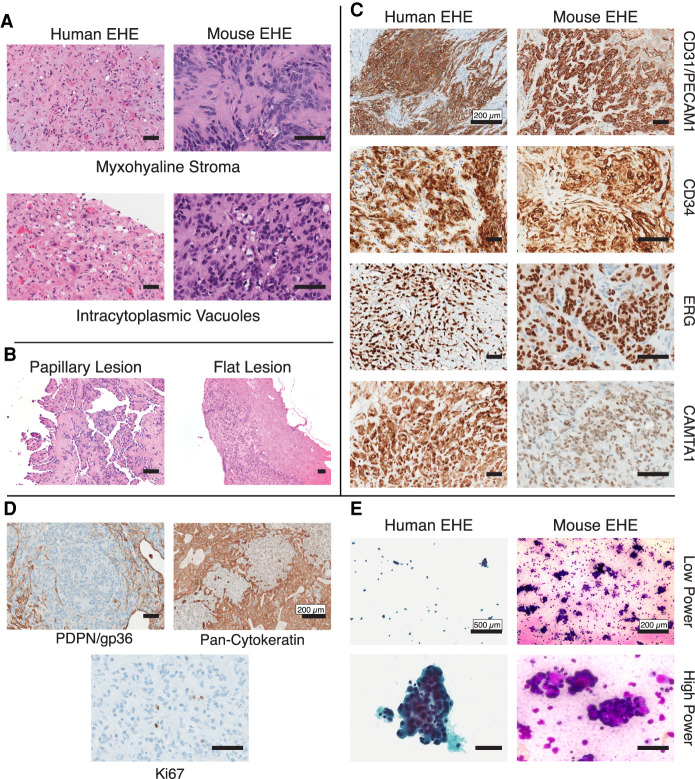
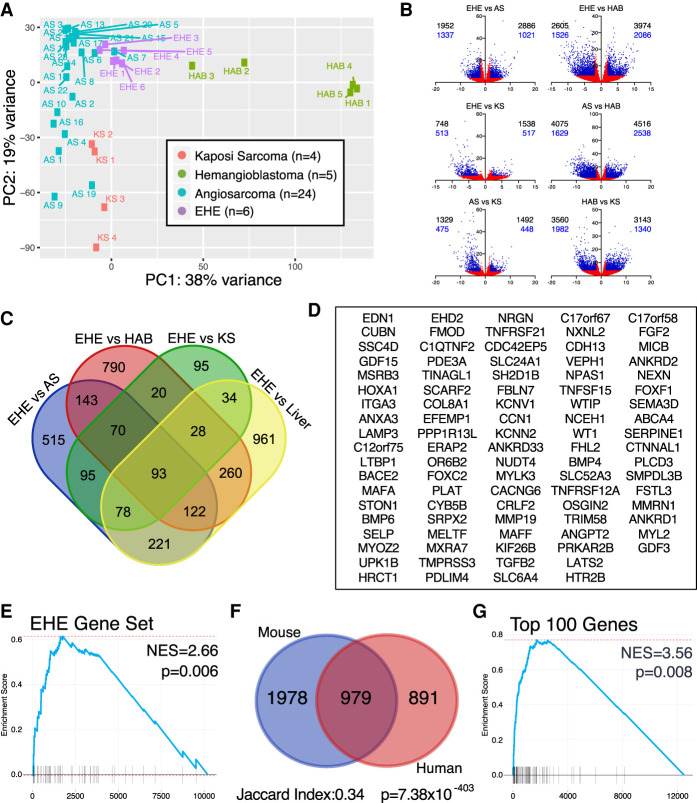
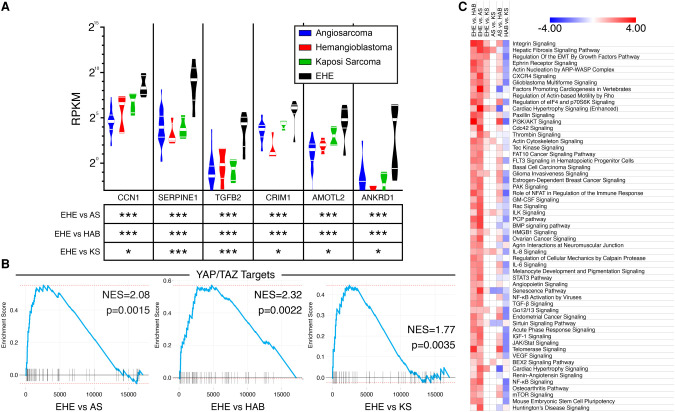
Epithelioid hemangioendothelioma (EHE) is a genetically homogenous vascular sarcoma that is a paradigm for TAZ dysregulation in cancer. EHE harbors a WWTR1(TAZ)-CAMTA1 gene fusion in >90% of cases, 45% of which have no other genetic alterations. In this study, we used a first of its kind approach to target the Wwtr1-Camta1 gene fusion to the Wwtr1 locus, to develop a conditional EHE mouse model whereby Wwtr1-Camta1 is controlled by the endogenous transcriptional regulators upon Cre activation. These mice develop EHE tumors that are indistinguishable from human EHE clinically, histologically, immunohistochemically, and genetically. Overall, these results demonstrate unequivocally that TAZ-CAMTA1 is sufficient to drive EHE formation with exquisite specificity, as no other tumor types were observed. Furthermore, we fully credential this unique EHE mouse model as a valid preclinical model for understanding the role of TAZ dysregulation in cancer formation and for testing therapies directed at TAZ-CAMTA1, TAZ, and YAP/TAZ signaling.

Keywords: FLEx system; Hippo pathway; TAZ-CAMTA1; YAP/TAZ; endothelial cells; epithelioid hemangioendothelioma; fusion gene; mouse models of cancer; sarcoma.


Figures

Figure 1.
Figure 1.
The mouse Wwtr1-Camta1 model produces EHE tumors. (A) Schematic of the mouse model locus and CreERT2 crosses. (UnRCB) Unrecombined allele, (RCB) recombined allele, (exons 1–2) Wwtr1 exons 1–2, (exon 3) Wwtr1 exon 3, (3′Camta1) Camta1 exon 9-stop codon in exon 24 adjoined to a hGH terminator sequence). (B) Kaplan–Meier curve for the development of EHE subdivided based on the number of WC alleles and CreERT2 driver. No tumors developed after tamoxifen treatment in mice with only one WC fusion gene allele and one wild-type Wwtr1 allele. (n) Total number of mice of that genotype. (C) Representative gross pathology images of mouse EHE tumors (right) with corresponding normal tissue for comparison (left). (Top) Peritoneal surface/diaphragmatic lesions (CWC). (Bottom) Liver lesions (RWC).
Figure 2.
Figure 2.
Mouse EHE is histologically identical to human EHE. (A) Representative H&E photomicrographs of both human and mouse EHE displaying the hallmark histologic features of EHE myxohyaline stroma and intracytoplasmic vacuoles. Scale bars, 50 µm. (B) Representative H&E photomicrograph of murine EHE displaying the two morphological phenotypes of peritoneal surface tumors. Scale bars, 50 µm. (C) Immunohistochemical staining of mouse and human EHE for defining IHC stains. The primary antibodies used are listed at the right. Scale bars, 50 µm unless specifically listed. (D) Immunohistochemical staining of mouse EHE for the defining IHC stains. The primary antibodies used are listed below. Scale bars, 50 µm unless specifically listed. (E) Cytology of human and murine EHE at low and high magnification (Left) Human EHE from a pleural effusion (Papanicolaou stain). (Right) Cytopathology of malignant ascites from mouse EHE (Diff Quik staining). Scale bars, 50 µm unless specifically listed.
Figure 3.
Figure 3.
Mouse EHE recapitulates the human transcriptional targets. (A) Principal component analysis of endothelial tumors via pairwise comparisons in DESeq2. (B) Volcano plots of pairwise comparisons between endothelial tumors. (Black numbers) All transcripts, (blue numbers) protein-coding genes, (blue points) log2FC ≥ 2 or log2FC ≤ −2 and FDR ≤ 0.05, (red points) −2 < log2FC < 2 or FDR > 0.05. (C) Venn diagram of genes overexpressed in EHE compared with the three other endothelial tumors and control liver; overexpressed is defined as log2FC ≥ 2 and FDR ≤ 0.05 from DESeq2. (D) Gene set of the 93 genes enriched in human EHE when compared with the three additional endothelial tumors and liver from Figure 4B. (E) GSEA shows that the EHE-specific gene set (90 mouse orthologs of the 93 EHE-specific human genes) is enriched in mouse EHE tumors. GSEA was performed on the gene set obtained after pairwise comparison of mouse EHE with control mouse livers. (NES) Normalized enrichment score. (F) Venn diagram showing the overlap of overexpressed genes in mouse and human EHE tumors compared with their control liver samples. Overexpression cutoff is defined as log2FC ≥ 2 and FDR ≤ 0.05. Jaccard index and hypergeometric P-values for enrichment are listed. (G) GSEA of mouse EHE transcripts in comparison with control mouse liver for the top 100 most overexpressed genes in human EHE in comparison with control human livers. (NES) Normalized enrichment score.
Figure 4.
Figure 4.
Cross endothelial tumor analysis demonstrates enrichment in both YAP/TAZ targets and novel disease-defining pathways in EHE. (A) Violin plots of reads per kilobase per million mapped reads (RPKM) of canonical cancer-related YAP/TAZ target genes in different endothelial tumors. (Thin white bars) 25th percentile and 75th percentile, (thick white bar) median. The table shows false discovery rates from pairwise comparisons of EHE versus other endothelial tumors by DESeq2. (*) FDR < 0.05, (***) FDR < 0.001. (B) GSEA of YAP/TAZ target genes (Cordenonsi YAP targets) from pairwise comparisons of human EHE versus other endothelial tumors. (NES) Normalized enrichment score. (C) Heat map of Z-scores of enriched canonical pathways in EHE versus other endothelial tumors from IPA. Pathways are ranked by the sum of Z-scores across all three comparisons. Color key is listed above. Heat map is truncated. For the full list refer to Supplemental Figure S4.
Figure 5.
Figure 5.
Single-cell RNA sequencing of mouse EHE. (A) 2D UMAP plot of cells of filtered cells with cell population annotations. Insets demonstrate expression of Cdh5 and Pecam1. Color scale: high to low is shown by red to orange to yellow to green to blue. (B) Gene expression heat map of the top 10 most overexpressed genes from each group ranked by FDR values. Color key is listed above. (C) Pie chart of annotated cell populations with corresponding counts. The breakout chart shows counts of each of the individual tumor clusters as identified in E. (D) Volcano plot of EHE-defining genes from Figure 3D in EHE tumor cells. The top overenriched cell targets are labeled. (E) 2D UMAP plot of EHE cells in a tumor subgroup analysis, color-coded based on Seurat cluster. (F) Highly dispersed gene-guided similarity plot with unsupervised hierarchical clustering of endothelium and the seven tumor clusters from Seurat and displayed in E. (G) Enrichment plots of the top 10 most significantly enriched pathways (gene ontology, reactome, and KEGG) based on the top 500 significantly overexpressed and underexpressed genes in each cluster by differential gene expression (iCellR). Bars pointing to the right signify enrichment in the overexpressed gene set, and bars pointing to the left signify enrichment in the underexpressed gene set. (H) Gene expression heat map of normal endothelium and the tumor clusters for known transcription factors that regulate endothelial differentiation. Genes are aligned by unsupervised hierarchical clustering with the associated dendrogram. Color key listed is above.

Similar articles

Cited by

References

    1. Afgan E, Baker D, Batut B, van den Beek M, Bouvier D, Čech M, Chilton J, Clements D, Coraor N, Grüning BA, et al. 2018. The Galaxy platform for accessible, reproducible and collaborative biomedical analyses: 2018 update. Nucleic Acids Res 46: W537–W544. 10.1093/nar/gky379 - DOI - PMC - PubMed
    1. Boopathy GTK, Hong W. 2019. Role of hippo pathway-YAP/TAZ signaling in angiogenesis. Front Cell Dev Biol 7: 49. 10.3389/fcell.2019.00049 - DOI - PMC - PubMed
    1. Carvalho J. 2020. Cell reversal from a differentiated to a stem-like state at cancer initiation. Front Oncol 10: 541. 10.3389/fonc.2020.00541 - DOI - PMC - PubMed
    1. Cordenonsi M, Zanconato F, Azzolin L, Forcato M, Rosato A, Frasson C, Inui M, Montagner M, Parenti AR, Poletti A, et al. 2011. The Hippo transducer TAZ confers cancer stem cell-related traits on breast cancer cells. Cell 147: 759–772. 10.1016/j.cell.2011.09.048 - DOI - PubMed
    1. Driskill JH, Zheng Y, Wu B-K, Wang L, Cai J, Rakheja D, Dellinger M, Pan D. 2021. WWTR1(TAZ)-CAMTA1 Rreprograms endothelial cells to drive epithelioid hemangioendothelioma. Genes Dev (this issue). 10.1101/gad.348221.120 - DOI - PMC - PubMed

Publication types

MeSH terms