. 2021 Apr 1;35(7-8):556-572.
doi: 10.1101/gad.345454.120. Epub 2021 Mar 25.

RAD21 is a driver of chromosome 8 gain in Ewing sarcoma to mitigate replication stress

Affiliations

RAD21 is a driver of chromosome 8 gain in Ewing sarcoma to mitigate replication stress

Xiaofeng A Su et al. Genes Dev. .

Abstract

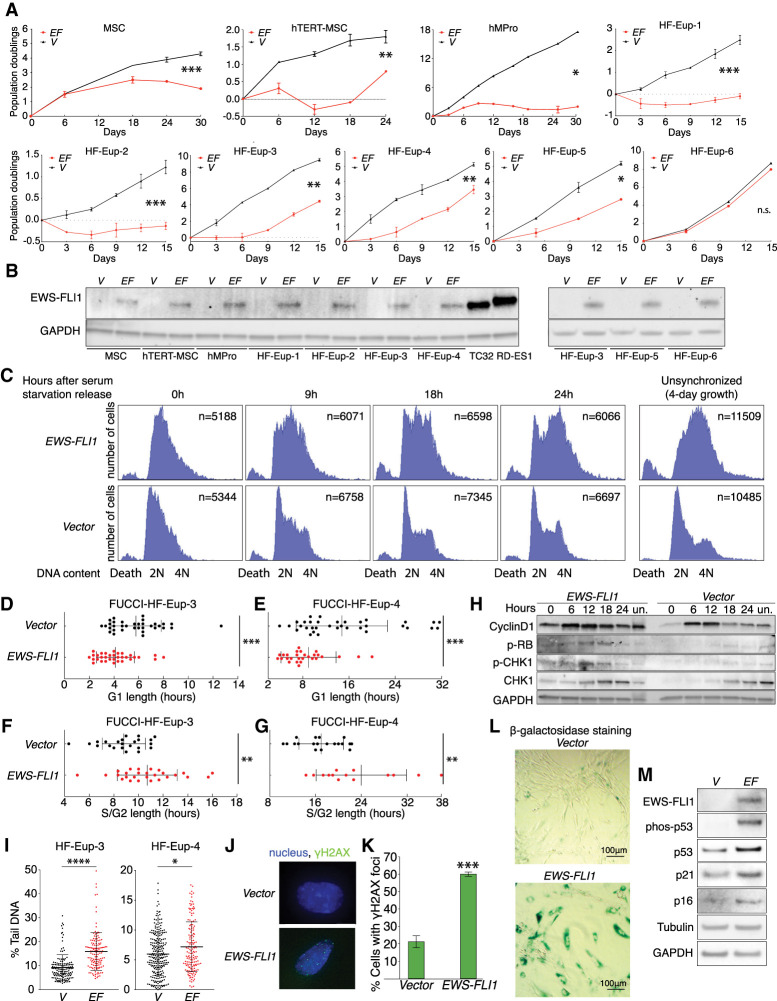
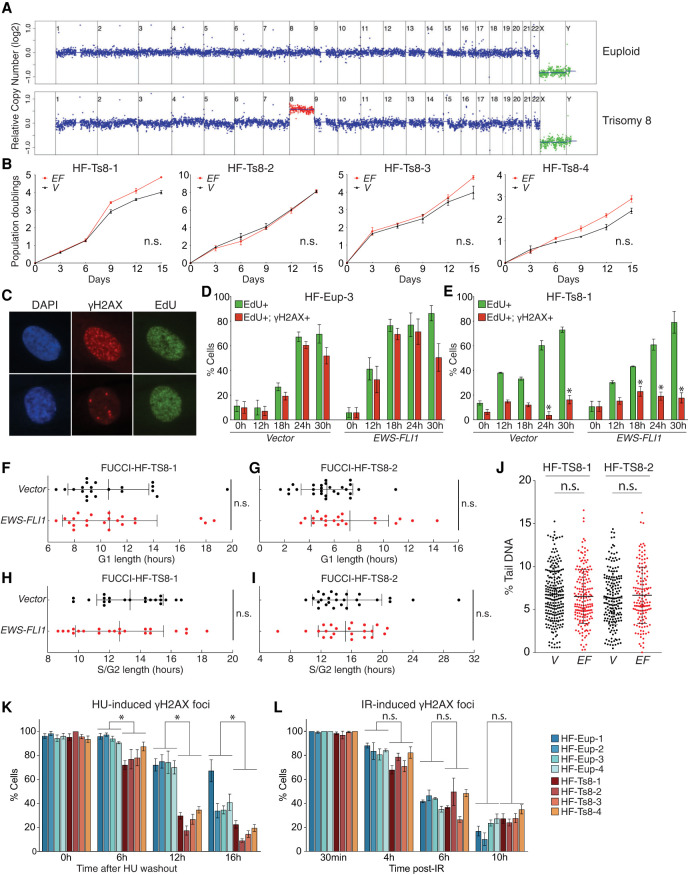
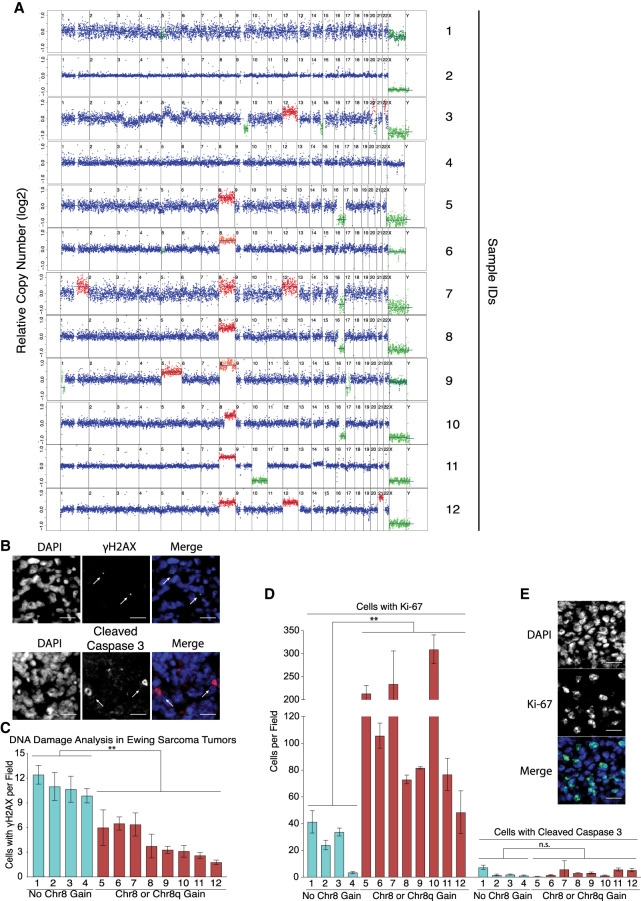
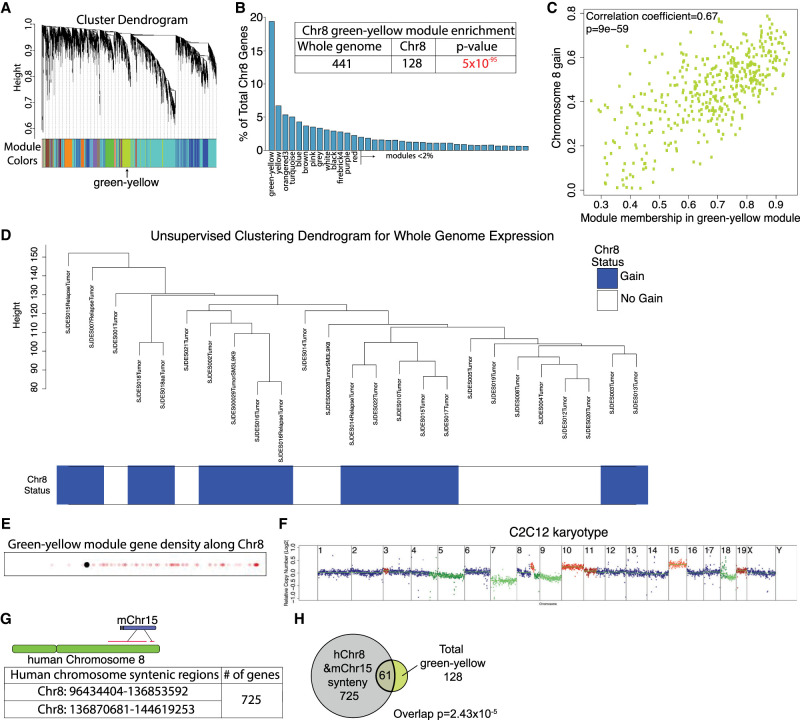
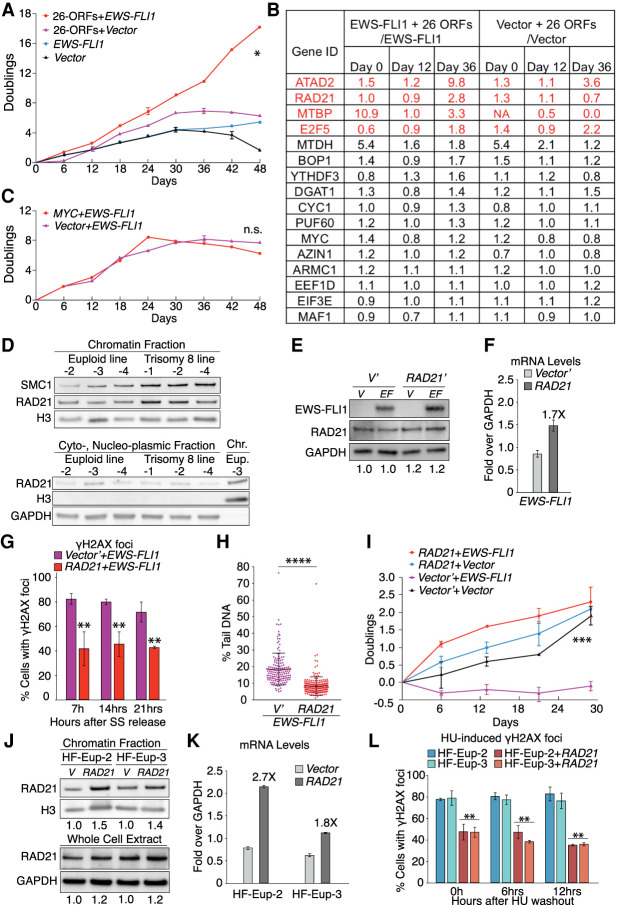
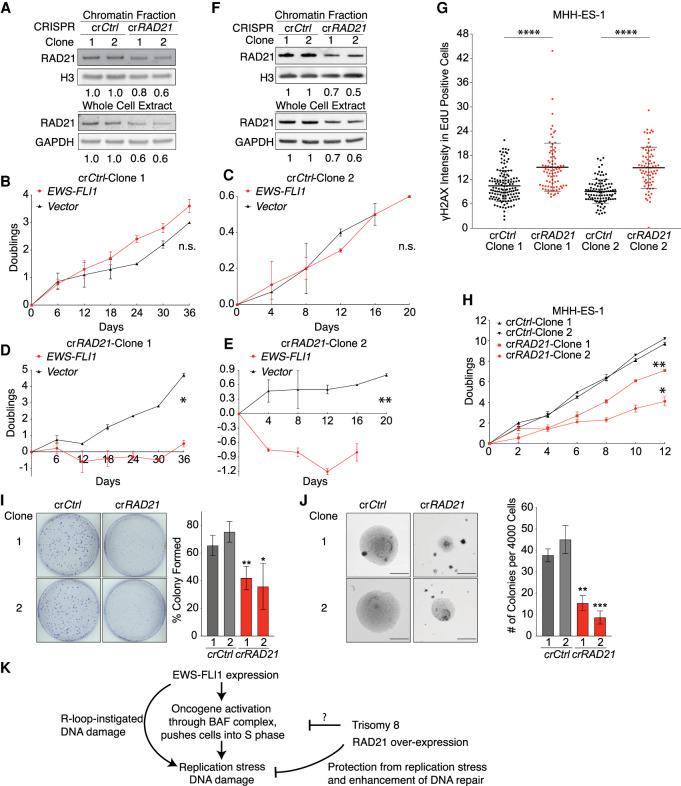
Aneuploidy, defined as whole-chromosome gain or loss, causes cellular stress but, paradoxically, is a frequent occurrence in cancers. Here, we investigate why ∼50% of Ewing sarcomas, driven by the EWS-FLI1 fusion oncogene, harbor chromosome 8 gains. Expression of the EWS-FLI1 fusion in primary cells causes replication stress that can result in cellular senescence. Using an evolution approach, we show that trisomy 8 mitigates EWS-FLI1-induced replication stress through gain of a copy of RAD21. Low-level ectopic expression of RAD21 is sufficient to dampen replication stress and improve proliferation in EWS-FLI1-expressing cells. Conversely, deleting one copy in trisomy 8 cells largely neutralizes the fitness benefit of chromosome 8 gain and reduces tumorgenicity of a Ewing sarcoma cancer cell line in soft agar assays. We propose that RAD21 promotes tumorigenesis through single gene copy gain. Such genes may explain some recurrent aneuploidies in cancer.

Keywords: DNA damage; Ewing sarcoma; RAD21; aneuploidy; cohesin; replication stress; trisomy 8.


Figures

Figure 1.
Figure 1.
EWS-FLI1 expression accelerates S-phase entry and causes replication stress. (A) Proliferation of indicated primary cells was measured after 2–3 d of selection for the presence of the lentivirus. (EF) EWS-FLI1 gene; (V) vector control. Error bars represent standard error of the mean (SEM) of biological duplicates. (*) P < 0.05, (**) P < 0.01, (***) P < 0.001, (n.s.) not significant, linear regression. (B) EWS-FLI1 protein levels in various primary mesenchymal cell lines. GAPDH was used as a loading control. TC32 and RD-ES1 are Ewing sarcoma cell lines. N = 2. A representative picture is shown. (C) DNA content analysis following release of hMPro cells from a serum starvation-induced G1 arrest. (2N) G1 phase, (4N) G2 phase/mitosis, (unsynchronized) DNA content after 4 d of growth, (death) sub-G1 cell population, (n) number of cells analyzed. Experiments were repeated twice, and one set of representative graphs is shown. (DG) Analysis of G1-phase (D,E) and S/G2-phase (F,G) length in human fibroblasts using the FUCCI system. Each dot represents a single cell. Average and standard deviation (SD) are shown. (***) P < 0.001, (**) P < 0.01, two-tailed Wilcoxon test. (H) Euploid human fibroblasts (HF-Eup-3) harboring the indicated lentivirus were released from a serum starvation-induced G1 arrest to determine the levels of cyclin D, phospho-Rb, and CHK1 phospho-CHK1 at the indicated times. Quantifications are shown in Supplemental Figure S2D. (Un) Unsynchronized. N = 3; a representative picture is shown. (I) Degree of DNA damage measured by comet assay in unsynchronized euploid fibroblasts expressing empty vector (V) or the EWS-FLI1 fusion (EF). Each dot represents a single comet. The middle line represents the mean; error bar: SD. (****) P < 0.0001, (*) P < 0.05, two-tailed Wilcoxon test. (J) Examples of EWS-FLI1-expressing hMPro cells harboring γH2AX foci and of control cells lacking foci. DNA in blue; γH2AX foci, green. (KM) hMPro cells expressing the EWS-FLI1 fusion or a vector control were cultured for 8 d and the percentage of cells harboring >10 γH2AX foci (K) and senescence-associated β-galactosidase (L) was analyzed (quantification in Supplemental Fig. S2F). (***) P < 0.001, two-tailed t-test. (M) EWS-FLI1, phospho-p53, total p53, p21, and p16 levels were analyzed in control (V) and EWS-FLI1-expressing hMPro cells. GAPDH and tubulin were used as loading controls. N = 3. A representative picture is shown. Statistics and number of experiments are shown in Supplemental Table S2 (multiple tabs).
Figure 2.
Figure 2.
Trisomy 8 mitigates EWS-FLI1- and HU-induced replication stress. (A) Representative fibroblast karyotypes (with additional examples shown in Supplemental Fig. S1C–F). (B) Proliferation of indicated primary cells measured 2–3 d after selection for the lentivirus. (EF) EWS-FLI1 gene, (V) vector control. Error bars represent SEM of biological duplicates. (n.s.) Not significant, linear regression. (C) Representative examples of EdU-positive, γH2AX-positive cells (>10 foci; top), and EdU-positive, γH2AX-negative cells (<10 foci; bottom). (Green) EdU, (red) γH2AX. (D,E) Analysis of EdU incorporation and γH2AX focus formation in EdU-positive cells in euploid (D) and trisomy 8 (E) fibroblasts following release from a serum starvation-induced G1 arrest. Error bar represents SEM of biological replicates. (*) P < 0.05, two-tailed t-test, comparison between euploid and trisomy 8 cells at the same timepoint; n > 2. (FI) Analysis of G1- or S/G2-phase length in two trisomy 8 fibroblast cultures. Each dot represents a single cell. Average and SD are shown. (n.s.) Not significant, two-tailed Wilcoxon test. (J) Degree of DNA damage measured by comet assay in trisomy 8 fibroblasts expressing empty vector (V) or the EWS-FLI1 fusion (EF). Each dot represents a single comet. The middle line indicates the mean; error bar represents SD. (n.s.) Not significant by two-tailed Wilcoxon test. (K,L) Euploid and trisomy 8 cells were released from a starvation-induced G1 arrest into either medium containing hydroxyurea (HU; 2 mM) and EdU (10 µM), and HU was washed out after 24 h (K), or irradiated with 2 Gy (IR) (L). The percentage of cells harboring >10 γH2AX foci was determined at the indicated times. Error bars represent SEM of biological replicates, n > 2. (*) P < 0.05, (n.s.) not significant, two-tailed nonparametric two-group Mann–Whitney U-test. Statistics and number of experiments are shown in Supplemental Table S2 (multiple tabs).
Figure 3.
Figure 3.
Chromosome 8 gain correlates with reduced number of γH2AX foci and increased proliferation in Ewing sarcomas. (A) Karyotypes of 12 Ewing sarcomas. Median chromosome 8 copy number is shown in Supplemental Table S1. (B) Representative examples of the histological analysis of γH2AX foci (green) and apoptotic cells (cleaved caspase 3; red) in tumor regions, which were identified by the presence of the CD99 epitope on parallel slides by a certified pathologist. The white arrows highlight such cells. DNA is in blue. Scale bar, 100 µm. (C) Cells harboring γH2AX foci (one or more large focus) but not cleaved caspase 3 were quantified in Ewing sarcoma samples. Chromosome 8 copy number status (from A) is indicated below. Error bars represent SEM of at least three fields. At least 1500 nuclei were evaluated. (**) P < 0.01, two-tailed nonparametric two-group Mann–Whitney U-test. (D) Cells harboring Ki-67 or cleaved caspase 3 were determined in Ewing sarcoma samples. Error bars represent SEM of at least three fields. At least 1500 nuclei were evaluated. (**) P < 0.01, (n.s.) not significant, two-tailed nonparametric two-group Mann–Whitney U-test. (E) Example of cells expressing Ki-67 (green). Scale bar, 100 µm.
Figure 4.
Figure 4.
A method to identify genes that mediate the chromosome 8 fitness benefit in EWS-FLI1-expressing cells. (A) Modules identified by hierarchical clustering and dynamitic tree cutting by WGCNA. Lines represent the hierarchical height of each gene in a cluster. Each color represents a module. The green–yellow module is identified. (B) Modules were rank-ordered based on the number of chromosome 8-encoded genes, shown as the percentage of total chromosome 8-encoded genes. The inset table shows the significant enrichment of chromosome 8-encoded genes in the green–yellow model (hypergeometric test). (C) Membership in the green–yellow module, as defined by relatedness of expression patterns in Ewing tumors, was correlated with gain of chromosome 8. (D) Unsupervised hierarchical clustering of expression patterns (WGCNA) in Ewing sarcoma samples using whole-genome expression data. Tumor sample names and annotations in the hierarchical tree are listed in Supplemental Table S3. (E) Location of genes of the green–yellow module on chromosome 8. Each semitransparent dot represents the location of a gene. The graph was made using the gene density visualizer tool (see the Supplemental Material). The black dot represents the centromere. (F) Karyotype of the C2C12 mouse myoblast cell line expressing the EWS-FLI1 fusion. (G) Synteny analysis between human chromosome 8 and mouse chromosome 15. Genes are listed in Supplemental Table S4. (H) Overlap between 128 chromosome 8-encoded genes of the green–yellow module and the 725 genes syntenic between human chromosome 8 and mouse chromosome 15 (hypergeometric test).
Figure 5.
Figure 5.
An evolutionary approach reveals RAD21 to be limiting for mitigating EWS-FLI1-induced replication stress. (A) Primary hMPro cells were infected at passage 7 (P7). Proliferation was measured 2–3 d after transduction of cells with the indicated lentiviral constructs. Error bars represent SEM of biological duplicates. Expression of genes in the 26-ORF library was measured at days 0, 12, and 36. (*) P < 0.05, linear regression. (B) Fold change expression of members of the 26-ORF library was determined in relation to cells that were not transduced with the library. Genes whose expression increased over time by greater than twofold are highlighted in red. (NA) Not analyzed (no detectable transcript in control cells). (C) Proliferation of hMPro cells harboring the indicated lentiviral constructs was measured 2–3 d after transduction. Error bar represents SEM of biological duplicates. (n.s.) Not significant, linear regression. (D) Chromatin association of the cohesin subunits RAD21 and SMC1 was determined by chromatin fractionation in the indicated fibroblast lines. The chromatin protein histone H3 (H3) and the cytoplasmic protein GAPDH in fractions served as controls. (Chr.) Chromatin fraction, (Eup.) euploid. N = 2; representative pictures are shown. (E,F) RAD21 protein (E) and mRNA (F) levels in control and EWS-FLI1-expressing euploid fibroblasts (HF-Eup-3) 8 d after transduction with a lentivirus expressing RAD21 from the CMV promoter. Numbers below the blot in E indicate degree of overexpression relative to vector transduced cells. Western blot: n = 2, with representative picture shown. RT-qPCR: error bar represents SEM of technical duplicates. We note that EWS-FLI1 protein levels were increased in cells overexpressing RAD21, presumably because increased RAD21 expression allows cells expressing higher levels of EWS-FLI1 to proliferate better. (G) Euploid fibroblasts (HF-Eup-3) were transduced with the indicated lentiviral constructs, and the percentage of EdU-positive cells harboring γH2AX foci (>10 foci/nucleus) was determined following release from a serum starvation-induced G1 arrest. Error bar represents SEM of biological replicates. (**) P < 0.01, two-tailed t-test; n > 2. (H) Assessment of DNA damage by comet assay in EWS-FLI1-expressing euploid fibroblasts (HF-Eup-3) expressing RAD21 or empty vector (V′). Each dot represents a single comet. The middle line represents the mean; error bars, SD. (****) P < 0.0001, two-tailed Wilcoxon test. (I) Proliferation of euploid fibroblasts (HF-Eup-3) transduced with the indicated lentiviral constructs was determined as described in Figure 1A. Error bars represent SEM of biological duplicates. (***) P < 0.001, linear regression. (J,K) Chromatin associated and total RAD21 protein (J) and mRNA (K) levels in control euploid cells and euploid fibroblasts expressing RAD21 from the CMV promoter. Numbers below the blots in J indicate degree of overexpression relative to vector transduced cells. Western blot: n = 2, with representative picture shown. RT-qPCR: error bar represents SEM of technical duplicates. (L) Cells characterized in J and K were released from a serum starvation-induced G1 arrest into medium containing 2 mM HU. The percentage of EdU-positive cells harboring γH2AX foci was determined at the indicated times following HU washout. Error bar represents SEM of biological replicates; n > 2. (**) P < 0.01, two-tailed t-test, comparison between the same types of fibroblasts. Statistics and number of experiments are shown in Supplemental Table S2 (multiple tabs).
Figure 6.
Figure 6.
Three copies of RAD21 are required for mitigating EWS-FLI1-induced replication stress in primary cells and in a Ewing sarcoma cell line. (A,F) Chromatin associated and total RAD21 protein in trisomy 8 fibroblasts (HF-Ts8-1) (A) and the MHH-ES1 cancer cell line (F) targeted with control (crCtrl) or RAD21 (crRAD21) CRISPR constructs. Numbers underneath the blot indicate down-regulation relative to vector transduced cells. (crCtrl) Transfected with control CRISPR construct, (crRAD21) transfected with RAD21 CRISPR targeting construct, resulting in one of three copies of RAD21 deletion. Same nomenclature is used for all figures below. (BE) Trisomy 8 fibroblasts (HF-Ts8-1) were transfected with control or RAD21 CRISPR targeting constructs, resulting in the generation of trisomy 8 fibroblasts with three (B,D) or two (C,E) copies of RAD21. Cells were then transduced with control or EWS-FLI1-expressing lentiviruses, and proliferation was measured after 3–4 d of selection for lentiviral constructs. Error bars represent SEM of biological duplicates. (*) P < 0.05, (**) P < 0.01, (n.s.) not significant, linear regression. (G) Exponential growing MHH-ES1 cells were pulse-labeled with EdU for 1 h. The intensity of γH2AX signal in EdU-positive cells was determined relative to the background signal. Note that 10-foci criteria were not applied here because MHH-ES1 cells harbored an extremely high number of γH2AX foci. Each dot represents a single cell. The middle line represents the mean; error bar represents SD. (****) P < 0.00001, by two-tailed Wilcoxon test. (H,I) Two independent MHH-ES1 clones ([1] clone 1, [2] clone 2) carrying two copies of RAD21 (crRAD21) show reduced proliferation (H) and form fewer colonies (I) than MHH-ES1 cells carrying three copies. (crCtrl) Control. (H) (*) P < 0.05, (**) P < 0.01, linear regression. (I) Error bars represent SEM of biological replicates. (**) P < 0.01, (*) P < 0.05, two-tailed t-test, comparison between crCtrl and crRAD21 cells within the same clone number; n = 4. (J) Two independent MHH-ES1 clones ([1] clone 1, [2 clone 2) carrying two copies of RAD21 (crRAD21) show reduced anchorage-independent proliferation, forming smaller (left pictures; scale bars, 300 µm) and fewer colonies (right graph). Error bars represent SEM of biological replicates. (**) P < 0.01, (***) P < 0.001, by two-tailed t-test, comparison between crCtrl and crRAD21 within the same clone number; n = 3. (K) A model for how trisomy 8 contributes to Ewing sarcomagenesis. R-loop-instigated DNA damage is from Gorthi et al. (2018). See the text for details. Statistics and number of experiments are shown in Supplemental Table S2 (multiple tabs).

Similar articles

Cited by

References

    1. Abe T, Sakaue-Sawano A, Kiyonari H, Shioi G, Inoue K, Horiuchi T, Nakao K, Miyawaki A, Aiszawa S, Fujimori T. 2013. Visualization of cell cycle in mouse embryos with Fucci2 reporter directed by Rosa26 promoter. Development 140: 237–246. 10.1242/dev.084111 - DOI - PubMed
    1. Anderson ND, de Borja R, Young MD, Fuligni F, Rosic A, Roberts ND, Hajjar S, Layeghifard M, Novokmet A, Kowalski PE, et al. 2018. Rearrangement bursts generate canonical gene fusions in bone and soft tissue tumors. Science 361: eaam8419. 10.1126/science.aam8419 - DOI - PMC - PubMed
    1. Ben-David U, Ha G, Khadka P, Jin X, Wong B, Franke L, Golub TR. 2016. The landscape of chromosomal aberrations in breast cancer mouse models reveals driver-specific routes to tumorigenesis. Nat Commun 7: 12160. 10.1038/ncomms12160 - DOI - PMC - PubMed
    1. Benedict B, van Schie JJM, Oostra AB, Balk JA, Wolthuis RMF, Riele HT, de Lange J. 2020. WAPL-dependent repair of damaged DNA replication forks underlies oncogene-induced loss of sister chromatid cohesion. Dev Cell 52: 683–698.e7. 10.1016/j.devcel.2020.01.024 - DOI - PubMed
    1. Beroukhim R, Mermel CH, Porter D, Wei G, Raychaudhuri S, Donovan J, Barretina J, Boehm JS, Dobson J, Urashima M, et al. 2010. The landscape of somatic copy-number alteration across human cancers. Nature 463: 899–905. 10.1038/nature08822 - DOI - PMC - PubMed

Publication types

MeSH terms

Supplementary concepts

LinkOut - more resources