. 2021 Apr 1;35(7-8):495-511.
doi: 10.1101/gad.348221.120. Epub 2021 Mar 25.

WWTR1(TAZ)-CAMTA1 reprograms endothelial cells to drive epithelioid hemangioendothelioma

Affiliations

WWTR1(TAZ)-CAMTA1 reprograms endothelial cells to drive epithelioid hemangioendothelioma

Jordan H Driskill et al. Genes Dev. .

Abstract

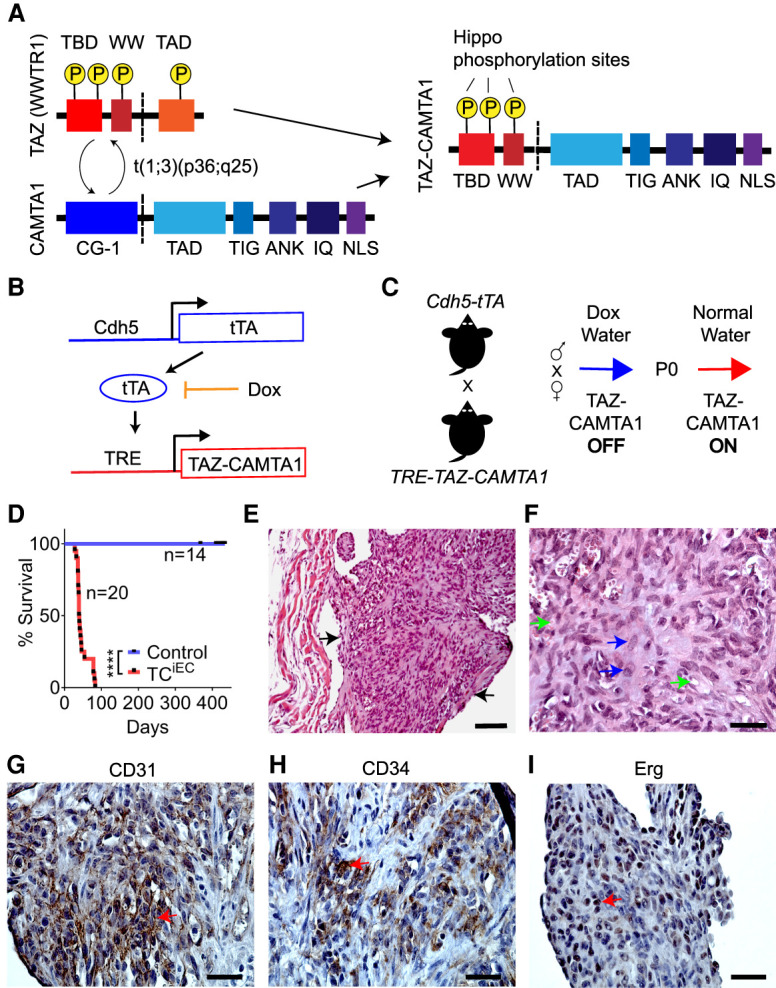
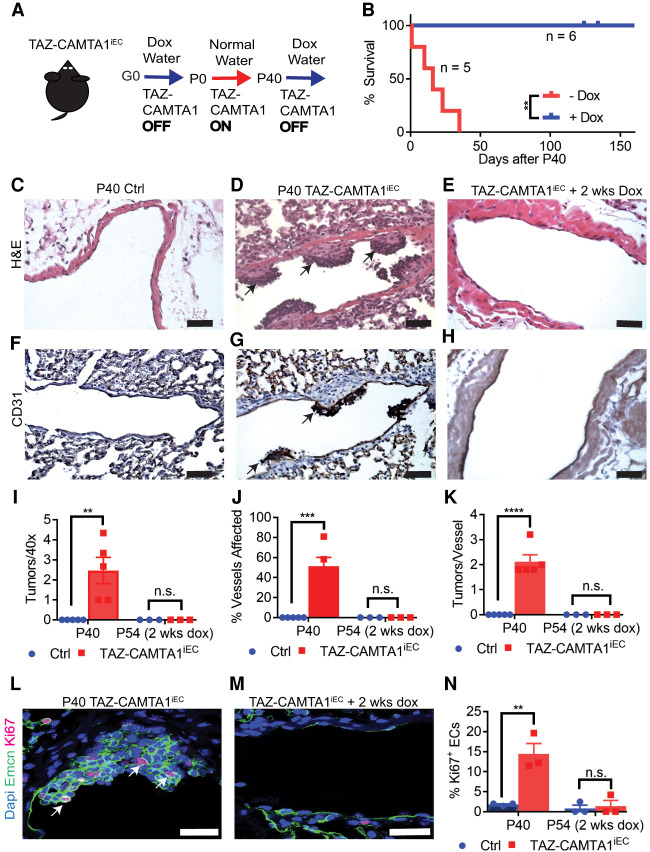
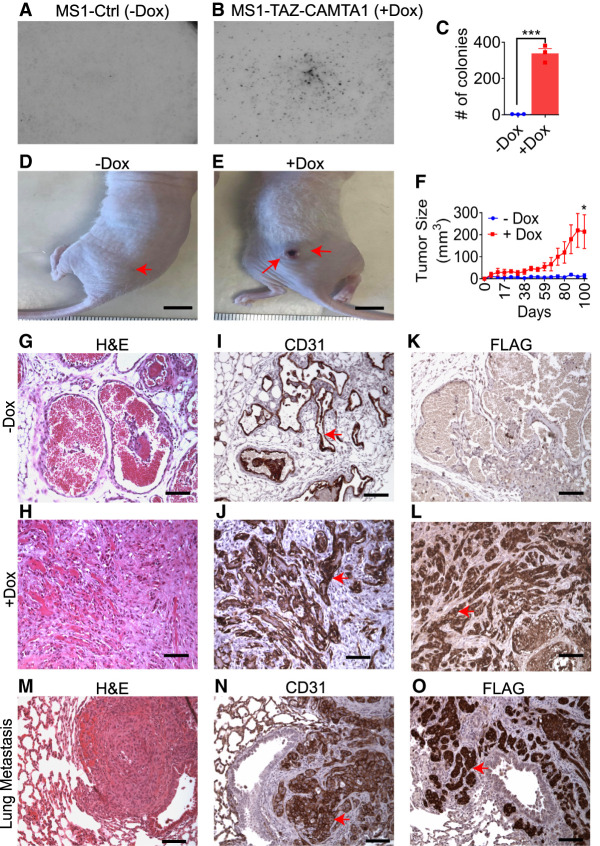
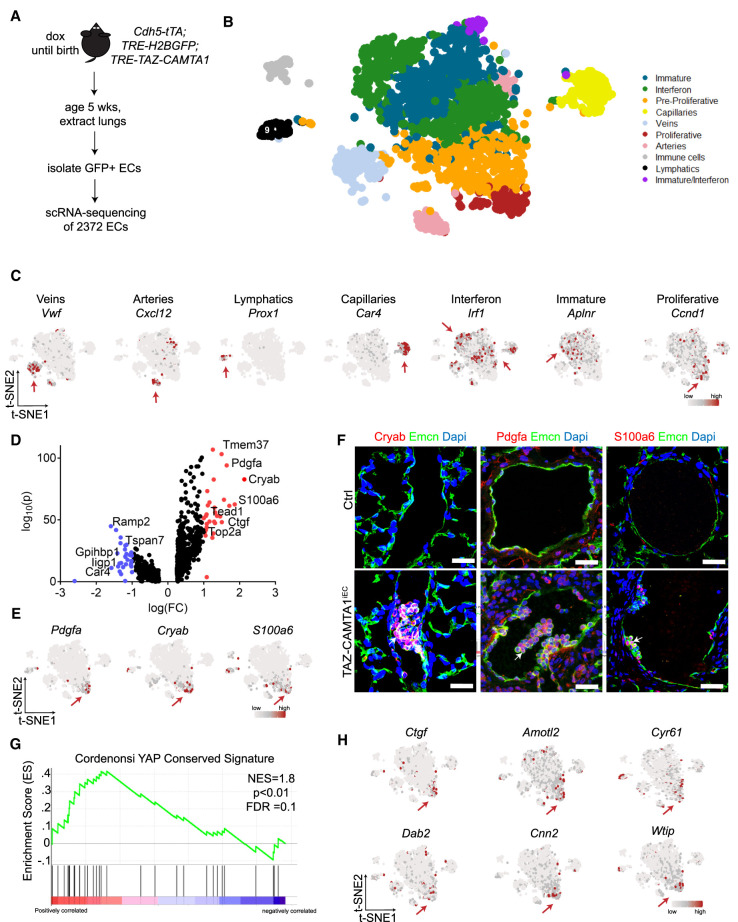
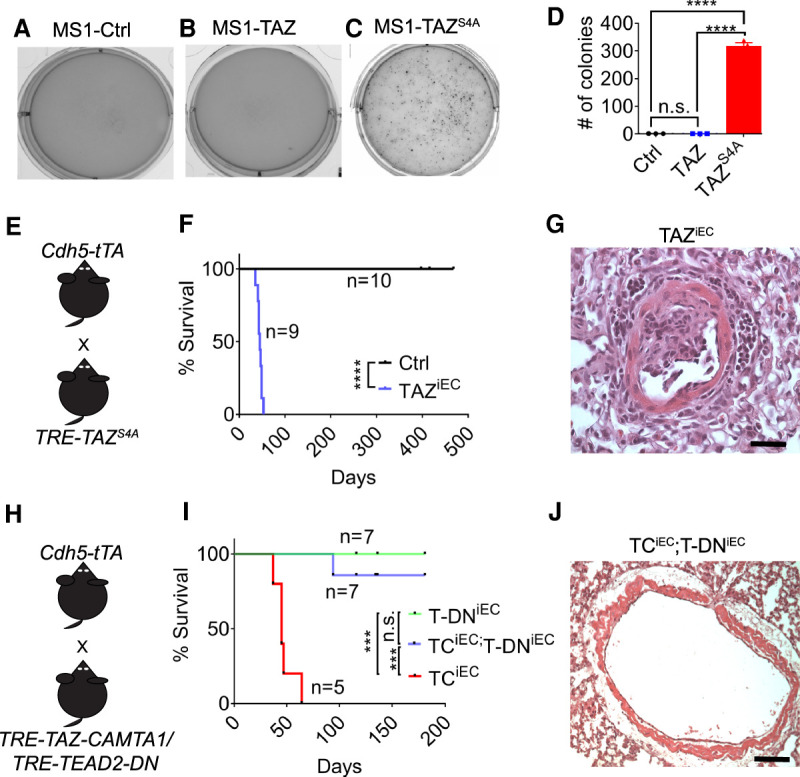
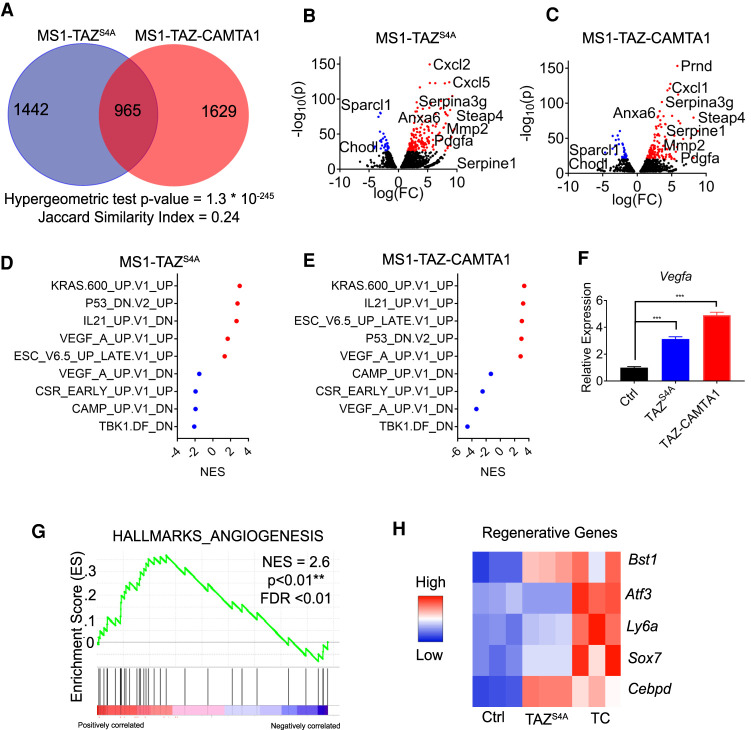
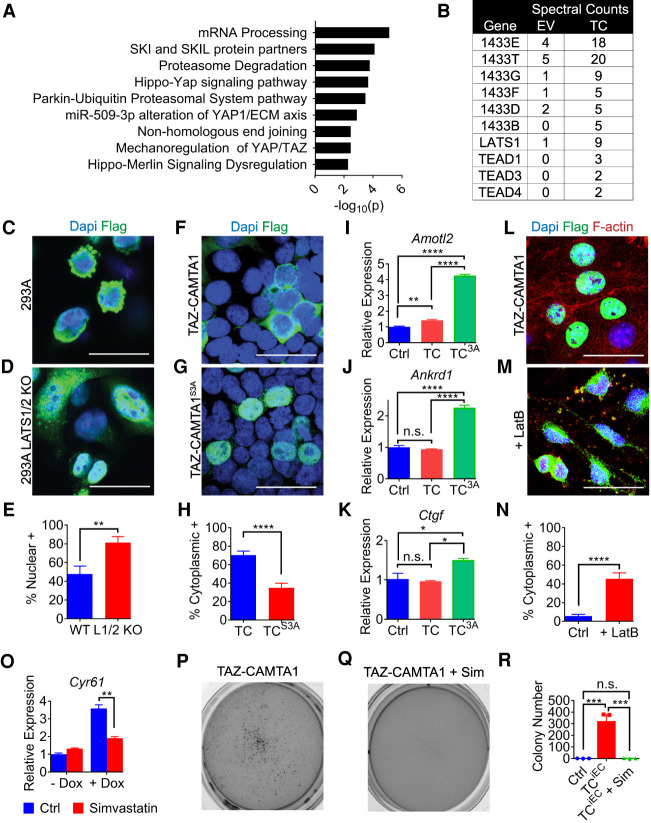
Epithelioid hemangioendothelioma (EHE) is a poorly understood and devastating vascular cancer. Sequencing of EHE has revealed a unique gene fusion between the Hippo pathway nuclear effector TAZ (WWTR1) and the brain-enriched transcription factor CAMTA1 in ∼90% of cases. However, it remains unclear whether the TAZ-CAMTA1 gene fusion is a driver of EHE, and potential targeted therapies are unknown. Here, we show that TAZ-CAMTA1 expression in endothelial cells is sufficient to drive the formation of vascular tumors with the distinctive features of EHE, and inhibition of TAZ-CAMTA1 results in the regression of these vascular tumors. We further show that activated TAZ resembles TAZ-CAMTA1 in driving the formation of EHE-like vascular tumors, suggesting that constitutive activation of TAZ underlies the pathological features of EHE. We show that TAZ-CAMTA1 initiates an angiogenic and regenerative-like transcriptional program in endothelial cells, and disruption of the TAZ-CAMTA1-TEAD interaction or ectopic expression of a dominant negative TEAD in vivo inhibits TAZ-CAMTA1-mediated transformation. Our study provides the first genetic model of a TAZ fusion oncoprotein driving its associated human cancer, pinpointing TAZ-CAMTA1 as the key driver and a valid therapeutic target of EHE.

Keywords: CAMTA1; Hippo pathway; TAZ; YAP; cancer; endothelial cells; epithelioid hemangioendothelioma; gene fusion; vascular anomalies; vascular malformations.


Figures

Figure 1.
Figure 1.
TAZ-CAMTA1 expression in endothelial cells drives the formation of EHE-like vascular tumors in the lungs of mice. (A) Structure of TAZ, CAMTA1, and the resulting TAZ-CAMTA1 fusion protein formed from the t(1;3)(p36;q25) chromosomal translocation. TAZ-CAMTA1 contains the N terminus of TAZ with its TEAD-binding domain (TBD), WW domain, and three LATS1/2 phosphorylation sites, and the C terminus of CAMTA1 with its transcription activation domain (TAD), TIG domain, ankyrin repeats (ANK), IQ motifs, and a nuclear localization signal (NLS). TAZ-CAMTA1 has lost the TAD of TAZ, one of TAZ's LATS1/2 phosphorylation sites, and the CG-1 domain of CAMTA1. (B) Schematics of the Cdh5-tTA and TRE-TAZ-CAMTA1 alleles for endothelial-specific expression of TAZ-CAMTA1. (C) Schematic for induction of TAZ-CAMTA1 expression after birth. (D) Survival curve for Ctrl (single transgenic Cdh5-tTA or TRE-TAZ-CAMTA1 mice, n = 14, median survival = undefined) or TAZ-CAMTA1iEC mice (Cdh5-tTA;TRE-TAZ-CAMTA1, n = 20, median survival = 39.5 d). (****) P < 0.0001, Mantel-Cox test. (EI) Representative images showing H&E (E,F), CD31 (G), CD34 (H), and Erg (I) immunohistochemistry of a tumor found within a vessel of the lungs of 7-wk-old TAZ-CAMTA1iEC mice. Black arrows in E point to the tumor, and blue arrows in F show plump spindled and epithelioid cells, while green arrows show cytoplasmic vacuoles, some with red blood cells. Red arrows in GI show positive staining for the respective markers. Scale bars: E, 100 µm; F––I, 35 µm.
Figure 2.
Figure 2.
TAZ-CAMTA1 is required for tumor progression and maintenance. (A) Schematic for removal of TAZ-CAMTA1 transgene expression after tumor formation. (B) Survival curve for mice that were maintained on doxycycline water (median survival = undefined, n = 6) or normal water (median survival = 16 d, n = 5) after P40. (**) P < 0.01, Mantel-Cox test. (CH) H&E (CE) and CD31 immunostaining (FH) of Ctrl (C,F), TAZ-CAMTA1iEC (D,G), and TAZ-CAMTA1iEC mice given doxycycline for 2 wk (E,H). All P40 TAZ-CAMTA1iEC mice (n = 5) exhibited tumors, while no P40 Ctrl mice (n = 5) or P54 TAZ-CAMTA1iEC mice (receiving 2 wk of doxycycline after P40, n = 3) had any lung tumors. Black arrows point to examples of tumors within blood vessels. Scale bar, 50 µm. (I) Quantification of tumors observed per 40× field of view in P40 Ctrl (0 ± 0, n = 5), P40 TAZ-CAMTA1iEC (2.5 ± 0.7, n = 5, [**] P = 0.01), P54 Ctrl (0 ± 0, n = 3), or P54 TAZ-CAMTA1iEC mice (0 ± 0, n = 3, P > 0.05). (J) Quantification of noncapillary vessels affected in P40 Ctrl (0% ± 0, n = 5), P40 TAZ-CAMTA1iEC (51.3% ± 8.9, n = 5, [***] P < 0.001), P54 Ctrl (0% ± 0, n = 3), or P54 TAZ-CAMTA1iEC mice (0% ± 0, n = 3, P > 0.05). (K) Quantification of independent tumors observed per vessel in P40 Ctr (0 ± 0, n = 5), P40 TAZ-CAMTA1iEC (2.1 ± 0.3, n = 5, [****] P < 0.0001), P54 Ctrl (0 ± 0, n = 3), or P54 TAZ-CAMTA1iEC mice (0 ± 0, n = 3, P > 0.05). (LN) Endomucin (Emcn) and Ki67 immunofluorescence of P40 and P54 TAZ-CAMTA1iEC vessels. P40 TAZ-CAMTA1iEC (14.4 ± 2.6, n = 3) vessels had significantly more Ki67 positivity than Ctrl (1.8 ± 0.2, n = 3, [**] P < 0.01), while P54 TAZ-CAMTA1iEC (1.4 ± 1.4, n = 3) vessels had no difference in Ki67 positivity compared with control (0.8 ± 0.8, n = 3, P > 0.05). White arrows point to Ki67+Emcn+ endothelial cells. Scale bars, 25 µm. All data are presented as mean ± S.E.M, and P-values were calculated with unpaired t-tests.
Figure 3.
Figure 3.
TAZ-CAMTA1 is highly tumorigenic in endothelial cells. (AC) Ctrl (−Dox) (3.3 colonies ± 0.7, n = 3) or TAZ-CAMTA1-expressing (+Dox) (338 colonies ± 27.1, n = 3) MS1 cells grown on soft agar. TAZ-CAMTA1 expression significantly increased the colony forming ability of MS1 cells on soft agar. (***) P < 0.001. (D,E) Representative images of tumors established in nude mice from Ctrl (−Dox) or TAZ-CAMTA1-expressing (+Dox) MS1 cells. Scale bar, 1 cm. Red arrows point to tumors. (F) Growth curve of tumors formed from Ctrl (13.4 ± 8.9, n = 5) or TAZ-CAMTA1-expressing (213.8 ± 76.7, n = 5) MS1 cells. (*) P < 0.05. Values represent final time point, day 100. All values are mean ± SEM, and P-value was calculated with an unpaired t-test. (GL) Representative H&E (G,H), CD31 (I,J), and FLAG (K,L) immunohistochemistry of tumors derived from Ctrl (−Dox) (G,I,K) or TAZ-CAMTA1-expressing (+Dox) (H,J,L) MS1 cells. Red arrows point to positive immunostaining. Scale bars,100 µm. (MO) Representative H&E (M), CD31 (N), and FLAG (O) immunohistochemistry of a lung metastasis identified in a nude mouse injected subcutaneously with MS1 cells expressing TAZ-CAMTA1. Red arrows point to positive immunostaining. Scale bars,100µm.
Figure 4.
Figure 4.
TAZ-CAMTA1 drives a proliferative endothelial cell population with a YAP/TAZ target gene signature. (A) Schematic for isolation of lung ECs for scRNA-seq. (B) t-SNE plot of clusters of cells observed from scRNA-seq. (C) t-SNE plots showing expression of various marker genes. Red arrows point to cluster showing positive expression. (D) Volcano plot of 806 differentially expressed genes in TAZ-CAMTA1-induced proliferative subpopulation. Wilcoxon rank sum test, adjusted P-value < 0.05. Genes in red have a log(FC) > 1 and genes in blue have a log(FC) < 1. Some pertinent genes and their corresponding points are marked. (E) t-SNE plots of markers from proliferative subpopulation. (F) Immunostaining validation of differentially expressed genes identified from scRNA-seq analysis. White arrows point to positive staining of Pdgfa, Cryab, or S100a6 in P40 TAZ-CAMTA1iEC but not Ctrl lung vessels. Scale bars, 25 µm. (G) GSEA plot showing normalized enrichment score (NES) of YAP-conserved signature in the proliferative subpopulation, NES = 1.8. P < 0.01, FDR = 0.1. (H) t-SNE plots of canonical YAP/TAZ target genes. Red arrows point to the proliferative cluster showing high expression of these genes.
Figure 5.
Figure 5.
TAZS4A phenocopies TAZ-CAMTA1, and TAZ-CAMTA1 requires the TEAD family of transcription factors to drive tumorigenesis. (AD) Representative images of Ctrl (1.0 ± 0.1, n = 3), TAZ (0.7 ± 0.1, n = 3), or TAZS4A-expressing (318.6 ± 11.3, n = 3) MS1 cells growing in soft agar. Only TAZS4A is sufficient to promote anchorage-independent growth. (****) P < 0.0001, one-way ANOVA with post-hoc Tukey test. (E) Schematic for generation of endothelial-specificTAZS4A (TAZiEC) transgenic mice. (F) Survival curve for Ctrl (median survival = undefined, n = 10) and TAZiEC (median survival = 45 days, n = 9) mice. (****) P < 0.0001, Mantel-Cox test. (G) Representative H&E of tumor located in noncapillary vessel of a P35 TAZiEC mouse. Scale bar, 35 µm. (H) Schematic for generation of TRE-TEAD2DN;Cdh5-tTA (T-DNiEC) and TRE-TEAD2DN;TRE-TAZ-CAMTA1;Cdh5-tTA (TCiEC;T-DNiEC) transgenic mice. (I) Survival curve of T-DNiEC mice (median survival = undefined, n = 7), TAZ-CAMTA1iEC mice (median survival = 45 d, n = 5), and TEAD2DNiEC, TAZ-CAMTA1iEC mice (median survival = undefined, n = 7). (***) P < 0.001, Mantel-Cox test. (J) Representative H&E of a vessel in a TCiEC;T-DNiEC mouse showing the absence of any vascular tumors. Scale bar, 100 µm. None of the TCiEC;T-DNiEC mice examined (n = 3) showed lung tumors at P40.
Figure 6.
Figure 6.
TAZ-CAMTA1 and TAZS4A drive a gene program associated with angiogenesis and regeneration. (A) Number of differentially expressed genes (DEG; FDR < 0.01) in MS1 cells expressing TAZS4A or TAZ-CAMTA1 as compared with control MS1 cells. Overlapped region indicates genes expressed in both populations. Hypergeometric test P-value and Jaccard index are indicated. (BC) Volcano plot of DEGs of TAZS4A or TAZ-CAMTA1. Red (overexpressed) and blue (underexpressed) are genes with −log10(p) > 25. (D,E) Normalized enrichment scores (NES) for selected oncogenic pathways in MS1 cells expressing TAZS4A or TAZ-CAMTA1 as determined by GSEA. Red indicates positive enrichment and blue indicates negative enrichment. (F) qPCR for Vegfa expression in control MS1 cells (1.0 ± 0.0, n = 3) and MS1 cells expressing TAZS4A (3.1 ± 0.1, n = 3) or TAZ-CAMTA1 (4.9 ± 0.1, n = 3). (***) P < 0.001. one-way ANOVA with post-hoc Tukey test. All data are mean ± SEM. (G) Enrichment of an angiogenesis gene signature in TAZ-CAMTA1-expressing MS1 cells, NES = 2.6. (**) P < 0.01, FDR < 0.01. (H) Heat map showing expression of selected regenerative endothelial cell markers in TAZS4A- or TAZ-CAMTA1-expressing MS1 cells.
Figure 7.
Figure 7.
TAZ-CAMTA1 is still susceptible to regulation by the Hippo pathway. (A) Gene ontology plot of TAZ-CAMTA1-binding proteins identified by mass spectrometry. (B) Spectral counts of Hippo pathway-related proteins identified in anti-FLAG immunoprecipitates from 293T cells expressing either empty vector (EV) or 2×-FLAG-TAZ-CAMTA1 (TC). (CE) Immunostaining of transfected FLAG-tagged TAZ-CAMTA1 in 293A cells (C) or 293A LATS1/2 KO cells (D). 293A LATS1/2 KO (81.3% ± 6.4%, n = 6) cells had significantly more TAZ-CAMTA1 localized to the nucleus than 293A cells (47.8% ± 8.3%, n = 6). (**) P < 0.01, unpaired t-test. (FH) Immunostaining of transfected FLAG-tagged TAZ-CAMTA1 or TAZ-CAMTA1S3A in 293T cells. TAZ-CAMTA1 (70.3% ± 4.4%, n = 10) was significantly more localized to the cytoplasm than TAZ-CAMTA1S3A (35.0% ± 4.9%, n = 10). (****) P < 0.0001, unpaired t-test. (I,J,K) qPCR for expression of Amotl2 (I), Ankrd1 (J), and Ctgf (K) in MS1 cells stably expressing empty vector (Ctrl), TAZ-CAMTA1 (TC), or TAZ-CAMTA1S3A (TC3A). Cells expressing TAZ-CAMTA1S3A had significantly increased expression of Amotl2 (Ctrl: 1.0 ± 0.1, n = 3; TC: 1.4 ± 0.1, n = 3; TC3A: 4.3 ± 0.1, n = 3), Ankrd1 (Ctrl: 1.0 ± 0.1, n = 3; TC: 0.9 ± 0.0, n = 3; TC3A: 2.3 ± 0.1, n = 3), and Ctgf (Ctrl: 1.0 ± 0.3, n = 3; TC: 1.0 ± 0.0, n = 3; TC3A: 1.5 ± 0.0, n = 3). (*) P < 0.05, (**) P < 0.01, (****) P < 0.0001, one-way ANOVA with post-hoc Tukey test. (LN) Immunostaining of doxycycline-induced FLAG-tagged TAZ-CAMTA1 in MS1 cells left untreated or treated with 1 µM latrunculin B (LatB) for 1 h. LatB-treated MS1 cells (45.5% ± 6.3%, n = 10) had more TAZ-CAMTA1 localized to the cytoplasm than untreated cells (5.7% ± 1.8%, n = 10). (****) P < 0.0001, unpaired t-test. (O) qPCR for expression of Cyr61 in MS1 cells without (−Dox) or with TAZ-CAMTA1 induction (+Dox), and untreated or treated with 5 µM simvastatin for 24 h. TAZ-CAMTA1-expressing cells had significantly reduced Cyr61 (untreated: 3.6 ± 0.2, n = 3, treated: 1.9 ± 0.1, n =3, [**] P < 0.01) after treatment with simvastatin. P-values were obtained by an unpaired t-test of the +Dox group treated or untreated. (PR) Representative images showing soft agar growth of TAZ-CAMTA1-induced MS1 cells (TCiEC) in the absence or presence of 1 µM simvastatin (+Sim). Simvastatin significantly reduced the colony formation of TCiEC cells (Ctrl: 0.7 colonies ± 0.3, n = 3; TCiEC: 322.7 colonies ± 55.4, n = 3; TCiEC + Sim: 2.0 colonies ± 1.2, n = 3). (***) P < 0.001, one-way ANOVA with post-hoc Tukey test. All data are mean ± SEM. Scale bars, 25 µm.

Similar articles

Cited by

References

    1. Antonescu CR, Le Loarer F, Mosquera JM, Sboner A, Zhang L, Chen CL, Chen HW, Pathan N, Krausz T, Dickson BC, et al. 2013. Novel YAP1-TFE3 fusion defines a distinct subset of epithelioid hemangioendothelioma. Genes Chromosomes Cancer 52: 775–784. 10.1002/gcc.22073 - DOI - PMC - PubMed
    1. Antonescu CR, Chen HW, Zhang L, Sung YS, Panicek D, Agaram NP, Dickson BC, Krausz T, Fletcher CD. 2014. ZFP36-FOSB fusion defines a subset of epithelioid hemangioma with atypical features. Genes Chromosomes Cancer 53: 951–959. 10.1002/gcc.22206 - DOI - PMC - PubMed
    1. Arbiser JL, Moses MA, Fernandez CA, Ghiso N, Cao Y, Klauber N, Frank D, Brownlee M, Flynn E, Parangi S, et al. 1997. Oncogenic H-ras stimulates tumor angiogenesis by two distinct pathways. Proc Natl Acad Sci 94: 861–866. 10.1073/pnas.94.3.861 - DOI - PMC - PubMed
    1. Arbiser JL, Larsson H, Claesson-Welsh L, Bai X, LaMontagne K, Weiss SW, Soker S, Flynn E, Brown LF. 2000. Overexpression of VEGF 121 in immortalized endothelial cells causes conversion to slowly growing angiosarcoma and high level expression of the VEGF receptors VEGFR-1 and VEGFR-2 in vivo. Am J Pathol 156: 1469–1476. 10.1016/S0002-9440(10)65015-8 - DOI - PMC - PubMed
    1. Barger CJ, Branick C, Chee L, Karpf AR. 2019. Pan-cancer analyses reveal genomic features of FOXM1 overexpression in cancer. Cancers 11: 251. 10.3390/cancers11020251 - DOI - PMC - PubMed

Publication types

MeSH terms

Substances