. 2021 Mar 25;12(4):320.
doi: 10.1038/s41419-021-03620-z.

The critical role of FXR is associated with the regulation of autophagy and apoptosis in the progression of AKI to CKD

Affiliations

The critical role of FXR is associated with the regulation of autophagy and apoptosis in the progression of AKI to CKD

Dong-Hyun Kim et al. Cell Death Dis. .

Abstract

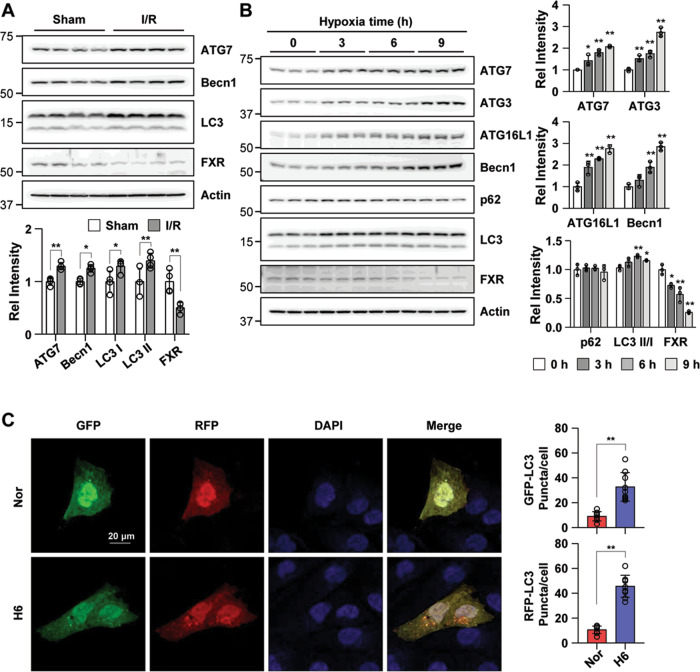
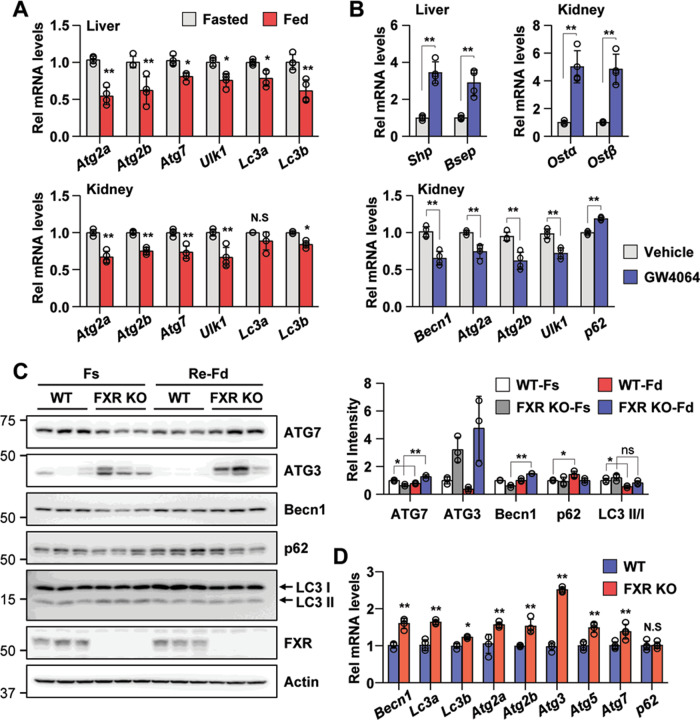
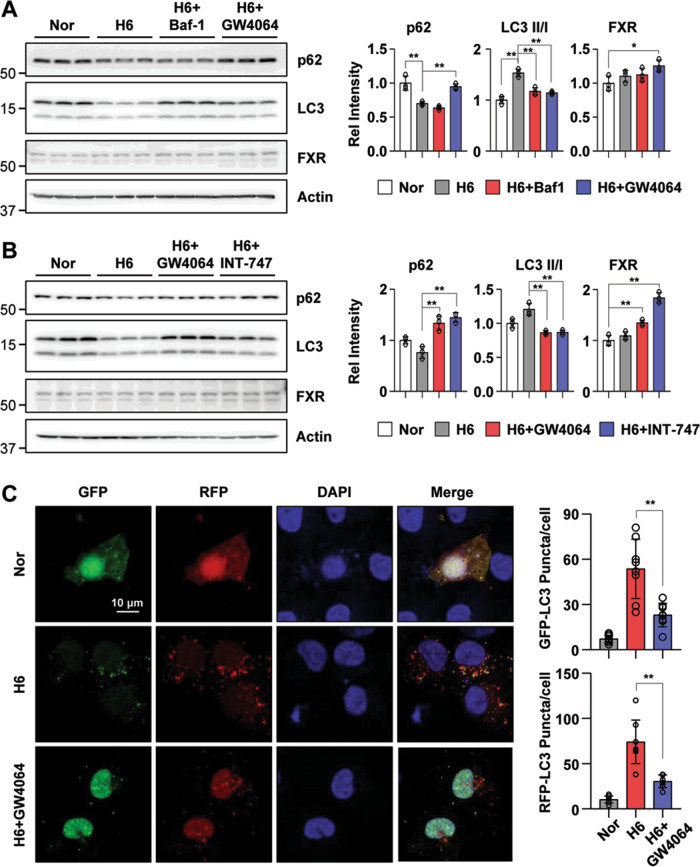
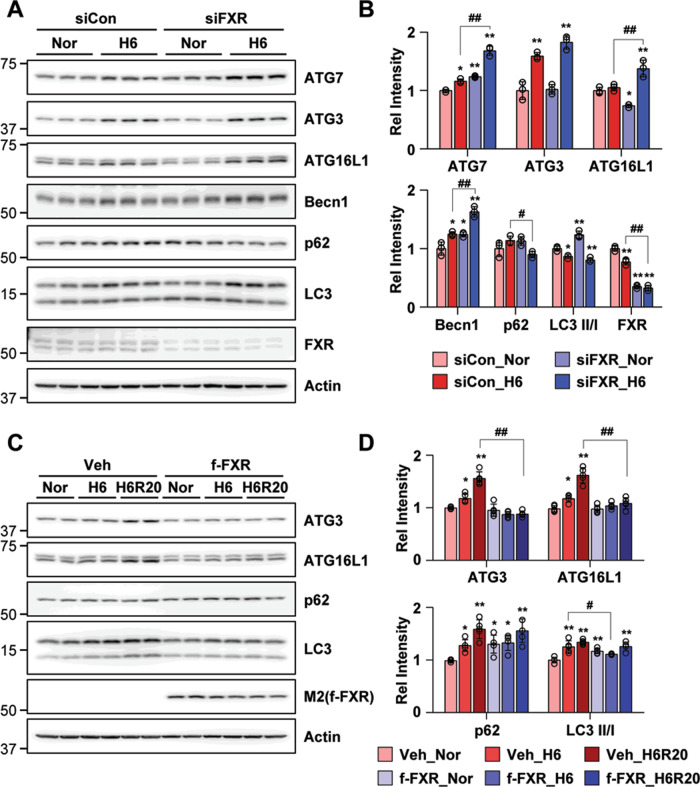
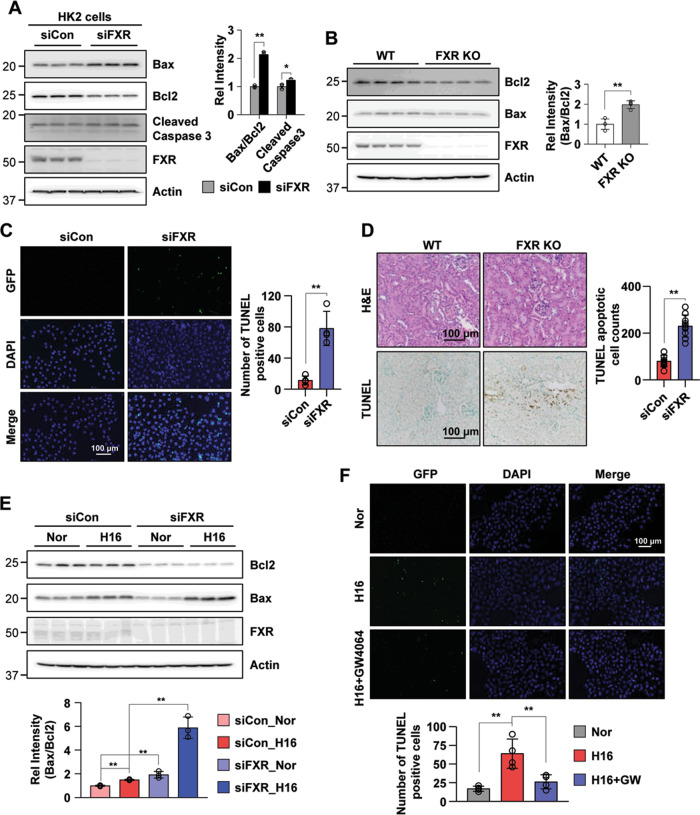
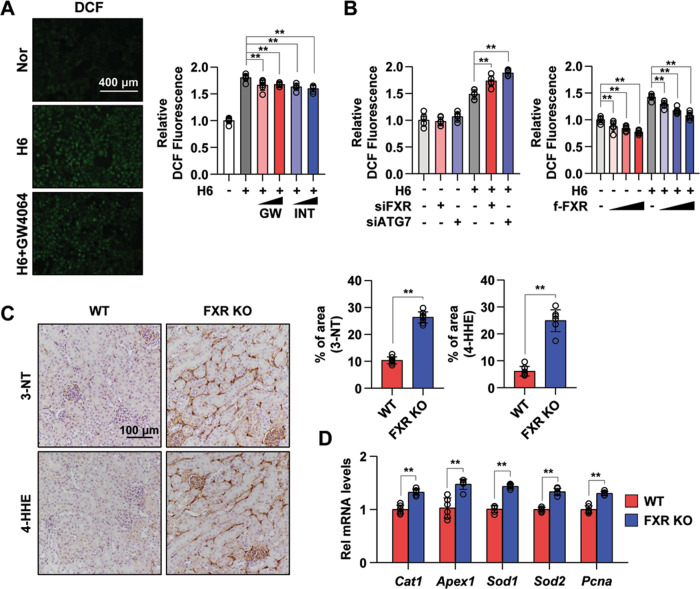
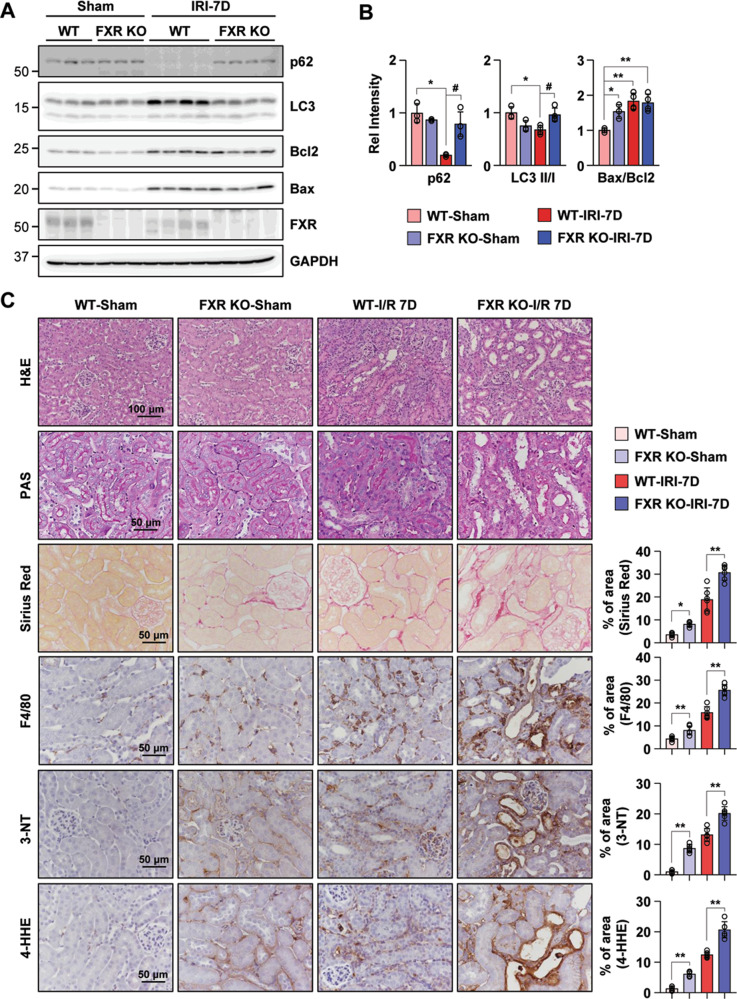
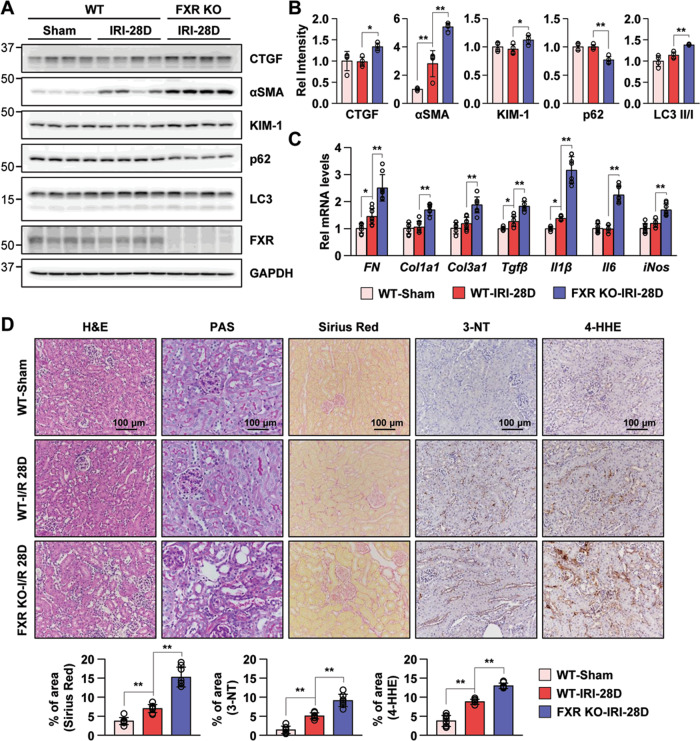
Autophagy is important for cells to break down and recycle cellular proteins, remove damaged organelles, and especially, for recovery from acute kidney injury (AKI). Despite research on the role and cellular mechanism of autophagy in AKI, the role of autophagy in the progression to chronic kidney disease (CKD) remains poorly understood. Here, using farnesoid X receptor (FXR) knockout (KO) mice, we determined whether FXR prevents the progression of AKI to CKD after renal ischemic-reperfusion (such as I/R) injury through the regulation of renal autophagy and apoptosis. FXR regulated genes that participate in renal autophagy under feeding and fasting conditions, such as hepatic autophagy, and the activation of FXR by agonists, such as GW4064 and INT-747, attenuated the increased autophagy and apoptosis of hypoxia-induced human renal proximal tubule epithelial (HK2) cells. The expression levels of autophagy-related and apoptosis-related proteins in FXR KO mice were increased compared with those in wild-type (WT) mice. We also showed that the increase in reactive oxidative species (ROS) in hypoxia-treated HK2 cells was attenuated by treatment with FXR agonist or by FXR overexpression, and that the level of ROS was elevated in FXR-deficient cells and mice. At 28 days after I/R injury, the autophagy levels were still elevated in FXR KO mice, and the expression levels of fibrosis-related proteins and ROS deposits were higher than those in WT mice. In conclusion, the regulation of renal autophagy and apoptosis by FXR may be a therapeutic target for the early stages of kidney damage, and the progression of AKI to CKD.


Conflict of interest statement

The authors declare no competing interests.

Figures

Fig. 1
Fig. 1. I/R injury and hypoxia increase renal autophagy and decrease FXR expression in mice and HK2 cells.
A At 48 h after I/R, the mice were euthanized, and the kidneys were collected (n = 4). Protein levels of ATG7, Becn1, LC3, and FXR were detected by immunoblotting. The relative protein levels are shown. The values for the Sham group were set to 1. B HK2 cells were exposed to hypoxia for the indicated times, and the levels of autophagy-related proteins and FXR were detected by immunoblotting. The relative levels are shown (n = 3). The level of each protein, including actin, in the 0 h hypoxia sample was set to 1. C HK2 cells were transfected with the ptf-LC3 expression plasmid, after which the cells were subjected to hypoxic conditions for 6 h. Fluorescence was imaged by confocal microscopy. The average number of LC3 II puncta per cell is shown on the right (n = 8–9). Scale bar, 20 μm. All values are presented as the mean ± SD. Statistical significance was measured using one-way ANOVA with the Bonferroni post-test. *P < 0.05, **P < 0.005.
Fig. 2
Fig. 2. FXR inhibits renal autophagy by feeding and GW4064.
A, B Wild-type mice were fasted for 12 h at which point were then fed a normal chow diet (A) and treated with vehicle or GW4064 for 6 h. The liver and kidneys were collected, and the mRNA levels of the indicated genes were measured by qRT-PCR. The values for fasted or vehicle treatment were set to 1 (n = 4). C Wild-type and FXR knockout mice were fasted and refed, and the kidneys were collected. The levels of autophagy-related proteins and FXR were detected by immunoblotting. The relative levels are shown (n = 3). The level of each protein, including actin, in the wild-type fasting sample was set to 1. D Wild-type and FXR knockout mice were fasted for 6 h, and the kidneys were collected. The mRNA levels of the indicated genes were measured by qRT-PCR. The values for wild-type mice were set to 1 (n = 4). All values are presented as the mean ± SD. Statistical significance was measured using one-way or two-way ANOVA with the Bonferroni post-test. *P < 0.05, **P < 0.005, ns statistically not significant, WT-Fs wild-type fasting, WT-Fd wild-type feeding, FXR KO-Fs FXR knockout fasting, FXR KO-Fd FXR knockout feeding.
Fig. 3
Fig. 3. Autophagy is inhibited by FXR activation in hypoxia-treated HK2 cells.
A, B After treatment with Baf-1 (100 nM), GW4064 (500 nM), or INT-747 (500 nM) for 1 h, HK2 cells were exposed to hypoxia for another 6 h. The protein levels of p62, LC3, and FXR were detected by immunoblotting, and the relative levels of p62/Actin, FXR/Actin, and the LC3 II/I ratio are shown in the right top and right bottom panels, respectively (n = 3). C HK2 cells were transfected with the ptf-LC3 expression plasmid. After treatment with GW4064 (500 nM) for 1 h, HK2 cells were exposed to with hypoxia for another 6 h. Fluorescence was imaged by confocal microscopy. The average number of LC3 puncta per cell is shown on the right (n = 8). All values are presented as the mean ± SD. Statistical significance was measured using one-way ANOVA with the Bonferroni post-test. *P < 0.05, **P < 0.005.
Fig. 4
Fig. 4. FXR is important for the regulation of renal autophagy.
AD HK2 cells were transfected with the siFXR (A, B) or FXR (C, D) expression plasmids as indicated, and 48 h later, the cells were exposed to hypoxia for 6 h. The protein levels of the indicated genes were detected by immunoblotting (B, D), and the relative protein levels are shown (n = 3–4). The values for the siControl normoxia (B) and vehicle normoxia (D) were set to 1. All values are presented as the mean ± SD. Statistical significance was measured using two-way ANOVA with the Bonferroni post-test. *P < 0.05, **P < 0.005, #P < 0.05, ##P < 0.005.
Fig. 5
Fig. 5. FXR deficiency increases renal apoptosis.
AD Comparison of the protein expression levels of molecules related to apoptosis, as determined by immunoblotting (A, B) and TUNEL staining (C, D) in HK2 cells transfected with siRNA against FXR (A, C) and in the kidneys of WT and FXR KO mice (B, D). The relative protein levels are shown (right panel of A, B) (n = 3–4). The values for the siControl and WT were set to 1. Quantitative analysis of positive TUNEL staining (right panel of C, D) (n = 4–11). E HK2 cells were transfected with siRNA against FXR as indicated, and 48 h later, the cells were exposed to hypoxia for 16 h. The protein levels of the indicated genes were detected by immunoblotting, and the relative intensity of Bax/Bcl2 is shown. The value for the siControl normoxia was set to 1 (n = 3). F Representative image of TUNEL staining. After treatment with GW4064 (500 nM) for 1 h, HK2 cells were exposed to hypoxia for another 16 h. Quantitative analysis of positive TUNEL staining is shown (n = 4). All values are presented as the mean ± SD. Statistical significance was measured using one-way or two-way ANOVA with the Bonferroni post-test. *P < 0.05, **P < 0.005. Nor normoxia, H16 hypoxia 16 h.
Fig. 6
Fig. 6. FXR activation inhibits ROS production.
A After treatment with GW4064 (0.5 or 1 μM) or INT-747 (0.5 or 1 μM) for 1 h, HK2 cells were exposed to hypoxia for 6 h. The cells were labeled using CM-H2DCF-DA, and images were immediately visualized using the EVOS FL Auto Imaging System. Normoxic and hypoxia-exposed cells were incubated with CM-H2DCF-DA, and the ROS levels were measured using a Promega GloMax plate reader (right panel). The relative DCF fluorescence level is shown. The values for normoxia were set to 1 (n = 6). B HK2 cells were transfected with siFXR and siATG7 (left) or FXR expression plasmids (right) as indicated, and 48 h later, normoxic and hypoxia-exposed cells were incubated with CM-H2DCF-DA, and the ROS levels were measured. The values for normoxia of the siControl and vehicle were set to 1 (n = 6). C Paraffin-embedded kidney tissue sections from WT and FXR KO mice were stained with antibodies against 3-NT and 4-HHE (scale bar 100 μm). Computer-based morphometric analysis is shown (right bar graph, n = 7–8 in each group). D mRNA levels were detected by qRT-PCR (n = 6). All values are presented as the mean ± SD. Statistical significance was measured using one-way or two-way ANOVA with the Bonferroni post-test. *P < 0.05, **P < 0.005. 3-NT 3-nitrotyrosine, 4-HHE 4-hydroxy hexenal.
Fig. 7
Fig. 7. Loss of FXR increases renal damage in the sham and I/R injury mice after 7 days.
At 7 days after I/R, kidney samples were collected for measurements. A Protein levels of p62, LC3, Bcl2, Bax, and FXR were detected by immunoblotting. B The relative protein levels are shown, and the values for the WT-Sham group were set to 1 (n = 3–4). C Renal cortical tissues were collected for hematoxylin and eosin (H&E), periodic acid-Schiff (PAS) and Sirius Red staining to examine histology and for immunohistochemistry to examine the expression of F4/80, 3-NT, and 4-HHE. Computer-based morphometric analysis is shown (right bar graph, n = 6 in each group). All values are presented as the mean ± SD. Statistical significance was measured using one-way or two-way ANOVA with the Bonferroni post-test. *P < 0.05, **P < 0.005, #P < 0.05.
Fig. 8
Fig. 8. Loss of FXR exacerbates progression to CKD after I/R-induced AKI.
At 28 days after I/R, kidney samples were collected for measurements. A Protein levels of CTGF, αSMA, KIM-1, p62, LC3, and FXR were detected by immunoblotting. B The relative protein levels are shown. The values for the WT-Sham group were set to 1 (n = 4). C mRNA levels were detected by qRT-PCR. The values for the WT-Sham were set to 1 (n = 8). D Renal cortical tissues were collected for hematoxylin and eosin (H&E), periodic acid-Schiff (PAS) and Sirius Red staining to examine histology and for immunohistochemistry to examine the expression of 3-NT and 4-HHE. Computer-based morphometric analysis is shown (bottom bar graph, n = 7–8 in each group). All values are presented as the mean ± SD. Statistical significance was measured using one-way or two-way ANOVA with the Bonferroni post-test. *P < 0.05, **P < 0.005.

Similar articles

Cited by

References

    1. Chertow GM, Burdick E, Honour M, Bonventre JV, Bates DW. Acute kidney injury, mortality, length of stay, and costs in hospitalized patients. J. Am. Soc. Nephrol. 2005;16:3365–3370. doi: 10.1681/ASN.2004090740. - DOI - PubMed
    1. Ronco C, Bellomo R, Kellum JA. Acute kidney injury. Lancet. 2019;394:1949–1964. doi: 10.1016/S0140-6736(19)32563-2. - DOI - PubMed
    1. Kaushal GP, Shah SV. Autophagy in acute kidney injury. Kidney Int. 2016;89:779–791. doi: 10.1016/j.kint.2015.11.021. - DOI - PMC - PubMed
    1. Tang C, Livingston MJ, Liu Z, Dong Z. Autophagy in kidney homeostasis and disease. Nat. Rev. Nephrol. 2020;16:489–508. doi: 10.1038/s41581-020-0309-2. - DOI - PMC - PubMed
    1. Humphreys BD, et al. Intrinsic epithelial cells repair the kidney after injury. Cell Stem Cell. 2008;2:284–291. doi: 10.1016/j.stem.2008.01.014. - DOI - PubMed

Publication types

Substances