. 2021 Mar 25;12(4):318.
doi: 10.1038/s41419-021-03592-0.

A protective role for autophagy in vitiligo

Affiliations

A protective role for autophagy in vitiligo

Emanuela Bastonini et al. Cell Death Dis. .

Abstract

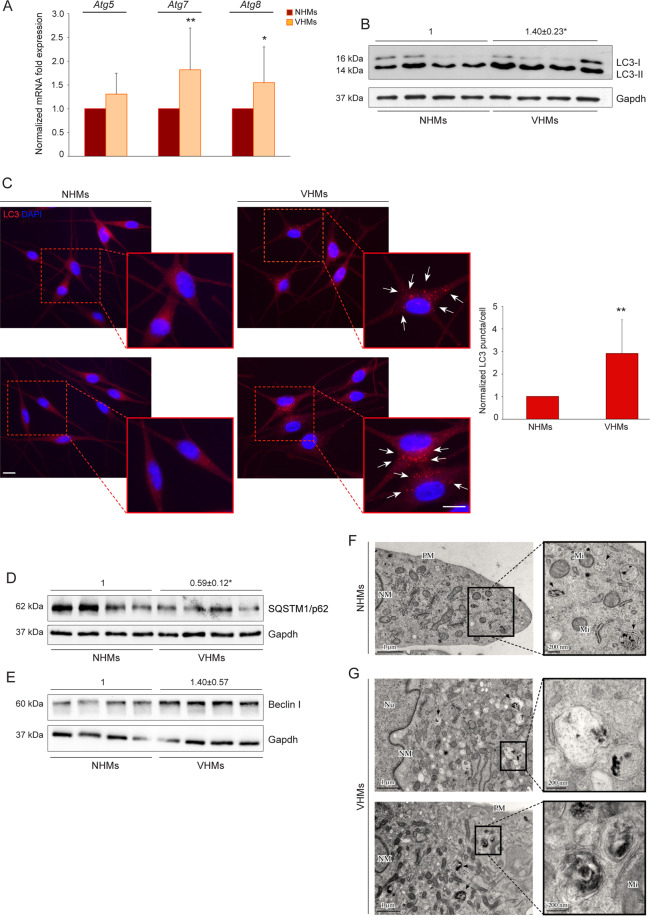
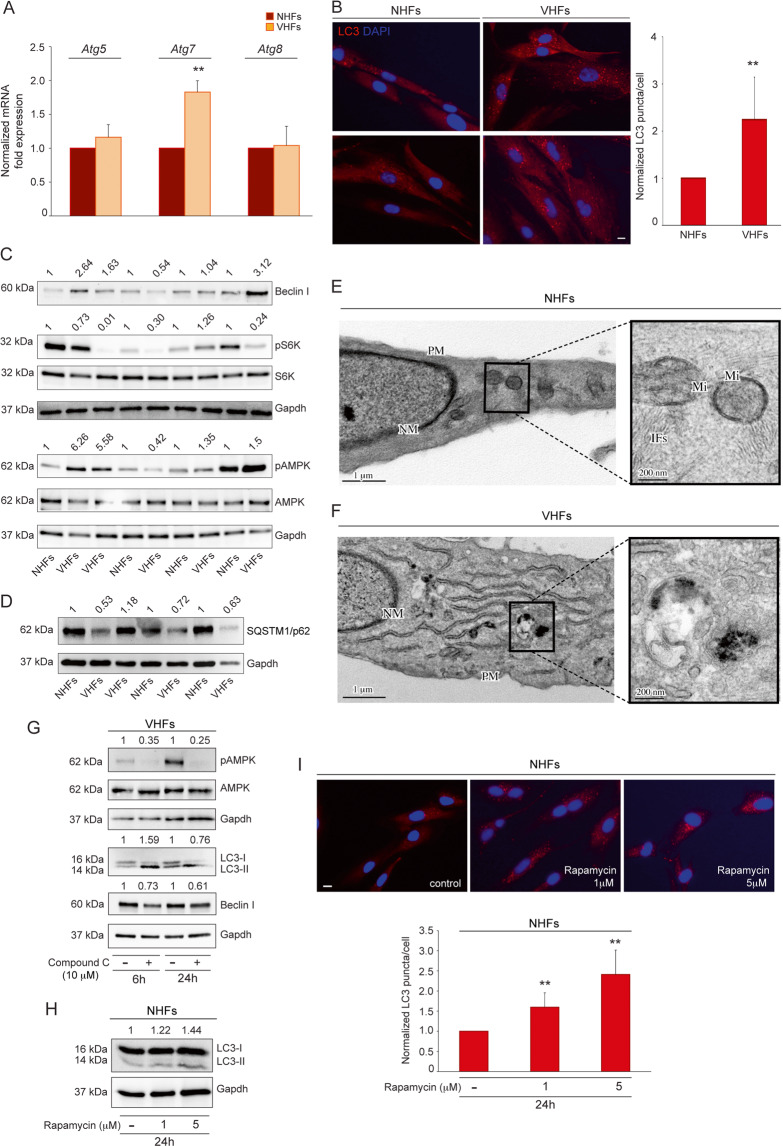
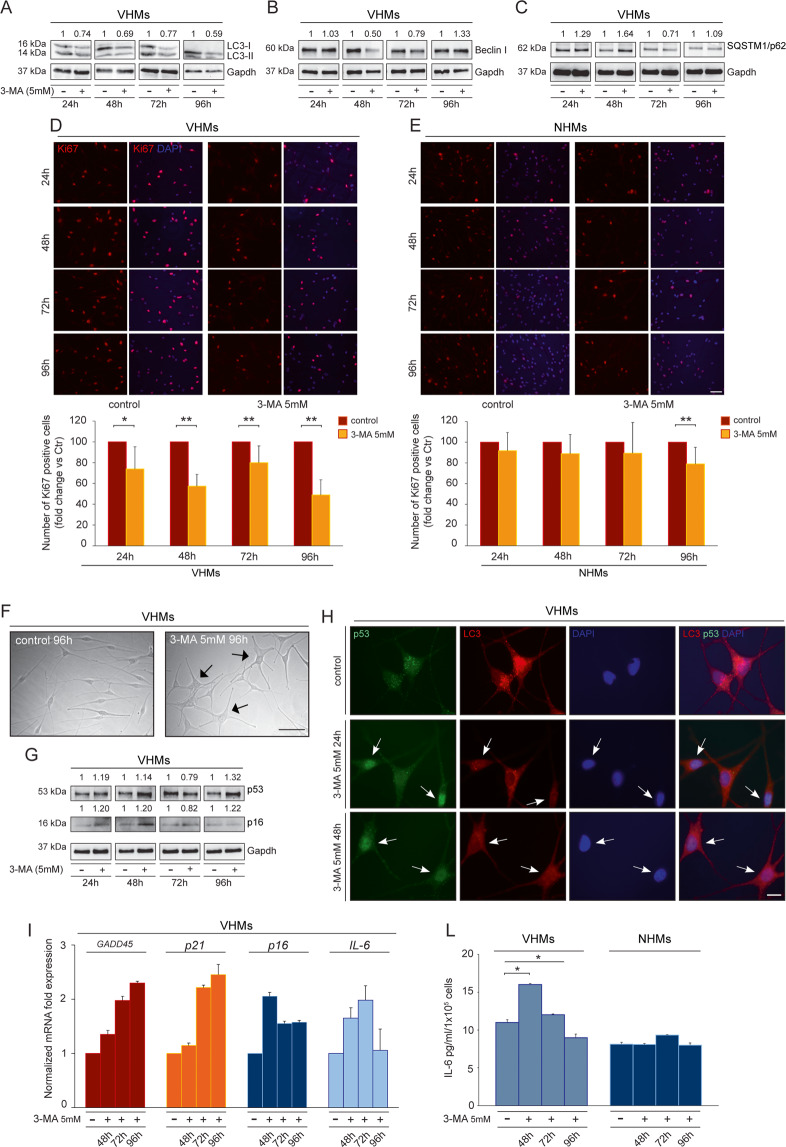
A growing number of studies supports the existence of a dynamic interplay between energetic metabolism and autophagy, whose induction represents an adaptive response against several stress conditions. Autophagy is an evolutionarily conserved and a highly orchestrated catabolic recycling process that guarantees cellular homeostasis. To date, the exact role of autophagy in vitiligo pathogenesis is still not clear. Here, we provide the first evidence that autophagy occurs in melanocytes and fibroblasts from non-lesional skin of vitiligo patients, as a result of metabolic surveillance response. More precisely, this study is the first to reveal that induction of autophagy exerts a protective role against the intrinsic metabolic stress and attempts to antagonize degenerative processes in normal appearing vitiligo skin, where melanocytes and fibroblasts are already prone to premature senescence.


Conflict of interest statement

The authors declare no competing interests.

Figures

Fig. 1
Fig. 1. Autophagy process is induced in non-lesional vitiligo melanocytes.
A mRNA transcripts of autophagy genes Atg5, Atg7, Atg8 (NHMs n = 7 and VHMs n = 7); B Western blot with average value of densitometric analysis of LC3-II/I expression on vitiligo lysates normalized on control ones. A representative blot is shown (NHMs n = 4 and VHMs n = 4); C Immunofluorescence analysis of LC3 (red) and corresponding quantitative analysis of the number of LC3 positive puncta per cell. Nuclei were counterstained with DAPI. Red boxes show the enlarged view of the selected dashed areas. The arrows point at LC3 positive dots. Quantification of positive puncta per cell is expressed as fold change relative to NHMs value, which was set as 1 by definition (n= at least 150 cells per group). Scale bars 10 μm; D, E Western blot of SQSTM1/p62 and Beclin I expression and corresponding densitometric analyses on vitiligo lysates normalized on control ones (NHM n = 4; VHM n = 4); F TEM representative images of normal human melanocytes (NHMs) and G non-lesional vitiligo melanocytes (VHMs). Black arrows in F point at different stages of melanosomes (see magnification). Black arrows in G indicate degradative autophagic vacuoles containing melanin or melanosomes (see magnification) (NHM n = 3; VHM n = 3); TEM micrographs, uranyl acetate/lead citrate; Nu, Nucleus; NM, nuclear membrane; PM, plasma membrane; Mi, Mitochondrion. Atg5, autophagy related 5; Atg7, autophagy related 7; Atg8, autophagy related 8; LC3, (microtubule-associated protein 1) light chain 3; NHMs, normal human melanocytes; SQSTM1/p62, sequestosome-1; VHMs, vitiligo human melanocytes.
Fig. 2
Fig. 2. Metabolic alterations trigger autophagy process through AMPK-mTORC1 signaling.
A Western blot and normalized densitometric analysis of pAMPK expression in normal and non-lesional vitiligo melanocytes (NHMs n = 3; VHMs n = 3); B Western blot of pS6K expression with average value of normalized densitometric analyses on cell lysates (NHMs n = 4; VHMs n = 4); C Immunofluorescence staining and corresponding normalized fluorescence intensity for pS6K (red) in normal and vitiligo melanocytes. Nuclei were counterstained with DAPI. A representative normal melanocyte culture paired with a vitiligo melanocyte one is shown. Scale bar: 10 μm; D Western blot of pAMPK, AMPK, LC3-II/I, and Beclin I with normalized densitometric analysis on vitiligo melanocytes treated or not with Compound C (10 μM) for 6 and 24 h. Representative blots of three independent experiments are shown; E, F Western blot of pS6K and LC3-II/I expression and corresponding values of normalized densitometric analysis on cell lysates of normal melanocytes after treatment with the mTORC1 inhibitor rapamycin (1 and 5 μM) for 24 h. A representative blot of three independent experiments is shown; G Immunofluorescence staining for LC3 and corresponding quantitative analysis of the number of LC3 positive puncta per cell (n = at least 150 cells per group) in untreated and rapamycin-treated normal melanocytes for 24 h. Nuclei were counterstained with DAPI. Red boxes show the enlarged view of the selected dashed areas. The arrows point at LC3 positive dots. Scale bars: 10 μm. A representative normal melanocyte culture is shown. pAMPK, phospho-adenosine monophosphate (AMP)-activated protein kinase; LC3, (microtubule-associated protein 1) light chain 3; NHMs, normal human melanocytes; pS6K, Phospho S6 kinase; VHMs, vitiligo human melanocytes.
Fig. 3
Fig. 3. Autophagy can be ascribed to impaired energy metabolism in Vitiligo.
A Western blot of LC3-II/I with corresponding normalized densitometric values on lysates of vitiligo melanocytes after treatment with NAC (5 and 10 mM) for 24 h. A representative blot of three independent experiments is shown; B Western blot of Beclin I and SQSTM1/p62 with normalized densitometric analysis on vitiligo melanocytes treated with NAC (5 and 10 mM) for 24 h. Representative blots of three independent experiments are shown; C Immunofluorescence of LC3 expression (red) and corresponding quantitative analysis of the number of LC3 positive puncta per cell (n = at least 150 cells per group) in vitiligo melanocytes treated or not with NAC (5 mM) for 24 h. Nuclei were counterstained with DAPI. Boxes show the enlarged view of the selected cells. The arrows point at LC3 positive dots. Scale bars: 10 μm. A representative vitiligo melanocyte culture is shown; D Western blot of pS6K, LC3-II/I and Beclin I with corresponding normalized densitometric values on lysates of vitiligo melanocytes pretreated with Rapamycin (1 and 5 uM) for two hours followed by NAC-treatment (5 and 10 mM) for 24 h. A representative blot of three independent experiments is shown; E Western blot of pAMPK with corresponding values of normalized densitometric analysis on cell lysates of vitiligo melanocytes after treatment with NAC (5 mM) and t-BHP (100uM) for 24 h. A representative blot of three independent experiments is shown; F Normalized mRNA transcripts of autophagy genes Atg5, Atg7, Atg8 following t-BHP treatment (100 uM) for 24 h in normal melanocytes (NHM n = 3); G Immunofluorescence analysis of LC3 (red) and corresponding quantitative analysis of the number of LC3 positive puncta per cell (n = at least 150 cells per group) in t-BHP-treated (100 uM for 24 h) normal melanocytes. Nuclei were counterstained with DAPI. Scale bar: 10 μm. A representative normal melanocyte culture treated with t-BHP is shown; H Immunofluorescence and corresponding normalized fluorescence intensity of pS6K (red) in t-BHP-treated (100 uM for 24 h) normal melanocytes. Nuclei were counterstained with DAPI. A representative normal melanocyte culture treated with t-BHP is shown. Scale bar: 10 μm; I Western blot of LC3-II/I and Beclin I with normalized densitometric analysis on vitiligo melanocytes treated with t-BHP (100 uM) for 24 h. Representative blots of three independent experiments are shown. pAMPK, phospho-adenosine monophosphate (AMP)-activated protein kinase; Atg5, autophagy related 5; Atg7, autophagy related 7; Atg8, autophagy related 8; LC3-I/II, (microtubule-associated protein 1) light chain 3; NAC, N-acetyl-L-cystein; NHMs, normal human melanocytes; SQSTM1/p62, sequestosome-1; t-BHP, tert-butyl hydroperoxide; pS6K, Phospho S6 kinase; VHMs, vitiligo human melanocytes.
Fig. 4
Fig. 4. Non-lesional vitiligo fibroblasts display a tendency to incur in the autophagic process.
A Atg5, Atg7, Atg8 mRNA level evaluated by qRT-PCR in normal and non-lesional vitiligo fibroblasts (NHFs n = 5 and VHFs n = 5); B Immunofluorescence analysis of LC3 (red) and corresponding quantitative analysis of the number of LC3 positive puncta per cell. Nuclei were counterstained with DAPI. Quantification of positive puncta per cell is expressed as fold change relative to NHFs value, which was set as 1 by definition (n = at least 150 cells per group). Scale bar: 10 μm; C Western blot of Beclin I, pS6 and pAMPK with corresponding densitometric analyses on lysates of vitiligo fibroblasts normalized on control ones (NHFs n = 4 and VHFs n = 5); D SQSTM1/p62 with corresponding densitometric analyses on lysates of vitiligo fibroblasts normalized on control ones (NHFs n = 3 and VHFs n = 4); E Ultrastructural features of normal human fibroblasts with typical spindle-like shape and cytoplasm with a few rough endoplasmic reticulum cisternae and intracellular filaments (see magnification) (NHF n = 3); F TEM representative image of non-lesional vitiligo fibroblasts characterized by higher cytoplasmatic complexity with a prominent Golgi apparatus, many cytoplasmic vesicles, well-developed rough endoplasmic reticulum and intracellular filament bundles localized near the plasma membrane. Into the cytoplasm autophagic vacuoles are also identifiable (see magnification) (VHF n = 3); TEM micrographs, uranyl acetate/lead citrate; NM, nuclear membrane, PM, plasma membrane; Mi, Mitochondrion; IFs: Intermediate filaments. G Western blot of pAMPK, LC3II/I, and Beclin I with normalized densitometric analysis on vitiligo fibroblasts treated or not with Compound C (10 uM) for 6 and 24 h. Representative blots of three independent experiments are shown; H Western blot of LC3-II/I expression and corresponding values of normalized densitometric analysis on cell lysates of normal fibroblasts after treatment with the mTORC1 inhibitor rapamycin (1 and 5 μM) for 24 h. A representative blot of three independent experiments is shown; I Immunofluorescence staining and corresponding quantitative analysis of the positive number of LC3 puncta in untreated and rapamycin-treated normal fibroblasts for 24 h (n = at least 150 cells per group). Nuclei were counterstained with DAPI. Scale bar: 10 μm. A representative normal fibroblast culture treated with rapamycin is shown. Atg7, autophagy related 7; Atg8, autophagy related 8; Atg5, autophagy related 5; p-AMPK, phospho-adenosine monophosphate (AMP)-activated protein kinase; LC3-I/II, (microtubule-associated protein 1) light chain 3; NHFs, normal human fibroblasts; SQSTM1/p62, sequestosome-1; qRT-PCR, quantitative real time reverse transcriptase-PCR; VHFs, vitiligo human fibroblasts.
Fig. 5
Fig. 5. Inhibition of autophagy increases adverse metabolic effects in non-lesional vitiligo cells.
A, B, C Western blot of LC3-II/I, Beclin I and SQSTM1/p62 with corresponding normalized densitometric analysis on lysates of vitiligo melanocytes untreated or treated with 3MA (5 mM) for 24–48–72–96 h. Representative blots of three independent experiments are shown; D Immunofluorescence staining for Ki67 (red) and the corresponding percentage of Ki67 positive cells in vitiligo melanocytes before and after treatment with 3-MA (5 mM) for 24–48–72–96 h (n = at least 700 cells per group). Nuclei were counterstained with DAPI. Scale bar: 50 μm; E Immunofluorescence analysis and percentage of positive cells for Ki67 (red) in normal melanocytes before and after treatment with 3-MA (5 mM) for 24-48-72-96 h (n = at least 700 cells per group). Nuclei were counterstained with DAPI. Scale bar: 50 μm; F Morphological analysis of vitiligo melanocytes untreated and treated with 3-MA (5 mM) for 96 h. Arrows point at cells showing an enlarged morphology. Scale bar: 50 μm; A representative vitiligo melanocyte culture treated with 3-MA is shown. G Western blot of p53 and p16 with corresponding normalized densitometric analysis on lysates of vitiligo melanocytes untreated or treated with 3MA (5 mM) for 24–48–72–96 h. Representative blots of three independent experiments are shown; H Double immunofluorescence analysis of p53 (green) and LC3 (red) expression in vitiligo melanocytes untreated and treated with 3MA (5 mM) for 24 and 48 h. Nuclei were counterstained with DAPI. The arrows point at cells showing p53 nuclear translocation. Scale bar: 10 μm; A representative vitiligo melanocyte culture treated with 3-MA is shown. I mRNA transcripts of Gadd45, p21, p16 and IL-6 evaluated by qRT-PCR in vitiligo melanocytes untreated and treated with 3MA (5 mM) for 48–72–96 h (VHMs n = 3); L IL-6 quantification by ELISA in vitiligo and normal melanocytes untreated and treated with 3-MA (5 mM) for 48-72-96 h (VHMs n = 3 and NHMs n = 3). Gadd45, growth arrest and DNA damage-inducible 45; IL-6, interleukin 6; LC3-I/II, (microtubule-associated protein 1) light chain 3; NHMs, normal human melanocytes; 3-MA, 3-methyl adenine; VHMs, vitiligo human melanocytes.
Fig. 6
Fig. 6. Suppression of autophagy further impairs Vitiligo fibroblasts.
A Immunofluorescence analysis and corresponding quantitative analysis of the number of positive LC3 puncta on vitiligo fibroblasts untreated or treated with 3MA (5 mM) for 24 and 48 h (n = at least 150 cells per group). Nuclei were counterstained with DAPI. Scale bar: 20 μm. A representative vitiligo fibroblast culture treated with 3-MA is shown; B, C Western blot of LC3-II/I, Beclin I, and Cyclin D1 and corresponding densitometric analysis on vitiligo lysates normalized on control ones after treatment with 3-MA (5 mM) for 24 and 48 h. Representative blots of three independent experiments are shown. D Immunofluorescence staining of Ki67 (red) and corresponding percentage of Ki67 positive vitiligo and normal fibroblasts treated or not with 3-MA (5 mM) for 24 and 48 h (n= at least 700 cells per group). Nuclei were counterstained with DAPI. Scale bar: 50 μm; E IL-6 quantification by ELISA in vitiligo and normal fibroblasts untreated and treated with 3-MA (5 mM) for 24 and 48 h (VHFs n = 3 and NHFs n = 3). IL-6, interleukin 6; LC3-I/II, (microtubule-associated protein 1) light chain 3; 3-MA, 3-methyl adenine; qRT-PCR, quantitative real-time reverse transcriptase-PCR; VHFs, vitiligo human fibroblasts.

References

    1. Bellei B, et al. Vitiligo: a possible model of degenerative diseases. PLoS ONE. 2013;8:e59782. doi: 10.1371/journal.pone.0059782. - DOI - PMC - PubMed
    1. Dell’Anna ML, et al. Energetic mitochondrial failing in vitiligo and possible rescue by cardiolipin. Sci. Rep. 2017;7:13663. doi: 10.1038/s41598-017-13961-5. - DOI - PMC - PubMed
    1. Qiao Z, et al. Dysfunction of ATG7-dependent autophagy dysregulates the antioxidant response and contributes to oxidative stress-induced biological impairments in human epidermal melanocytes. Cell Death Discov. 2020;6:31. doi: 10.1038/s41420-020-0266-3. - DOI - PMC - PubMed
    1. He Y, et al. Dysregulated autophagy increased melanocyte sensitivity to H2O2-induced oxidative stress in vitiligo. Sci. Rep. 2017;10:42394. doi: 10.1038/srep42394. - DOI - PMC - PubMed
    1. Raam L, et al. Lymphoid stress surveillance response contributes to vitiligo pathogenesis. Front. Immunol. 2018;9:2707. doi: 10.3389/fimmu.2018.02707. - DOI - PMC - PubMed

Publication types