. 2021 Mar 25;12(1):1864.
doi: 10.1038/s41467-021-22126-y.

Quantitative characterization of extracellular vesicle uptake and content delivery within mammalian cells

Affiliations

Quantitative characterization of extracellular vesicle uptake and content delivery within mammalian cells

Emeline Bonsergent et al. Nat Commun. .

Abstract

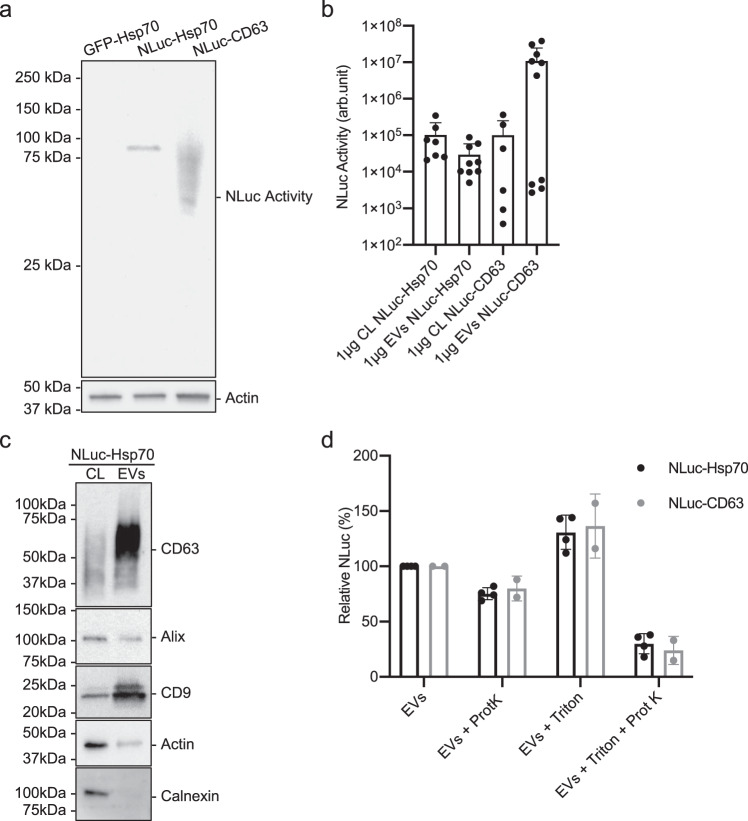
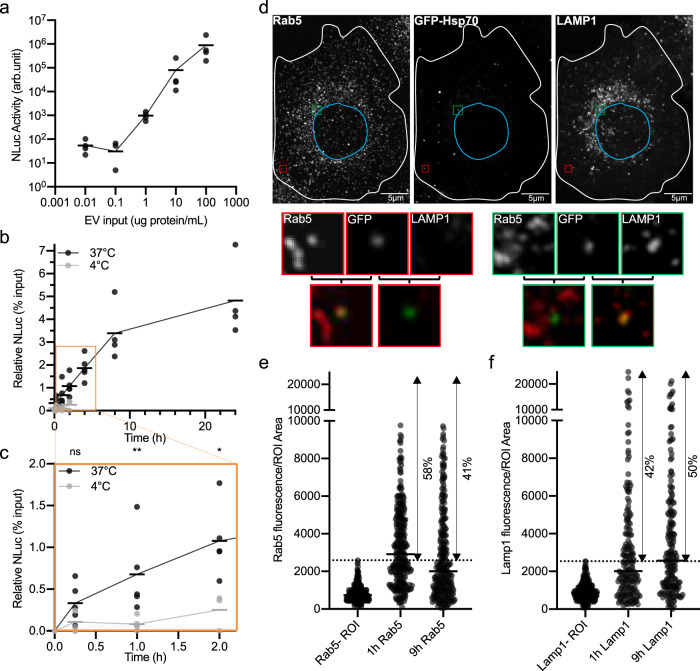
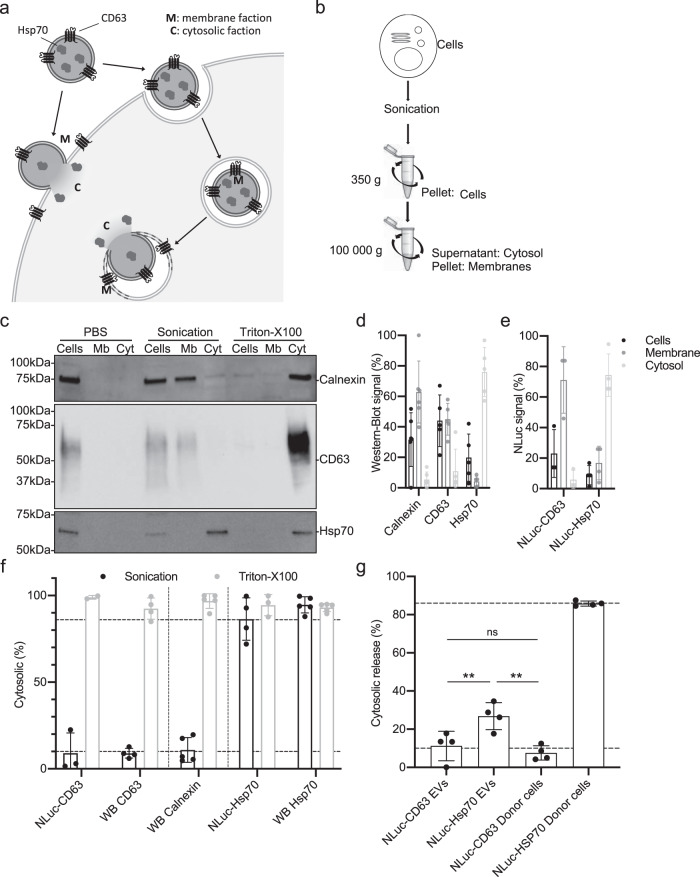
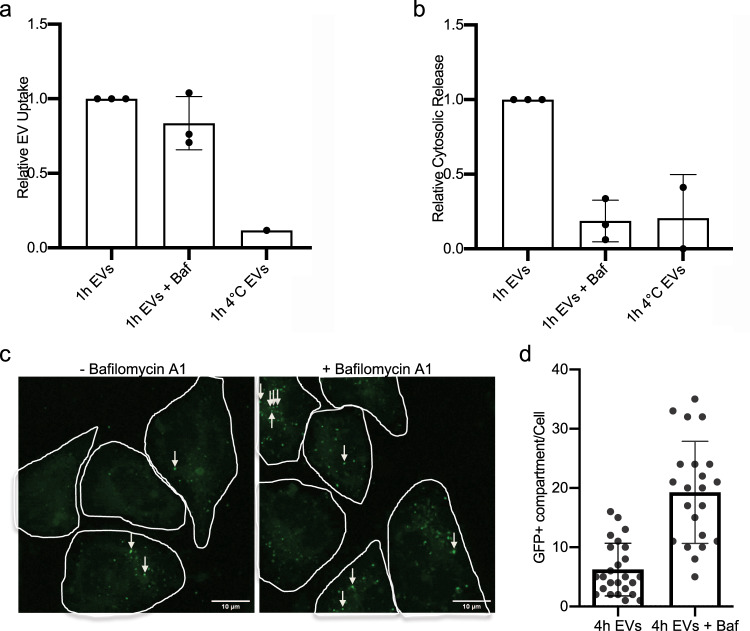
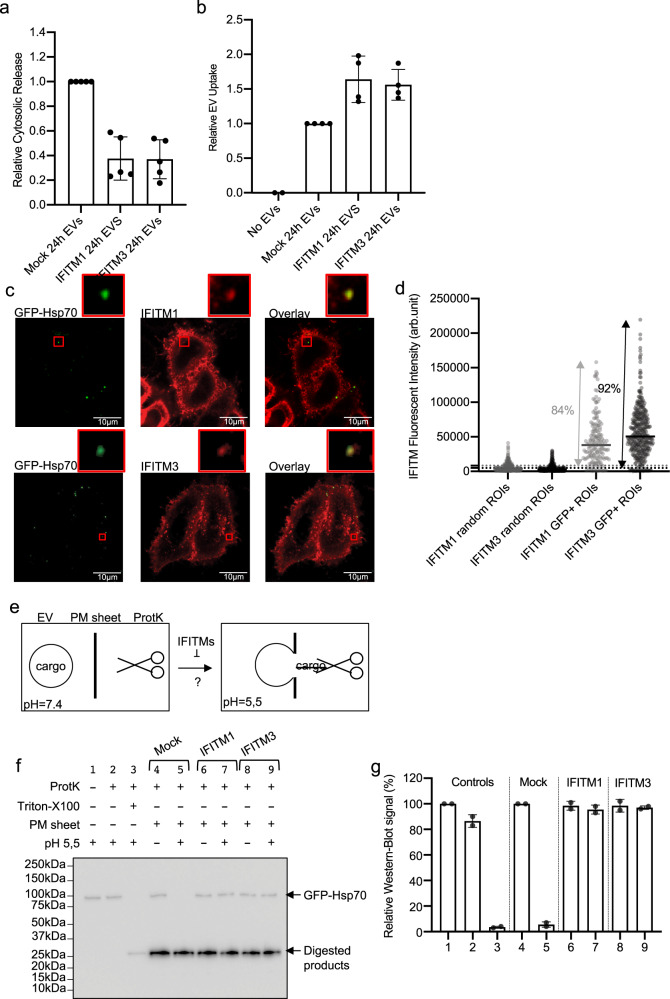
Extracellular vesicles (EVs), including exosomes, are thought to mediate intercellular communication through the transfer of cargoes from donor to acceptor cells. Occurrence of EV-content delivery within acceptor cells has not been unambiguously demonstrated, let alone quantified, and remains debated. Here, we developed a cell-based assay in which EVs containing luciferase- or fluorescent-protein tagged cytosolic cargoes are loaded on unlabeled acceptor cells. Results from dose-responses, kinetics, and temperature-block experiments suggest that EV uptake is a low yield process (~1% spontaneous rate at 1 h). Further characterization of this limited EV uptake, through fractionation of membranes and cytosol, revealed cytosolic release (~30% of the uptaken EVs) in acceptor cells. This release is inhibited by bafilomycin A1 and overexpression of IFITM proteins, which prevent virus entry and fusion. Our results show that EV content release requires endosomal acidification and suggest the involvement of membrane fusion.


Conflict of interest statement

The authors declare no competing interests.

Figures

Fig. 1
Fig. 1. NLuc-Hsp70 and NLuc-CD63 EV characterization.
a In-gel detection of NLuc-Hsp70 and NLuc-CD63 activity. Equal protein amount of cell lysates from HeLa GFP-Hsp70 (negative control), stable HeLa NLuc-Hsp70, and transient HeLa NLuc-CD63 (upper gel) were loaded. As a control, actin was tested by immunoblot on the same samples (lower gel). This blot is representative of 2 independent experiments. b NLuc activity measurement in 1 μg of cell lysate (CL) or EVs from stable HeLa NLuc-Hsp70 or transient HeLa NLuc-CD63. Each dot is an independent replicate and represents the mean of 2 or 3 technical replicates. From left to right, n = 7, 9, 6, 10. Error bars represent standard deviations. c Immunoblots of cell lysate (CL) and EVs from stable HeLa NLuc-Hsp70. Equal amounts of protein were loaded to analyze CD9, CD63, Actin, Alix, and calnexin. This blot is representative of three independent experiments. d Protease protection assay on NLuc-Hsp70 (black) or NLuc-CD63 (gray) EVs, treated or not with proteinase K and/or detergent. Non-treated EVs were set to 100%. Each dot is an independent replicate and represents the mean of 3 technical replicates, n = 4 for NLuc-Hsp70, n = 2 for NLuc-CD63. Error bars represent standard deviations.
Fig. 2
Fig. 2. NLuc-Hsp70 EV uptake by HeLa cells.
a Dose–response study. Unlabeled acceptor HeLa WT cells were incubated for 2 h. with different amounts of isolated NLuc-Hsp70 EVs, luciferase activity was assessed at 2 h. One dot is an independent replicate and represents the mean of 2 technical replicates, n = 4. b Kinetics study. Unlabeled acceptor HeLa WT cells were incubated with isolated NLuc-Hsp70 EVs (1 μg/ml) for different incubation times at 37 °C (black) or 4 °C (gray). Measured EV input (equivalent to the EV dose loaded on cells) was set to 100% to normalize the NLuc activity at each timepoint. Each dot is an independent replicate and represents the mean of 2 technical replicates, n = 4. c Temperature-dependency study. Orange square, zoom on the 0–2 h timepoints on graph (b), to highlight 4 °C kinetics. Each dot is an independent replicate and represents the mean of 2 technical replicates, n = 4. d Confocal micrographs showing GFP-Hsp70 EV-content colocalization with either endosomes (Rab5+, red square) or lysosomes (LAMP1+, green square) compartments. Unlabeled acceptor HeLa WT were incubated with GFP-Hsp70 EV for 1 h, then processed for immunofluorescence against Rab5 and LAMP1 prior to being imaged by confocal microscopy. Micrographs are representative of three independent experiments. e Quantification of GFP-Hsp70 EV-content colocalization with endosomal and lysosomal compartments. Rab5 fluorescence was measured for each GFP+ dot or negative ROI. Each dot is a GFP+ compartment or Rab5 negative ROI of the same size, n = 295, 315, 291 (for each column, left to right order). Dashed line represents the maximum fluorescence of Rab5 negative ROIs. f Quantification of GFP-Hsp70 EV-content colocalization with lysosomal compartments. Lamp1 fluorescence was measured for each GFP+ dot or negative ROI. Each dot is a GFP+ compartment or Lamp1 negative ROI of the same size, n = 193, 196, 195 (for each column, left to right order). Dashed line represents the maximum fluorescence of Lamp1 negative ROIs.
Fig. 3
Fig. 3. Quantification of the EV-content cytosolic release.
a Principle of EV-content cytosolic release quantification: signal from EV-content NLuc-CD63 (membrane marker) or NLuc-Hsp70 (cytosolic marker) should be associated with the membrane fraction (Mb), except if content release occurs. Then, only NLuHsp70 should be detected in the cytosolic fraction (C). b Scheme representing detergent-free cell fractionation protocol that separates membrane and cytosol fractions. Sonication and differential centrifugation allowed to fractionate the cells in three fractions: intact cell (Cells), membrane (Mb), and cytosolic (Cyt) fractions. c Immunoblots showing the distribution of Calnexin (ER luminal protein used to test for organelle integrity), CD63 (membrane marker), and Hsp70 (cystosolic marker) within each fraction emanating from HeLa WT cells that were intact (PBS), mechanically disrupted (Sonication), or detergent-disrupted (Triton-X-100). This blot is representative of four independent experiments. d Densitometry analysis of intact cell (black), membrane (dark gray), and cytosolic (light gray) fractions from sonication treatment in (c). From left to right n = 6, 5, 5. Error bars represent standard deviations. e NLuc activity quantification within intact cell (black), membrane (dark gray), and cytosolic (light gray) fractions. Stable HeLa NLuc-Hsp70 cells and transient HeLa NLuc-CD63 cells were submitted to detergent-free fractionation and luciferase activity was measured in each fraction, from left to right n = 3, 4. Error bars represent standard deviations. f Quantification of each marker in the cytosolic fraction from NLuc or western-blot (WB) quantification, after sonication (black) or Triton-X-100 (gray) treatment. Dashed lines represent the full range of experimentally measured maximum and minimal values. Each dot is an independent replicate and represents the mean of two technical replicates, n from 2 to 5. Error bars represent standard deviations. g Quantification of the EV-content release: NLuc-CD63 or NLuc-Hsp70 EVs were loaded on unlabeled acceptor HeLa WT cells at 37 °C for 1–4 h, prior to performing the detergent-free cell fractionation protocol and measuring the Nluc activity to determine the % of each marker in the cytosolic fraction. As internal control, we measured the distribution of each marker within the donor cells. Dashed line represents experimental minimum and maximum values established in (e). Each dot is an independent experiment and represents the means of 2 technical replicates, n = 4. Error bars represent standard deviations. One-way ANOVA was performed with a Turkey’s multiple comparison test. Indicated p-values, from left to right: 0.0091, 0.7963, and 0.0019.
Fig. 4
Fig. 4. Endo/lysosomal acidification is required for EV-content delivery.
a Quantification of NLuc-Hsp70 EV uptake by unlabeled acceptor HeLa WT cells, with or without Bafilomycin A1 (Baf) treatment. Cells were incubated at 4 °C as negative control (no EV uptake). The EV uptake in control condition (non-treated) was set to 1. Each dot is an independent replicate and represents the means of 2 or 3 technical replicates, from left to right n = 3, 3, 1. Error bars represent standard deviations. b Quantification of NLuc-Hsp70 EV-content delivery within unlabeled acceptor HeLa WT cells, with or without Bafilomycin A1 (Baf) treatment. Cells were incubated at 4 °C as negative control (no EV-content release). The cytosolic release from the control condition (non-treated) was set to 1. Baf treatment (loss of endosomal acidification) inhibits the content release. Each dot is an independent replicate and represents the mean of 2 or 3 technical replicates, from left to right n = 3, 3, 2. Error bars represent standard deviations. c Confocal micrographs of HeLa acceptor cells after 4 h incubation with GFP-Hsp70 EVs with or without Baf treatment. White arrows indicate GFP-positive dots. Micrographs representative of three independent experiments. d Quantification of the number of GFP-positive dots per cell on unlabeled acceptor HeLa WT cells after 4 h incubation with GFP-Hsp70 EVs with or without Baf treatment. Each dot represents the value of GFP foci number within one acceptor cell, from left to right n = 25, 22. Error bars represent standard deviations.
Fig. 5
Fig. 5. IFITM proteins inhibit EV-content delivery.
a Quantification of NLuc-Hsp70 EV-content delivery within Mock HEK cells (control), or HEK cells stably expressing Flag-tagged IFITM1 or IFITM3. NLuc-Hsp70 EVs were loaded on each acceptor cell prior to performing cell fractionation and determining the portion of NLuc-Hsp70 found in the cytosolic fraction. Cytosolic release measured in control (Mock cells) was set to 1. Each dot is an independent replicate and represents the means of 2 or 3 technical replicates, n = 5. Error bars represent standard deviations. b Quantification of NLuc-Hsp70 EV uptake by control HEK cells (Mock), or stably expressing IFITM1, IFITM3. EV uptake measured in control (Mock) was set to 1. Each dot is an independent replicate and represents the means of 2 or 3 technical replicates, n = 4. Error bars represent standard deviations. c Confocal micrographs of IFITM1 or IFIMT3-HEK acceptor cells after uptake of GFP-Hsp70 EVs. IFITM1 and 3 were detected through their flag-tag (Alexa 546) whereas EV were detected through their GFP signal. Red squares show higher magnification of internalized EVs colocalizing with IFITM1 and 3. Micrographs representative of at least three independent experiments. d Quantification of Flag-IFITM1 (light gray) and 3 (dark gray) fluorescent signals in GFP+ ROI versus random ROI on HEK acceptor cells after incubation with GFP-Hsp70 EVs. One dot represents one ROI. n = 241 (control IFITM1), 387 (control IFITM3), 166 (GFP+IFITM1), 370 (GFP+IFITM3). Dashed lines represent the average background (random ROI) value plus twofold standard deviation. e Scheme illustrating the principle of the cell-free content EV-content release assay. Under acidic pH and in presence of PM sheets, EVs released their content (GFPHsp70) in the buffer where the cargo can be digested by proteinase K. The role of IFIMT1 and 2 in target PM sheets can be tested following this protocol. f Immunoblot showing the resistance of GFP-Hsp70 to proteinase K when EVs are incubated with target PM sheets that contain or not IFIMT1 and 3, and that are exposed or not to acidic pH. Digested products of GFP-Hsp70 and GFP-PM sheets (also observable on Supplementary Fig. 3C) show similar profiles. This blot is representative of two independent experiments. g Quantification of the GFP-Hsp70 signal (proteinase K resistant) by densitometry analysis. Each dot represents an independent replicate, n = 2, control (line 1) was set to 100%. Error bars represent standard deviations.

Similar articles

Cited by

References

    1. Mathieu M, Martin-Jaular L, Lavieu G, Théry C. Specificities of secretion and uptake of exosomes and other extracellular vesicles for cell-to-cell communication. Nat. Cell Biol. 2019;21:9–17. doi: 10.1038/s41556-018-0250-9. - DOI - PubMed
    1. Raposo G, et al. B lymphocytes secrete antigen-presenting vesicles. J. Exp. Med. 1996;183:1161–1172. doi: 10.1084/jem.183.3.1161. - DOI - PMC - PubMed
    1. Valadi H, et al. Exosome-mediated transfer of mRNAs and microRNAs is a novel mechanism of genetic exchange between cells. Nat. Cell Biol. 2007;9:654–659. doi: 10.1038/ncb1596. - DOI - PubMed
    1. Skog J, et al. Glioblastoma microvesicles transport RNA and proteins that promote tumour growth and provide diagnostic biomarkers. Nat. Cell Biol. 2008;10:1470–1476. doi: 10.1038/ncb1800. - DOI - PMC - PubMed
    1. Balaj L, et al. Tumour microvesicles contain retrotransposon elements and amplified oncogene sequences. Nat. Commun. 2011;2:180. doi: 10.1038/ncomms1180. - DOI - PMC - PubMed

Publication types