. 2021 Mar 25;12(1):1873.
doi: 10.1038/s41467-021-22008-3.

Model-based deep embedding for constrained clustering analysis of single cell RNA-seq data

Affiliations

Model-based deep embedding for constrained clustering analysis of single cell RNA-seq data

Tian Tian et al. Nat Commun. .

Abstract

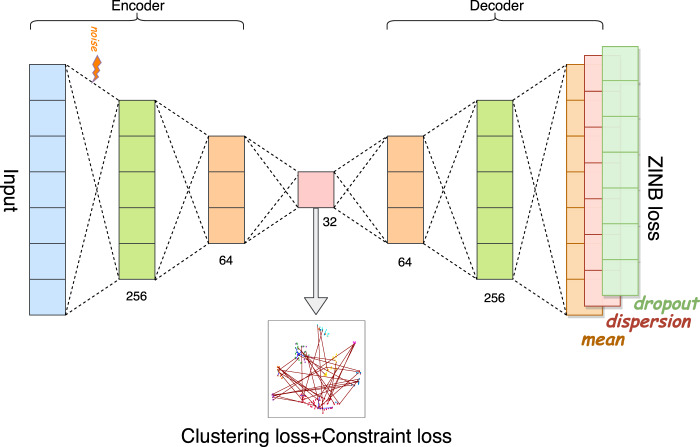
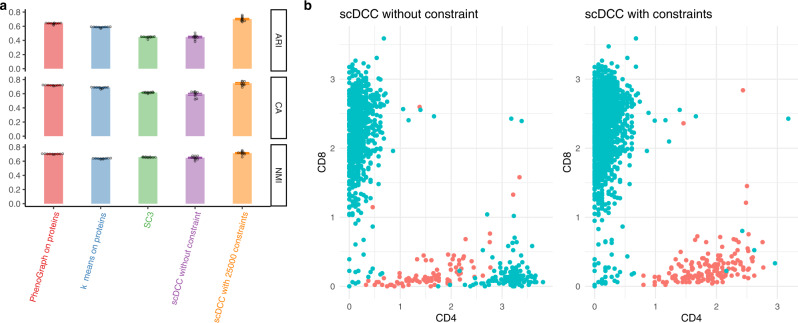
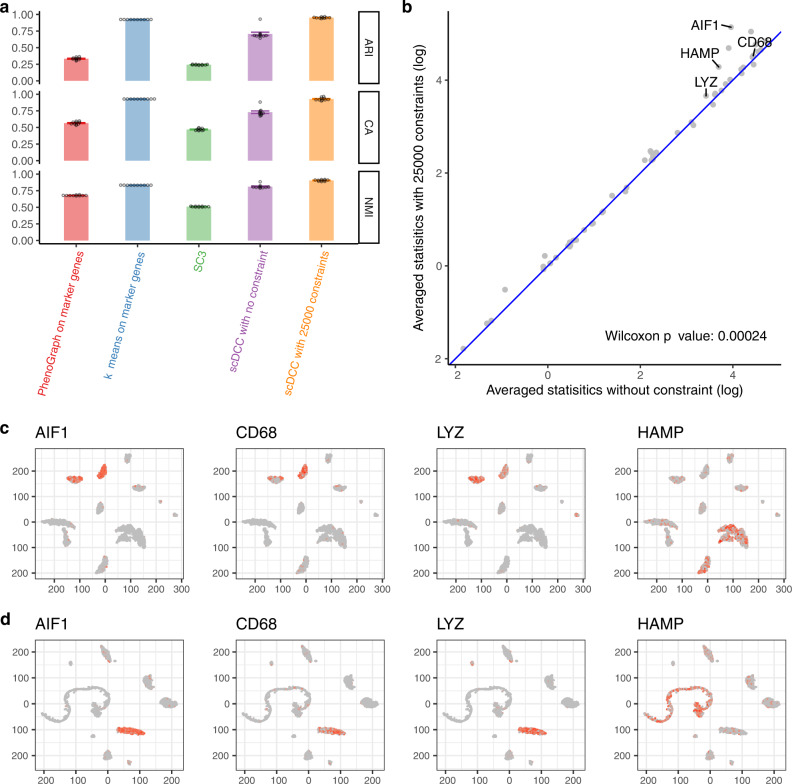
Clustering is a critical step in single cell-based studies. Most existing methods support unsupervised clustering without the a priori exploitation of any domain knowledge. When confronted by the high dimensionality and pervasive dropout events of scRNA-Seq data, purely unsupervised clustering methods may not produce biologically interpretable clusters, which complicates cell type assignment. In such cases, the only recourse is for the user to manually and repeatedly tweak clustering parameters until acceptable clusters are found. Consequently, the path to obtaining biologically meaningful clusters can be ad hoc and laborious. Here we report a principled clustering method named scDCC, that integrates domain knowledge into the clustering step. Experiments on various scRNA-seq datasets from thousands to tens of thousands of cells show that scDCC can significantly improve clustering performance, facilitating the interpretability of clusters and downstream analyses, such as cell type assignment.


Conflict of interest statement

The authors declare no competing interests.

Figures

Fig. 1
Fig. 1. Network architecture of scDCC.
The autoencoder is a fully connected neural network. The number below each layer denotes the size of that layer.
Fig. 2
Fig. 2. Performances of scDCC on small datasets.
a 10X PBMC; b Mouse bladder cells; c Worm neuron cells; d Human kidney cells. Clustering performances of scDCC on four small scRNA-seq datasets with different numbers of pairwise constraints, measured by NMI, CA, and ARI. All experiments are repeated ten times, and the means and standard errors are displayed.
Fig. 3
Fig. 3. Latent representation visualization.
Comparison of 2D visualization of embedded representations of ZINB model-based autoencoder (a, d, g, j), scDeepCluster (b, e, h, k) and scDCC with pairwise constraints (c, f, i, l). The same instances and constraints are visualized for each dataset (ac, 10X PBMC; df Mouse bladder cells; gi Worm neuron cells; jl Human kidney cells). The red lines indicate cannot-link and blue lines indicate must-link. The axes are arbitrary units. Each point represents a cell. The distinct colors of the points represent the true labels, and colors are arbitrarily selected.
Fig. 4
Fig. 4. Performances of scDCC on large datasets.
a Macosko mouse retina cells; b Shekhar mouse retina cells. Clustering performances of scDCC on two large scRNA-seq datasets with different numbers of pairwise constraints, measured by NMI, CA, and ARI. All experiments are repeated ten times, and the means and standard errors are displayed.
Fig. 5
Fig. 5. Clustering analysis on the CITE-seq PBMC data with protein-based constraints.
a Clustering performances of PhenoGraph and k-means on proteins, SC3, and scDCC (without and with constraints) on mRNAs of CITE-seq PBMC dataset, measured by NMI, CA, and ARI. All experiments are repeated ten times (one dot represents one experiment), and the means and standard errors are displayed. Constraints were generated from protein expression levels. b CD4 and CD8 protein expression levels in the identified CD4 and CD8 specific cells. Colors (Cyan represents CD8 cells and red represents CD4 cells) are cluster labels identified by scDCC with and without constraints on proteins. Cell labels were annotated by differential expression analysis.
Fig. 6
Fig. 6. Clustering analysis on the human liver cells with marker gene-based constraints.
a Clustering performances of PhenoGraph and k-means on ZIFA representations of marker genes, SC3, and scDCC (with and without constraints) on mRNAs of the human liver dataset measured by NMI, CA, and ARI. All experiments are repeated ten times (one dot represents one experiment), and the means and standard errors are displayed. Constraints were constructed by marker genes. b Average (with constraints comparing to without constraints) of specificity scores of 55 marker genes. One-sided Wilcoxon test p-value is also displayed (with constraints vs. without constraints). c Marker gene expression (log normalized counts) for each cell marked on the t-SNE plot based on latent representations of scDCC without any constraint. d Marker gene expression (log normalized counts) for each cell marked on the t-SNE plot based on latent representations of scDCC with 25,000 pairwise constraints. c, d t-SNE plots calculated from the bottleneck features of scDCC with and without constraints, respectively. Colors represent the relative expression levels; gray and red represent low and high expression levels, respectively. Axes are arbitrary values.

References

    1. Shapiro E, Biezuner T, Linnarsson S. Single-cell sequencing-based technologies will revolutionize whole-organism science. Nat. Rev. Genet. 2013;14:618–630. doi: 10.1038/nrg3542. - DOI - PubMed
    1. Kolodziejczyk AA, Kim JK, Svensson V, Marioni JC, Teichmann SA. The technology and biology of single-cell RNA sequencing. Mol. Cell. 2015;58:610–620. doi: 10.1016/j.molcel.2015.04.005. - DOI - PubMed
    1. Kiselev VY, Andrews TS, Hemberg M. Challenges in unsupervised clustering of single-cell RNA-seq data. Nat. Rev. Genet. 2019;20:273–282. doi: 10.1038/s41576-018-0088-9. - DOI - PubMed
    1. Maaten, L. Learning a parametric embedding by preserving local structure. In Proc. Twelth International Conference on Artificial Intelligence and Statistics (eds David van, D. & Max. W.) (PMLR, 2009).
    1. van der Maaten L, Hinton G. Visualizing data using t-SNE. J Mach. Learn. Res. 2008;9:2579–2605.

Publication types

LinkOut - more resources