. 2021 Mar 25;12(1):1858.
doi: 10.1038/s41467-021-22088-1.

Viral infection of cells within the tumor microenvironment mediates antitumor immunotherapy via selective TBK1-IRF3 signaling

Affiliations

Viral infection of cells within the tumor microenvironment mediates antitumor immunotherapy via selective TBK1-IRF3 signaling

Michael C Brown et al. Nat Commun. .

Abstract

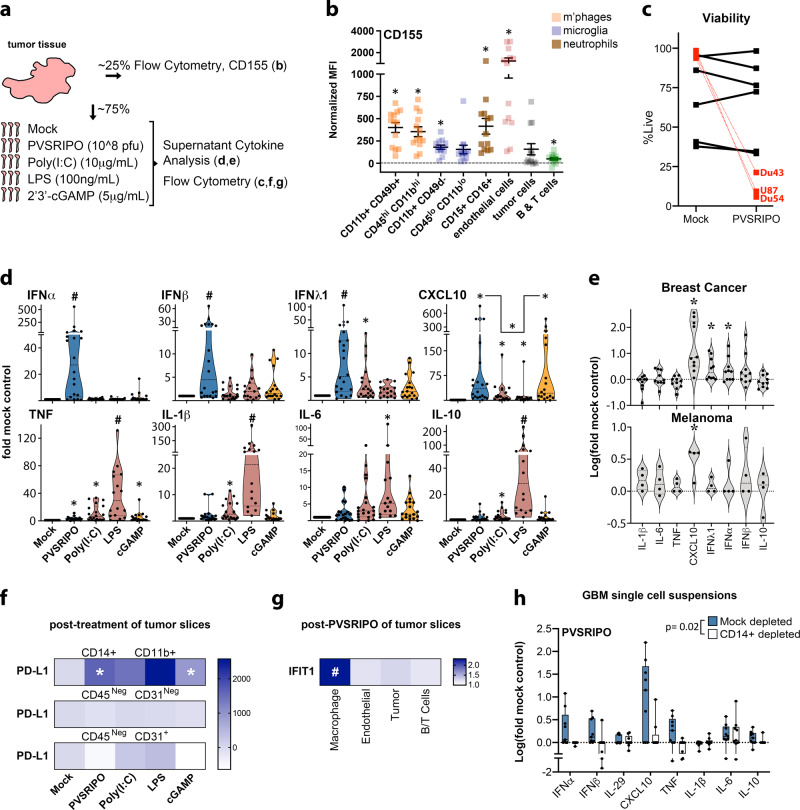
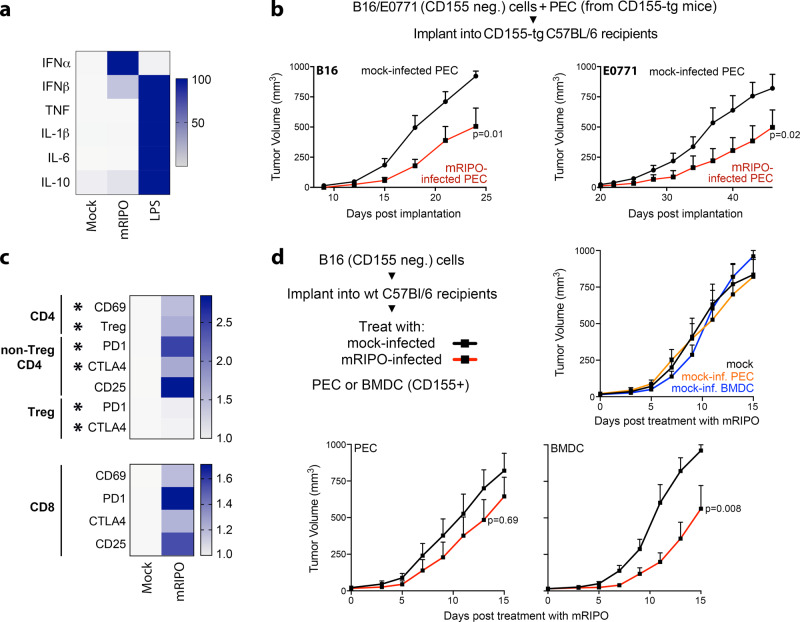
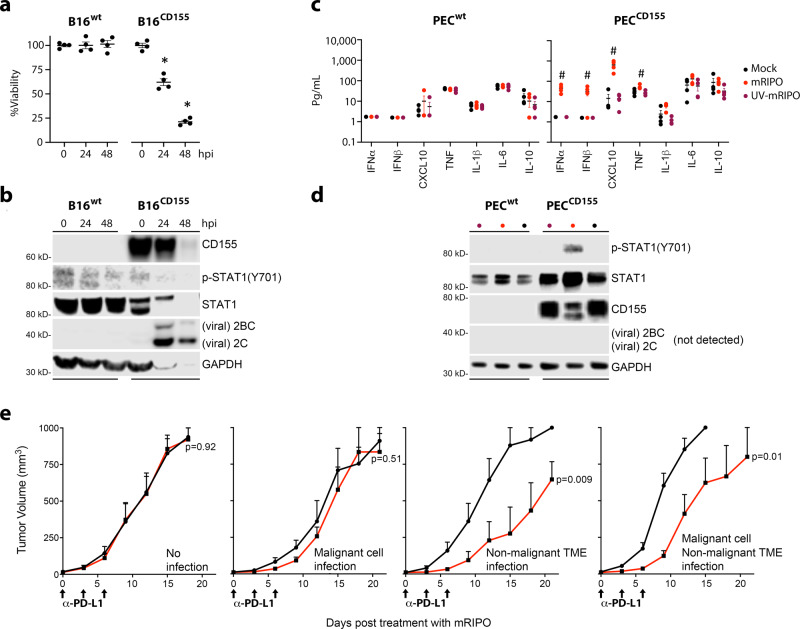
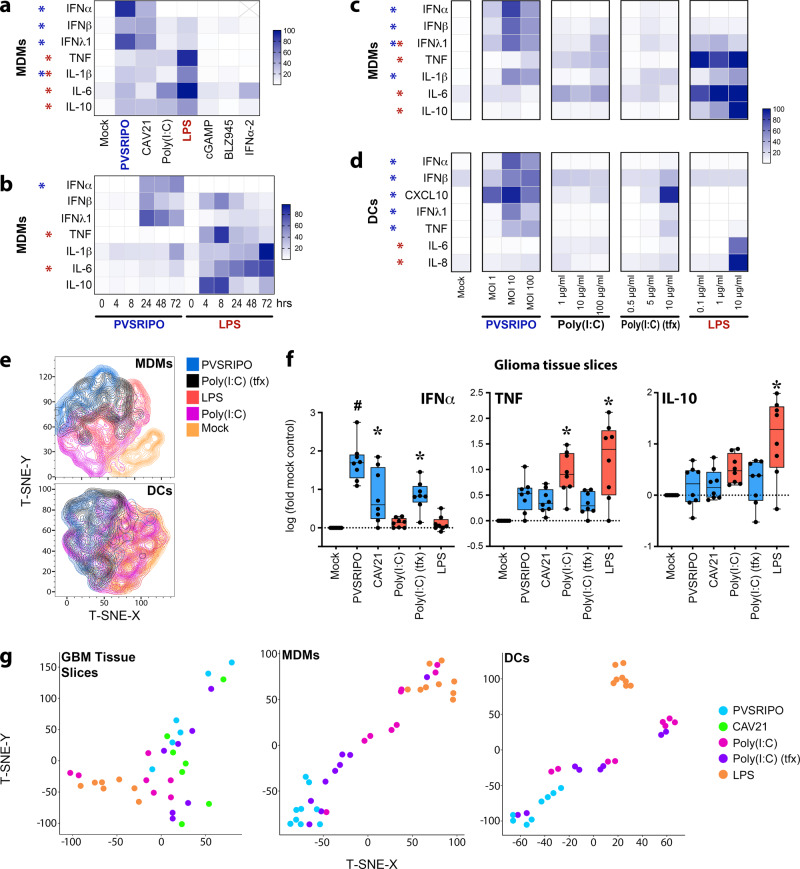
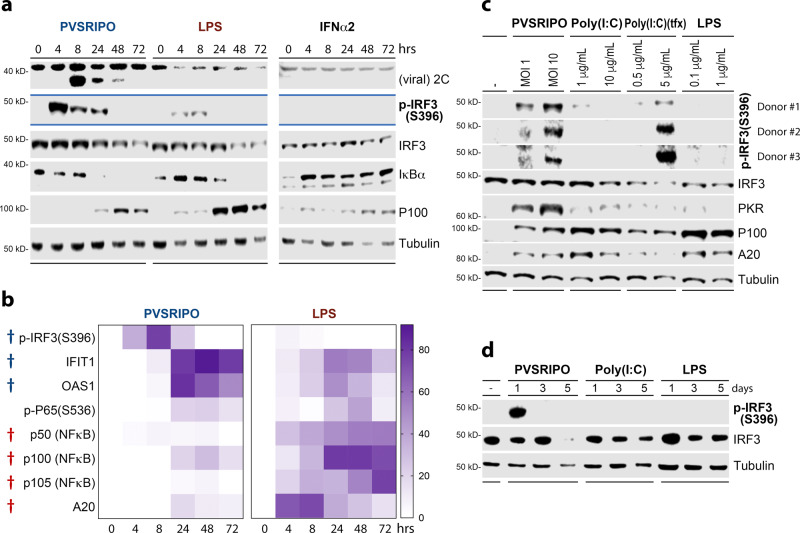
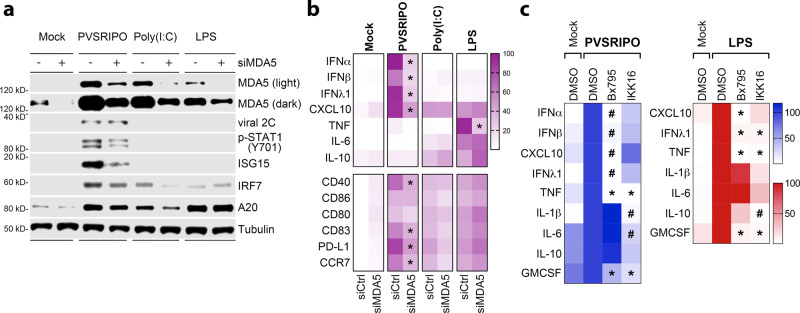
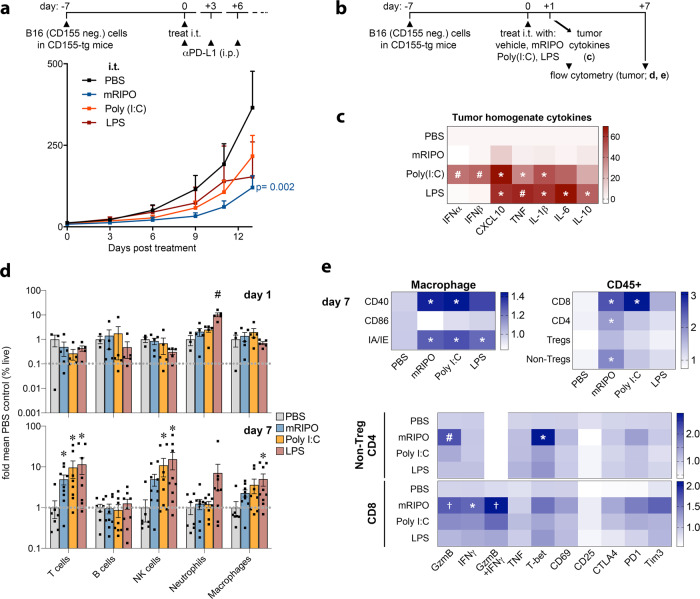
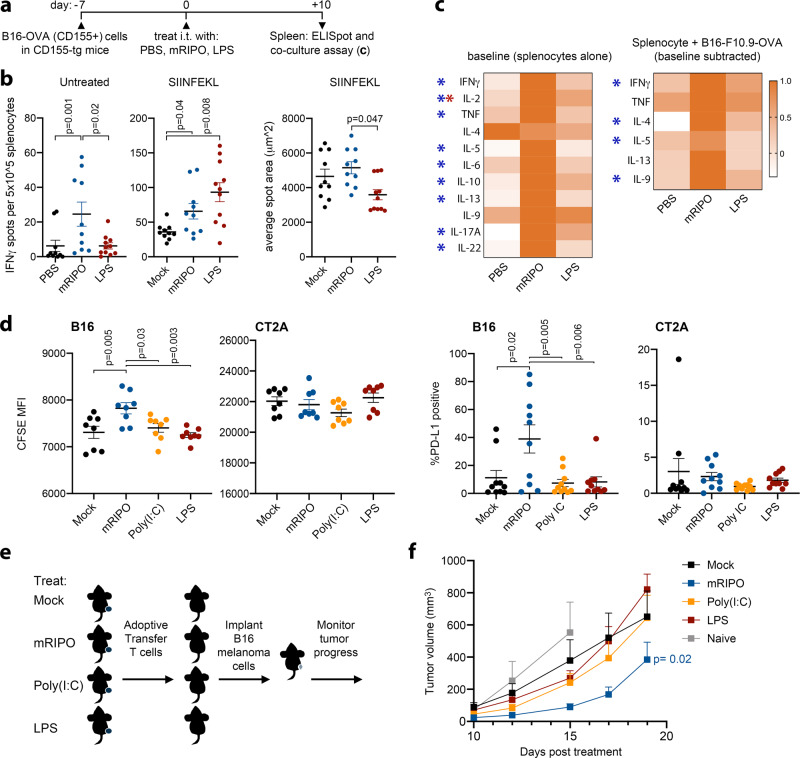
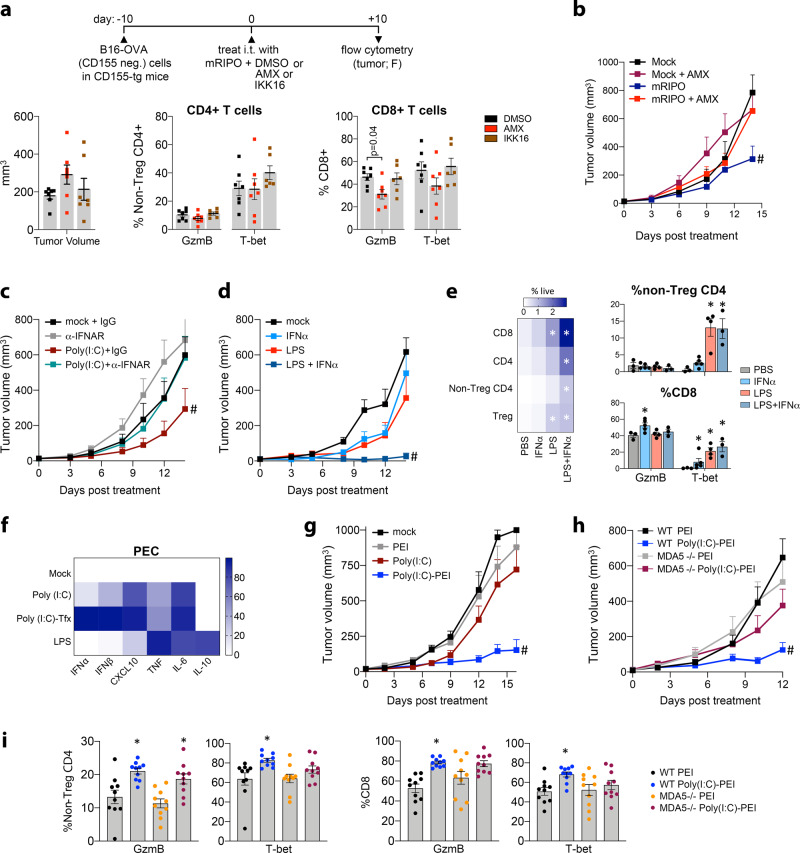
Activating intra-tumor innate immunity might enhance tumor immune surveillance. Virotherapy is proposed to achieve tumor cell killing, while indirectly activating innate immunity. Here, we report that recombinant poliovirus therapy primarily mediates antitumor immunotherapy via direct infection of non-malignant tumor microenvironment (TME) cells, independent of malignant cell lysis. Relative to other innate immune agonists, virotherapy provokes selective, TBK1-IRF3 driven innate inflammation that is associated with sustained type-I/III interferon (IFN) release. Despite priming equivalent antitumor T cell quantities, MDA5-orchestrated TBK1-IRF3 signaling, but not NFκB-polarized TLR activation, culminates in polyfunctional and Th1-differentiated antitumor T cell phenotypes. Recombinant type-I IFN increases tumor-localized T cell function, but does not mediate durable antitumor immunotherapy without concomitant pattern recognition receptor (PRR) signaling. Thus, virus-induced MDA5-TBK1-IRF3 signaling in the TME provides PRR-contextualized IFN responses that elicit functional antitumor T cell immunity. TBK1-IRF3 innate signal transduction stimulates eventual function and differentiation of tumor-infiltrating T cells.


Conflict of interest statement

M.C.B., D.D.B., D.M.A., S.K.N., and M.G. own intellectual property related to this research, which has been licensed to Istari Oncology, Inc. M.G. and D.D.B. are compensated advisors to- and own equity in Istari Oncology, Inc. S.K.N., M.C.B., D.D.B., and M.G. are inventors on patent application PCT/US2017/039953 held/submitted by Duke University that covers the composition and methods for activating antigen-presenting cells with PVSRIPO. All other authors declare no competing interests.

Figures

Fig. 1
Fig. 1. PVSRIPO treatment of ex vivo tumor tissue induces type-I/III IFN in TAMs.
a Fresh glioblastoma (GBM) tissue was analyzed for distribution of surface CD155 by cell type and responsiveness to innate stimuli. b GBM single-cell suspensions were analyzed for CD155 expression via flow cytometry (n = 13 tumors, see Supplementary Fig. 1 for gating); asterisks denote Bonferroni corrected one-sample t test (p < 0.0064, two-tailed, from left to right: p = 0.0001, 0.0001, 0.0001, 0.007, 0.0005, 0.0008, 0.03, 0.005). Normalized MFI (median florescence intensity) was calculated by subtracting isotype control from stained MFI values for each cell type; mean ± SEM is shown. c, d Tumor slices were treated with PVSRIPO, Poly(I:C), lipopolysaccharide (LPS), or 2′3′-cGAMP as shown; pfu = plaque forming units. Post-treatment cell viability was measured after PVSRIPO treatment [7-AAD staining; n = 6 GBM, n = 3 glioma cell lines (DU54, DU43, and U87; mean of 3 experiments per cell line is shown)] (c) and fold-mock control cytokine release in supernatant was examined after all treatments (d; n = 20 for mock, PVSRIPO, and Poly(I:C); n = 15 for LPS; n = 18 for cGAMP). Only induced cytokines are shown; see Supplementary Fig. 2 for patient-specific induction; Tukey’s post-hoc p < 0.05 (two-tailed) vs mock (*), unless otherwise indicated by bracket, or vs all other groups (#). e Ex vivo slice assay using breast cancer tissue (n = 10) and melanoma tissue (n = 4) testing only PVSRIPO as in (d); (*) one-sample t test p < 0.05 (two-tailed; d: CXCL10 p = 0.003, IFN-λ1 p = 0.02, IFN-α p = 0.03; e: CXCL10 p = 0.03). d, e Violin plots present quartiles and median. f, g Dissociated, post-treatment tumor slices were analyzed by flow cytometry for PD-L1 expression [f, n = 6 GBM, normalized MFI—mock MFI is shown, (*) one-sample t test p < 0.05 (two-tailed): CD14+ CD11b+ PVSRIPO p = 0.02, cGAMP p = 0.02] and intracellular IFIT1 expression for indicated cell types [g, n = 4 GBM and 2 breast cancer, fold-mock control MFI for each cell type is shown, (#) Tukey’s post-hoc test vs all other groups: macrophage vs: endothelial p = 0.0005, tumor p = 0.001, B/T cells p = 0.0004]; see Supplementary Fig. 3 for gating and extended data. h Fresh (n = 3) and previously frozen (n = 6) GBM cell suspensions were subjected to mock or CD14+ depletion. Cell count-normalized mock- and CD14+ -depleted suspensions were treated with PVSRIPO (48 h) and supernatant cytokines were measured; box shows median with quartiles and whiskers indicate range; p-value is from paired t-test (two-tailed) comparing the sum of log(fold-mock control) cytokine values; see Supplementary Fig. S4 for extended data.
Fig. 2
Fig. 2. PVSRIPO-infected myeloid cells delay tumor growth.
a Peritoneal exudate cells (PEC) from CD155-tg mice were treated with mock, mRIPO [multiplicity of infection (MOI) of 10], or LPS (100 ng/ml) in vitro; cytokine release was measured and normalized to maximum value for each cytokine across all treatments (n = 2 experiments). b Wt B16 or E0771 cells were mixed with mock or mRIPO-infected CD155-tg PEC and implanted into CD155-tg mice subcutaneous or fat pad, respectively. B16: Mock n = 9, mRIPO n = 8; E0771: n = 9 for both. c E0771 tumor-bearing fat pads were harvested 21 days post E0771 + PEC (−/+mRIPO) implantation and analyzed by flow cytometry (n = 5/group); see Supplementary Fig. 5 for gating strategy. Asterisks indicate t test p < 0.05 (two-tailed; from top to bottom: p = 0.03, 0.01, 0.02, 0.02, 0.01, 0.02), values represent fold-mean mock %positive. d Wt mice bearing B16 tumors were injected with CD155-tg PEC or FLT3L-derived BMDCs after ex vivo pre-treatment with mock or mRIPO (MOI 10; 24 h) as shown; n = 9 mock and mRIPO-infected PEC, n = 8 PEC/BMDC (mock) and mRIPO-infected BMDCs. b, d Mean tumor volume + SEM is shown and p-values are from two-way ANOVA (two-tailed). All experiments were repeated at least twice and a representative series is shown.
Fig. 3
Fig. 3. The non-malignant TME mediates antitumor efficacy of PVSRIPO in mice.
a, b B16WT or B16CD155 cells were treated in vitro with mRIPO (MOI 10). Viability (a) was measured by WST1 assay, values were normalized to %mean “0” time point, and immunoblot analysis (b) of cell lysates for CD155, STAT1, and viral protein (2C, 2BC). c, d PEC from WT (PECWT) or CD155-tg (PECCD155) mice were treated with mock, mRIPO (MOI 10), or UV-inactivated mRIPO (MOI 10 pre-inactivation titer) in vitro (48 h). Supernatant cytokines (c) were measured and immunoblot analysis (d) was performed as in (b). ad n = 4 experiments, (a, c) mean −/+ SEM are shown, symbols (* and #) denote significant Tukey’s post-hoc test (p < 0.05, two-tailed) compared to “0” time point (a, *, p < 0.0001 for both) or all other groups (c, #). e Wt or CD155-tg B16 cells were implanted into wt or CD155-tg mice to test (left to right): no infection (wt cells & hosts, n = 6 mock, 8 mRIPO), malignant cell only infection (B16-CD155-tg, wt hosts, n = 6 mock, 8 mRIPO), TME only infection (wt cells, CD155-tg hosts, n = 7 mock, 6 mRIPO), or TME + malignant cell infection (both CD155-tg, n = 9 mock, 8 mRIPO). Mice were treated intratumor with PBS or mRIPO (1 × 107 pfu) on day 0; PD-L1 blocking antibody was injected i.p. in all groups as shown. Mean tumor volume (mm3) + SEM are shown at each test interval; p-values are from two-way ANOVA (two-tailed); a representative series from two experiments is shown.
Fig. 4
Fig. 4. Cytoplasmic dsRNA induces a distinct innate immune activation profile.
a Monocyte-derived macrophages (MDMs) were treated with putative macrophage activators [PVSRIPO/CAV21, MOI 10; Poly(I:C)/LPS/cGAMP (as in Fig. 1a); BLZ945, 50 nM; IFNα2, 200 IU/ml] for 48 h; cytokine release was measured. Maximum cytokine concentration (pg/ml) was set to 100% for each cytokine; n = 7 experiments from three donors; IFNα values omitted for IFNα2 treatment. b Cytokine release after MDM treatment time course with PVSRIPO or LPS normalized as in (a); n = 5 experiments from 3 donors. (*) significant paired t-test comparing sums of PVSRIPO (blue) vs LPS (red) normalized (%max) values for all time points for each cytokine (p < 0.05, two-tailed; IFNα p = 0.009, TNF p = 0.005, IL-6 p = 0.0007). c, d Supernatant cytokines were measured 48 h after treatment of MDMs (c) or monocyte-derived DCs (d) with escalating doses of stimuli as shown; n = 4 experiments from 2 donors; normalized as in (a). a, c, d (*) indicates Dunnett’s post-hoc test p < 0.05, two tailed, vs mock (a). c, d asterisks are shown if p < 0.05 at any dose. ad Only treatment-induced cytokines are shown; asterisk color indicates significance for LPS (red) or PVSRIPO (blue); see Supplementary Figs. 6 and 7 for extended analyses and gating. e T-SNE plot based on surface activation marker staining after indicated treatments as shown for MDMs (top panel) or DCs (bottom panel). f Ex vivo treatment (48 h) of GBM slices was performed for denoted stimulants [PVSRIPO/CAV21 1 × 108 pfu; Poly(I:C)-tfx 2.5 μg/ml, Poly(I:C) 10 μg/ml, LPS 100 ng/ml], released cytokine concentration (pg/ml) was analyzed and normalized to log-fold-mock control for each cytokine (n = 8); box represents quartiles + median and whiskers indicate range; Tukey’s post-hoc test p < 0.05 (two-tailed) vs mock treatment (*) or all groups (#). g T-SNE plots using fold-mock cytokine values after each treatment for GBM tissue slice culture assay (f), MDMs (c, middle doses), or DCs (d, middle doses).
Fig. 5
Fig. 5. Cytoplasmic dsRNA causes robust, sustained p-IRF3(S396) and ISG expression.
a, b Immunoblot analysis of innate signaling in MDMs after treatment with PVSRIPO (MOI 10), LPS (100 ng/ml), or IFNα2 (200 IU/ml) over time. Additional analyses from four donors, including those quantitated in (b), are presented in Supplementary Fig. 8. b %Max densitometry values for each protein/phospho-protein followed by subtraction of zero time point is shown. (†) Significant paired t test (two-tailed) comparing maximum value (across time course) induced by PVSRIPO (blue) vs LPS (red); IRF3-p (S396) p = 0.0001, IFIT1 p = 0.01, OAS1 p = 0.009, p50 p = 0.008, p100 p = 0.001, p105 p = 0.01, A20 p = 0.006. c Comparison of PVSRIPO, Poly(I:C), Poly(I:C)-tfx, and LPS treatment using respective low and middle doses presented in Fig. 4c by immunoblot for relevant proteins. Three donors were tested, p-IRF3(S396) blots are shown for all donors. d DCs were treated with mock, PVSRIPO, Poly(I:C) or LPS along a time course for immunoblot analysis as shown; n = 3 experiments.
Fig. 6
Fig. 6. MDA5-TBK1 signaling explains the innate inflammatory response to PVSRIPO.
a, b MDMs were transfected with control siRNA or siRNA targeting MDA5 (48 h), followed by treatment with PVSRIPO, Poly(I:C), or LPS (48 h). a Immunoblot analysis of MDA5 depletion, viral protein 2 C, and other relevant proteins. b Cytokine release (top) and cell surface markers of activation (bottom) were measured. Fold-mock control siRNA cytokine concentrations were measured, geometric mean of %max induction values are presented; surface markers were normalized similarly, except baseline (mock control siRNA) %max values were subtracted and mean is shown. N = 6 experiments from two donors, asterisks indicate two-tailed Tukey’s post-hoc test p < 0.05 comparing siMDA5 to siCtrl values for each treatment (PVSRIPO: IFNα p < 0.0001, IFNβ p = 0.0001, IFNλ1 p < 0.0001, CXCL10 p = 0.0005, CD40 p = 0.0005, CD83 p = 0.006, PD-L1 p = 0.01, CCR7 p = 0.004; LPS TNF p < 0.0001). c MDMs were pre-treated (1 h) with DMSO, Bx795 (2 µM; TBK1:IKKε inhibitor), or IKK16 (400 nM: IKKα:β inhibitor) followed by treatment with PVSRIPO (MOI 10) or LPS (100 ng/ml). Supernatant cytokines were analyzed; IFNα/β were not induced by LPS and thus were not included in the heat map; values were normalized from four experiments (two donors) by setting DMSO treatment values to 100% for each cytokine; geometric mean is shown; asterisks denote Tukey’s post-hoc p < 0.05 (two-tailed) test vs DMSO control (*) or all groups (#) for each cytokine. See Supplementary Fig. 9 for extended data.
Fig. 7
Fig. 7. Virotherapy of the TME results in distinct TIL phenotypes.
a Wt B16.F10 tumors implanted in CD155-tg mice were treated with i.t. mock (PBS), mRIPO (107 pfu), LPS (30 μg), or Poly(I:C) (30 μg) with anti-PD-L1 therapy delivered i.p. to all groups as shown [n = 9 LPS, n = 8 for all other groups]; p-value is from two-way ANOVA vs mock. b CD155-tg mice bearing wt B16 tumors were treated with mRIPO (3 × 107 pfu), Poly(I:C) (30 μg), or LPS (30 μg) for analyses in (ce). c Tumor homogenate cytokines represented as %max for each cytokine followed by subtraction of mean PBS values (n = 4 PBS, n = 5 others) were measured 1 day after treatment. d Tumor immune cell subtypes as %live singlets at days 1 (top; n = 3 PBS, n = 5 others) and 7 [bottom; pooled from 2 experiments: n = 7 PBS, n = 8 Poly(I:C), n = 9 others]; mean −/+ SEM is shown. e TAM (n = same as d, day 7) or T cell activation markers for three experiments [n = 9 PBS, n = 11 mRIPO/Poly(I:C), n = 12 LPS]. Extended associated analyses and gating are shown in Supplementary Fig. 10; (ce) asterisks denote two-tailed Tukey’s post-hoc test p < 0.05 compared to (*) mock, (†) LPS, or (#) all groups.
Fig. 8
Fig. 8. Virotherapy selectively induces functional antitumor T cell immunity.
a B16.F10.9CD155-OVA-implanted CD155-tg mice were treated as shown. b IFNγ ELISpot analysis of untreated splenocytes (left), or splenocytes cultured in the presence of SIINFEKL peptide (middle; untreated counts were subtracted). Right panel depicts average spot area (n = 10 for PBS/ mRIPO, n = 11 LPS pooled from 2 experiments); see Supplementary Fig. 11 for extended data. P-values are from Tukey’s post-hoc (two-tailed) test. c Splenocytes from a subset of mice in (b) were tested in 48 h culture alone or with B16.F10.9-OVA cells (right). Supernatant cytokines are plotted for baseline (left) or antigen-specific secretion (right; baseline secretion was subtracted from B16.F10.9.OVA co-culture values). Heatmaps were normalized to maximum value for each cytokine (n = 8 mock/LPS; n = 7 mRIPO); only cytokines secreted above baseline are shown. (*) Tukey’s post-hoc p < 0.05 (two-tailed), baseline mRIPO vs mock (blue asterisks): IFNγ p = 0.03, IL-2 p = 0.004, TNF p = 0.03, IL-5 p = 0.01, IL-6 p = 0.02, IL-10 p = 0.04, IL-13 p = 0.008, IL-17A p = 0.01, IL-22 p = 0.004; baseline LPS vs mock (red asterisk): IL-2 p = 0.03; baseline subtracted mRIPO vs mock (blue asterisks): IFNγ p = 0.01, IL-4 p = 0.01, IL-5 p = 0.047, IL-9 p = 0.01. d Tumor-draining lymph nodes (TDLNs, inguinal lymph node, n = 8 mice/group) from CD155-tg mice bearing wt B16 tumors treated with mock, mRIPO, Poly(I:C), or LPS as in Fig. 8a were harvested 7 days after intratumor treatment. TDLN cells (5 × 105) were co-cultured with carboxyfluorescein succinimidyl ester (CFSE)-labeled B16 or CT2A cells in vitro (3 × 103). CFSE median florescence intensity (left panels) and PD-L1 expression (right panels) were measured by flow cytometry for both cell lines after co-culture (48 h); see Supplementary Fig. 12 for gating and extended analyses; a representative series from three experiments is shown. P-values indicate Tukey’s post-hoc two-tailed test. e, f Wt B16 tumor-bearing mice were treated as in (d) (n = 5/group). Ten days after treatment splenocytes were harvested and pooled by treatment. T cells were isolated by negative selection and adoptively transferred into naïve mice (2 × 106 T cells per mouse) receiving B16 wt tumor cell implants on the same day; mean tumor volume + SEM is shown (f, n = 8 Mock/Poly(I:C), n = 7 mRIPO, n = 6 LPS, n = 4 naïve). P-value is from two-way ANOVA (two-tailed) comparing mice receiving T cells from mRIPO vs mock-treated mice; a representative series from two experiments is shown.
Fig. 9
Fig. 9. MDA5-TBK1-IRF3 signaling within the TME mediates antitumor efficacy.
a (top) Treatment strategy combining mRIPO with DMSO, Amlexanox (AMX; TBK1:IKKε inhibitor, 250 nmol), or IKK16 (IKKα/β inhibitor, 140 nmol). a (bottom) Tumor volume at the time of harvest (left) and analysis of intratumor CD4+ (middle) and CD8+ (right) T cell expression of GzmB and T-bet (n = 7 DMSO/AMX, n = 6 IKK16; data bars represent mean −/+ SEM; Supplementary Fig. 13 presents extended data). P value indicates Tukey’s post-hoc two-tailed test. b Mice were treated with mock or mRIPO −/+ AMX (250 nm) as in (a) and mean tumor volume + SEM is shown (n = 8 mock + AMX, n = 7/group all others); (#) two-way ANOVA p < 0.05 vs all groups (two-tailed), mRIPO vs: mock p = 0.0003, mock + AMX p = 0.01, mRIPO + AMX p = 0.01. c Mock or Poly(I:C) (30 μg) was co-injected with 100 μg of isotype control IgG antibody or IFNAR-blocking antibody (all intratumor) into B16-F10-OVA tumor-bearing mice; mean tumor volume + SEM is shown (n = 10/group). (#) two-way ANOVA p < 0.05 vs all groups (two-tailed), Poly (I:C) + IgG vs: mock + IgG p = 0.005, mock + α-IFNAR p < 0.001, Poly (I:C) + α-IFNAR p = 0.02. d, e Mock or LPS was injected with and without 5000 IU of IFNα, mean tumor volume + SEM is shown (d, n = 8/group); (#) two-way ANOVA p < 0.05 vs all groups (two-tailed), LPS + IFNα vs mock and IFNα p < 0.0001, LPS p = 0.002. e Thirteen days after treatment, tumors were harvested from tumor-bearing, surviving mice for flow cytometry analysis (n = 3 mock/LPS + IFNα, n = 5 IFNα, n = 4 LPS only); heatmap (left) represents mean % live cells, data bars (right) represent mean −/+ SEM; see Supplementary Fig. 14a for extended analyses; (*) Tukey’s post-hoc p < 0.05 (two-tailed) vs PBS control. f Mouse PEC were treated with mock, Poly(I:C) (10 μg/ml), Poly(I:C)-tfx (250 ng/ml Poly I:C-lyovec), or LPS (100 ng/ml); supernatant cytokines were measured, %maximum values were calculated, and mock values were subtracted from all other values; mean values are presented (n = 2 experiments). g Mice were treated i.t. with mock, PEI, Poly(I:C) (30 μg), or Poly(I:C) (8 μg) complexed with PEI [Poly(I:C)-PEI]. Tumor volume + SEM is shown (n = 7 PEI and Poly(I:C)-PEI, n = 6/group all others); see Supplementary Fig. 14b for associated flow cytometry analysis at day 16. (#) two-way ANOVA p < 0.05 vs all groups (two-tailed), Poly (I:C)-PEI vs all other treatment groups p < 0.0001. h WT or MDA5−/− mice bearing B16 tumors were treated with PEI or Poly(I:C)-PEI as in (g). Tumor volume + SEM is shown (n = 10/group WT; n = 11/group MDA5−/−); (#) two-way ANOVA p < 0.05 vs all groups (two-tailed), MDA5 −/− Poly (I:C)-PEI vs WT and MDA5−/− PEI p < 0.0001, vs MDA5 −/− PEI p = 0.001. i B16 wt tumors from mice treated as in (h, n = 10/group) were harvested eight days post-treatment and analyzed for T-bet and GzmB expression in tumor-infiltrating T cells, see Supplementary Fig. 14c for extended data; data bars depict mean −/+ SEM, (*) Tukey’s post-hoc p < 0.05 (two-tailed) vs WT PEI; from left to right asterisks: p = 0.004, 0.007, 0.02, 0.0006, 0.03. All experiments were repeated at least twice and representative series are shown.

Similar articles

Cited by

References

    1. Aleynick M, Svensson-Arvelund J, Flowers CR, Marabelle A, Brody JD. Pathogen molecular pattern receptor agonists: treating cancer by mimicking infection. Clin. Cancer Res. 2019;25:6283–6294. doi: 10.1158/1078-0432.CCR-18-1800. - DOI - PMC - PubMed
    1. Corrales L, et al. Direct activation of STING in the tumor microenvironment leads to potent and systemic tumor regression and immunity. Cell Rep. 2015;11:1018–1030. doi: 10.1016/j.celrep.2015.04.031. - DOI - PMC - PubMed
    1. Salazar AM, Erlich RB, Mark A, Bhardwaj N, Herberman RB. Therapeutic in situ autovaccination against solid cancers with intratumoral poly-ICLC: case report, hypothesis, and clinical trial. Cancer Immunol. Res. 2014;2:720–724. doi: 10.1158/2326-6066.CIR-14-0024. - DOI - PubMed
    1. Gromeier M, Lachmann S, Rosenfeld MR, Gutin PH, Wimmer E. Intergeneric poliovirus recombinants for the treatment of malignant glioma. Proc. Natl Acad. Sci. USA. 2000;97:6803–6808. doi: 10.1073/pnas.97.12.6803. - DOI - PMC - PubMed
    1. Desjardins A, et al. Recurrent glioblastoma treated with recombinant poliovirus. N. Engl. J. Med. 2018;379:150–161. doi: 10.1056/NEJMoa1716435. - DOI - PMC - PubMed

Publication types

MeSH terms