. 2021 Mar 25;7(1):18.
doi: 10.1038/s41421-021-00250-9.

Immune memory in convalescent patients with asymptomatic or mild COVID-19

Affiliations

Immune memory in convalescent patients with asymptomatic or mild COVID-19

Quan-Xin Long et al. Cell Discov. .

Abstract

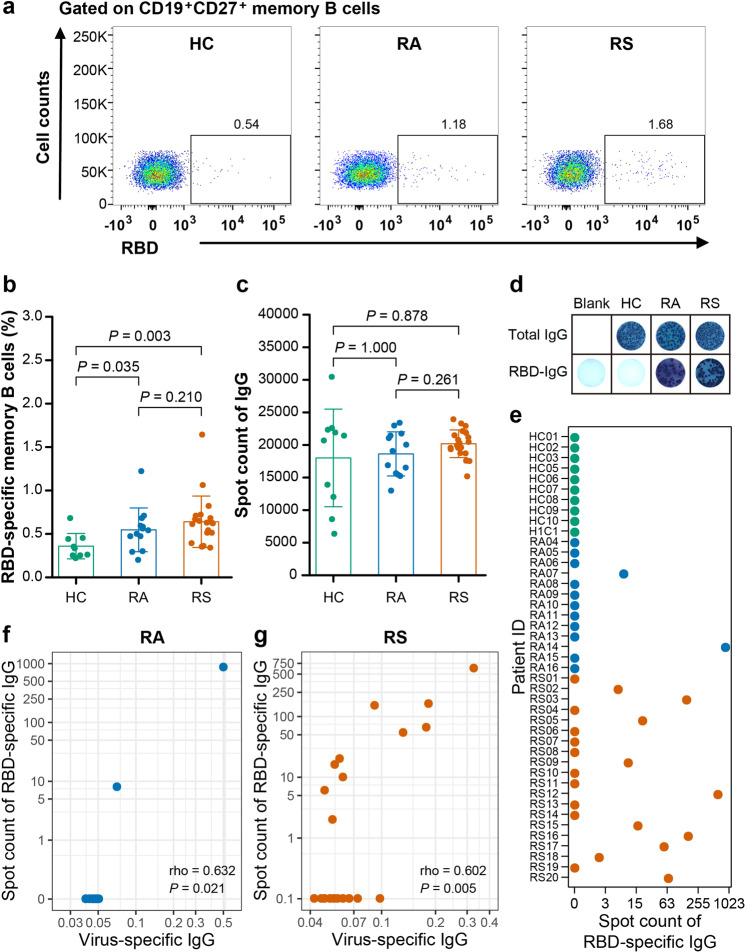
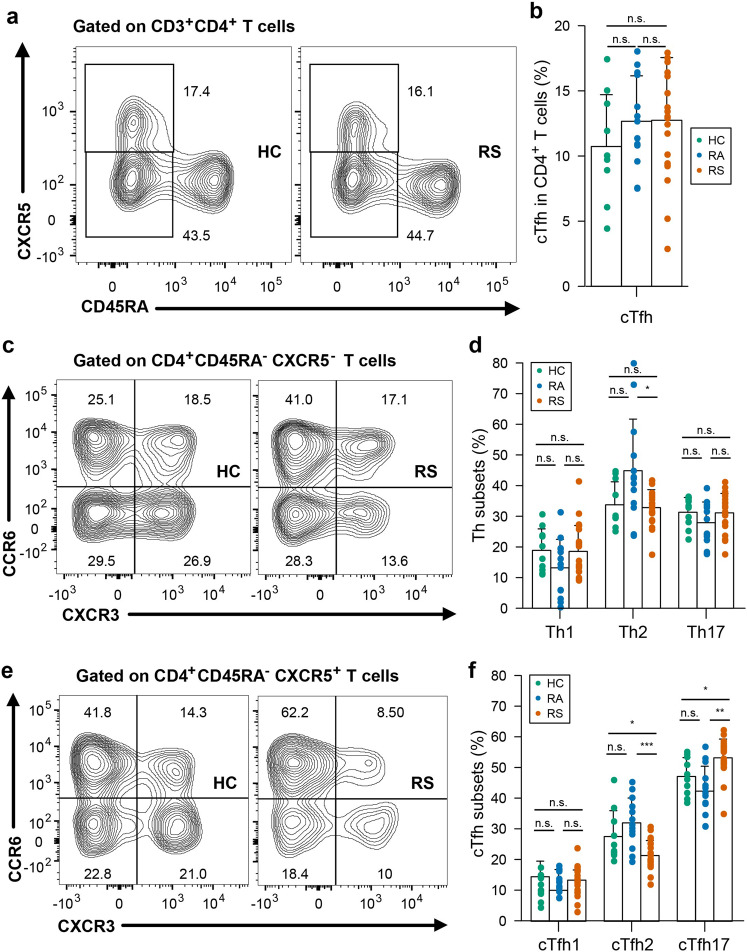
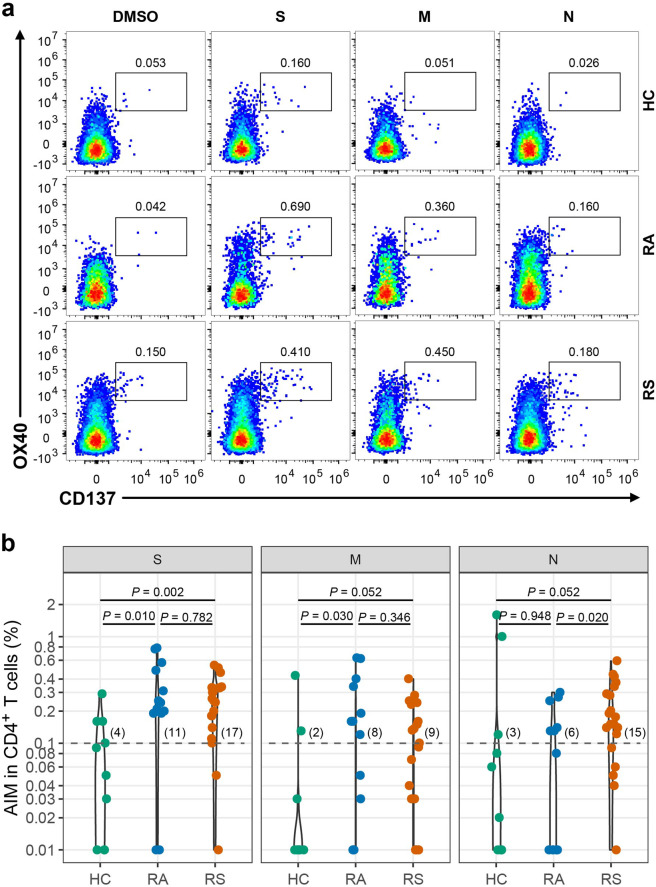
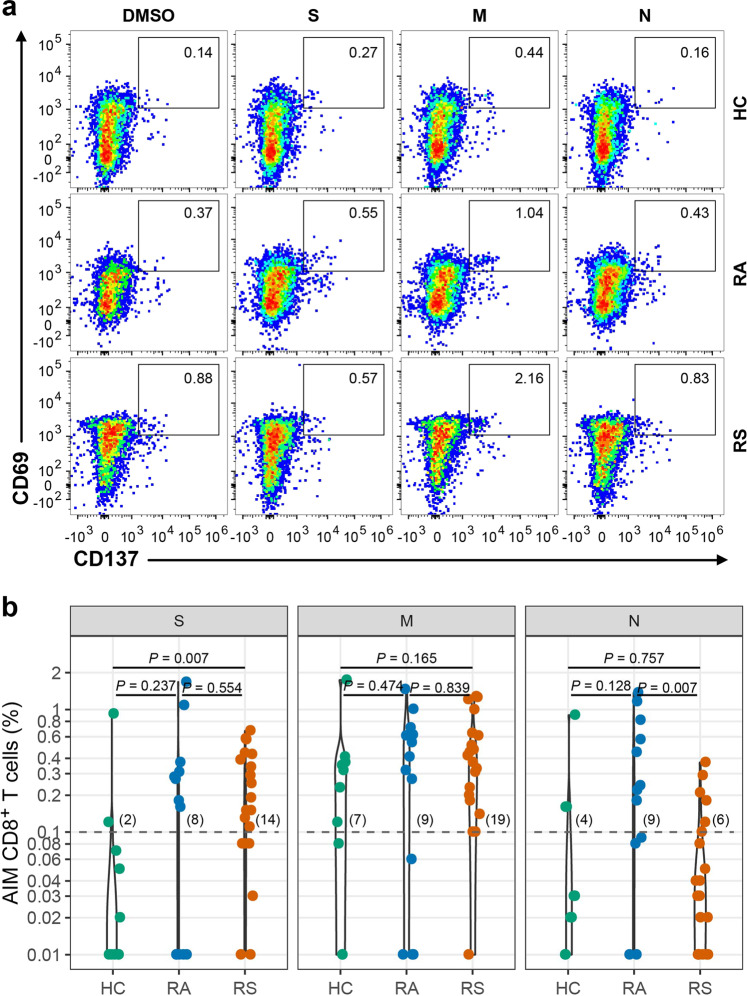
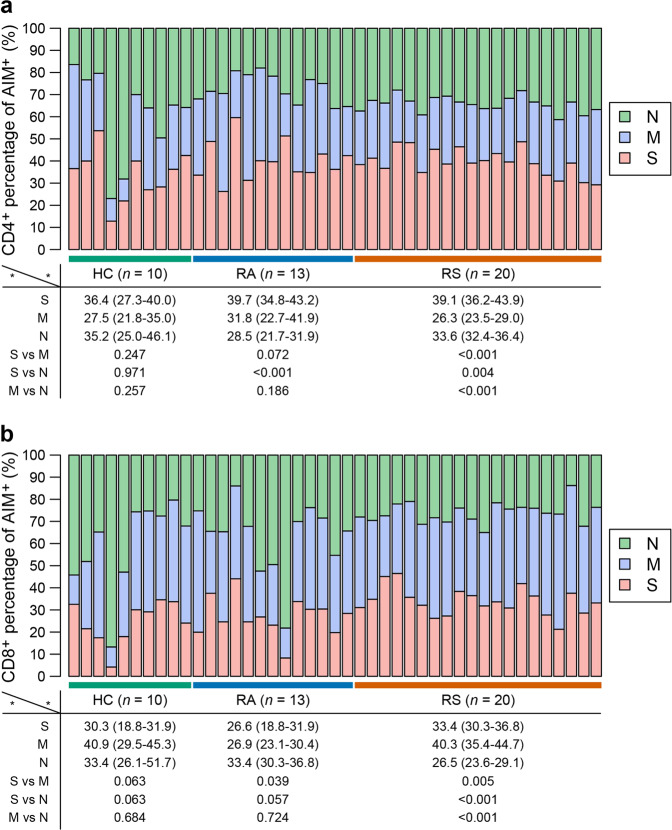
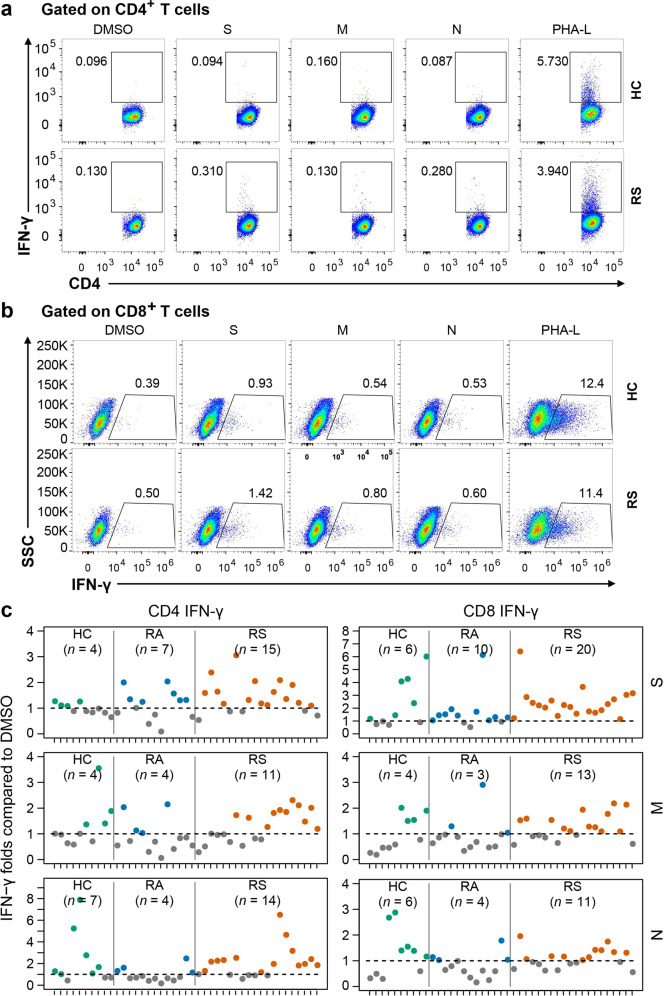
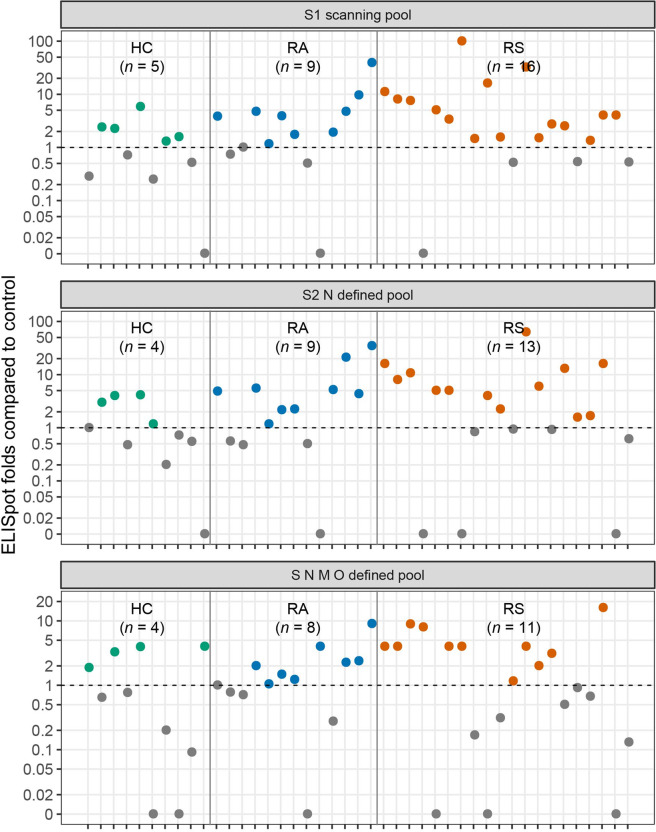
It is important to evaluate the durability of the protective immune response elicited by primary infection with severe acute respiratory syndrome coronavirus 2 (SARS-CoV-2). Here, we systematically evaluated the SARS-CoV-2-specific memory B cell and T cell responses in healthy controls and individuals recovered from asymptomatic or symptomatic infection approximately 6 months prior. Comparatively low frequencies of memory B cells specific for the receptor-binding domain (RBD) of spike glycoprotein (S) persisted in the peripheral blood of individuals who recovered from infection (median 0.62%, interquartile range 0.48-0.69). The SARS-CoV-2 RBD-specific memory B cell response was detected in 2 of 13 individuals who recovered from asymptomatic infection and 10 of 20 individuals who recovered from symptomatic infection. T cell responses induced by S, membrane (M), and nucleocapsid (N) peptide libraries from SARS-CoV-2 were observed in individuals recovered from coronavirus disease 2019 (COVID-19), and cross-reactive T cell responses to SARS-CoV-2 were also detected in healthy controls.


Conflict of interest statement

The authors declare no competing interests.

Figures

Fig. 1
Fig. 1. Memory B cell repertoire in individuals recovered from COVID-19.
a, b Flow cytometry analysis (a) of the percentages (b) of SARS-CoV-2 RBD-specific memory B cells within the CD19+ CD27+ memory B cells of the PBMCs from recovered individuals and healthy controls (HC). Freshly isolated PBMCs were stimulated in vitro for 5 days with R848 and IL-2. After 5 days in culture, these cells were plated onto commercial ELISpot plates. c The counts of cells that produced total IgG in per million cultured PBMCs from recovered individuals and healthy controls. d Representative ELISpot dots in recovered individuals and healthy controls. e The counts of cells that produced RBD-specific IgG in per million cultured PBMCs from recovered individuals and healthy controls. f Correlation analysis between RBD-specific ELISpot dot number and virus-specific IgG levels in supernatant after the R848 stimulation on PBMC from individuals recovered from asymptomatic. g Correlation analysis between RBD-specific ELISpot dot number and virus-specific IgG levels in supernatant after the R848 stimulation on PBMC from individuals recovered from symptomatic. Each symbol represents an individual throughout. Data in b, c were analyzed using unpaired, two-sided Mann–Whitney U test, and data in f, g were analyzed using Spearman’s rank correlation test.
Fig. 2
Fig. 2. T cell subsets in individuals recovered from COVID-19.
Blood samples were collected from individuals recovered from COVID-19 and healthy controls, PBMC were isolated for analysis of T cell subsets. a Representative flow plots for the expression of CD45RA and CXCR5 within the CD4+ populations from healthy controls and recovered COVID-19. b Proportions of cTfh cells (CD45RA-CXCR5+) in CD4+ T cell populations from HC, RS and RA. c Representative flow plots for the expression of CXCR3 and CCR6 within the CD4+CD45RA-CXCR5-populations from healthy controls and recovered COVID-19. d Proportions of Th subsets within the CD4+CD45RA-CXCR5- populations from HC, RS, and RA. e Representative flow plots for the expression of CXCR3 and CCR6 within the cTfh populations from healthy controls and recovered COVID-19. f Proportions of cTfh subsets within the cTfh populations from HC, RS, and RA. Each symbol represents an individual throughout. RS, individuals recovered from COVID-19 with symptoms (n = 20); RA, individuals recovered from asymptomatic (n = 13); HC, healthy controls (n = 10). Data in b, d, f were analyzed using unpaired, two-sided Mann–Whitney U test. n.s., not significant.
Fig. 3
Fig. 3. SARS-CoV-2 specific CD4+ T cell response of recovered COVID-19 individuals.
a Representative flow plots for the expressions of OX40 and CD137 within CD3+CD4+ T cells of cultured PBMCs stimulated with SARS-CoV-2 peptide library in different subjects. b SARS-CoV-2-specific CD4+ T cells measured as percentage of AIM+ (OX40+CD137+) after stimulation of PBMCs with peptide pools encompassing S, M, and N. Each symbol represents an individual throughout. RS, individuals recovered from COVID-19 with symptoms (n = 20); RA, individuals recovered from asymptomatic (n = 13); HC, healthy controls (n = 10). Data were background subtracted against DMSO negative control, and if the value is greater than 0.1%, the individual is considered as response to peptide library stimulation. The number of response individuals is shown in brackets, and the dotted line indicated the cut-off for positive responder. The comparisons between two groups were performed by using unpaired, two-sided Mann–Whitney U test. S, spike; M, membrane; N, nucleocapsid.
Fig. 4
Fig. 4. SARS-CoV-2-specific CD8+ T cell response of recovered COVID-19 individuals.
a Representative flow plots for the expressions of CD69 and CD137 within CD3+CD4+ T cells of cultured PBMCs stimulated with SARS-CoV-2 peptide library in different subjects. b SARS-CoV-2-specific CD8+ T cells measured as percentage of AIM+ (CD69+CD137+) after stimulation of PBMCs with peptide pools encompassing S, M, and N. Each symbol represents an individual throughout. RS, individuals recovered from COVID-19 with symptoms (n = 20); RA, individuals recovered from asymptomatic (n = 13); HC, healthy controls (n = 10). Data were background subtracted against DMSO negative control, and if the value is greater than 0.1%, the individual is considered as a response to peptide library stimulation. The number of response individuals is shown in brackets, and the dotted line indicated the cut-off for positive responder. The comparisons between two groups were performed by using unpaired, two-sided Mann–Whitney U test. S, spike; M, membrane; N, nucleocapsid.
Fig. 5
Fig. 5. The composition of SARS-CoV-2 response in each individual is shown as a percentage of the total detected T cell response.
a The composition of SARS-CoV-2-specific CD4+ T cell response (OX40+CD137+) in individuals. b The composition of SARS-CoV-2-specific CD8+ T cell response (CD69+CD137+) in individuals. The percentage of S, M, and N-specific CD4+ or CD8+ T cell response was shown as median (IQR), and were performed by using two-sided Mann–Whitney U test. S, spike; M, membrane; N, nucleocapsid. RS, individuals recovered from COVID-19 with symptoms (n = 20); RA, individuals recovered from asymptomatic (n = 13); HC, healthy controls (n = 10).
Fig. 6
Fig. 6. Percentage of IFN-γ-producing T cell in response to different peptide library.
Isolated PBMCs were stimulated with specific peptide library of SARS-CoV-2 for 24 h, and the proportions of IFN-γ-producing T cell within the CD4+ or CD8+ T cell population were determined with intracellular staining. a, b Representative flow plots for the expressions of IFN-γ within CD3+CD4+ T cells (a) or CD3+CD8+ T cells (b) of cultured PBMCs from healthy controls and recovered COVID-19. c Fold changes between percentage of IFN-γ+ producing CD4+ or CD8+ T cells stimulated with SARS-CoV-2 peptide library and with DMSO. Number of stimulation response individuals (fold change > 1) are depicted in brackets. The dotted line indicated the cut-off for positive responder. Each symbol represents an individual throughout. S, spike; M, membrane; N, nucleocapsid. RS, individuals recovered from COVID-19 with symptoms (n = 20); RA, individuals recovered from asymptomatic (n = 13); HC, healthy controls (n = 10).
Fig. 7
Fig. 7. The SARS-CoV-2-specific T cell response measured by ELISpot in COVID-19 recovered individuals.
ELISpot results shown as the fold changes of peptide stimulation were presented as the spot number ratio between peptide stimulation and DMSO stimulation. Number of stimulation response individuals (fold change > 1) are depicted in brackets. The dotted line indicated the cut-off for positive responder. RS, individuals recovered from COVID-19 with symptoms (n = 20); RA, individuals recovered from asymptomatic (n = 13); HC, healthy controls (n = 10).

Similar articles

  • SARS-CoV-2-specific T cell immunity in cases of COVID-19 and SARS, and uninfected controls.
    Le Bert N, Tan AT, Kunasegaran K, Tham CYL, Hafezi M, Chia A, Chng MHY, Lin M, Tan N, Linster M, Chia WN, Chen MI, Wang LF, Ooi EE, Kalimuddin S, Tambyah PA, Low JG, Tan YJ, Bertoletti A. Le Bert N, et al. Nature. 2020 Aug;584(7821):457-462. doi: 10.1038/s41586-020-2550-z. Epub 2020 Jul 15. Nature. 2020. PMID: 32668444
  • Characterization of pre-existing and induced SARS-CoV-2-specific CD8+ T cells.
    Schulien I, Kemming J, Oberhardt V, Wild K, Seidel LM, Killmer S, Sagar, Daul F, Salvat Lago M, Decker A, Luxenburger H, Binder B, Bettinger D, Sogukpinar O, Rieg S, Panning M, Huzly D, Schwemmle M, Kochs G, Waller CF, Nieters A, Duerschmied D, Emmerich F, Mei HE, Schulz AR, Llewellyn-Lacey S, Price DA, Boettler T, Bengsch B, Thimme R, Hofmann M, Neumann-Haefelin C. Schulien I, et al. Nat Med. 2021 Jan;27(1):78-85. doi: 10.1038/s41591-020-01143-2. Epub 2020 Nov 12. Nat Med. 2021. PMID: 33184509
  • Rapid generation of durable B cell memory to SARS-CoV-2 spike and nucleocapsid proteins in COVID-19 and convalescence.
    Hartley GE, Edwards ESJ, Aui PM, Varese N, Stojanovic S, McMahon J, Peleg AY, Boo I, Drummer HE, Hogarth PM, O'Hehir RE, van Zelm MC. Hartley GE, et al. Sci Immunol. 2020 Dec 22;5(54):eabf8891. doi: 10.1126/sciimmunol.abf8891. Sci Immunol. 2020. PMID: 33443036 Free PMC article.
  • HCoV- and SARS-CoV-2 Cross-Reactive T Cells in CVID Patients.
    Steiner S, Sotzny F, Bauer S, Na IK, Schmueck-Henneresse M, Corman VM, Schwarz T, Drosten C, Wendering DJ, Behrends U, Volk HD, Scheibenbogen C, Hanitsch LG. Steiner S, et al. Front Immunol. 2020 Dec 23;11:607918. doi: 10.3389/fimmu.2020.607918. eCollection 2020. Front Immunol. 2020. PMID: 33424856 Free PMC article.
  • SARS-CoV-2-reactive T cells in healthy donors and patients with COVID-19.
    Braun J, Loyal L, Frentsch M, Wendisch D, Georg P, Kurth F, Hippenstiel S, Dingeldey M, Kruse B, Fauchere F, Baysal E, Mangold M, Henze L, Lauster R, Mall MA, Beyer K, Röhmel J, Voigt S, Schmitz J, Miltenyi S, Demuth I, Müller MA, Hocke A, Witzenrath M, Suttorp N, Kern F, Reimer U, Wenschuh H, Drosten C, Corman VM, Giesecke-Thiel C, Sander LE, Thiel A. Braun J, et al. Nature. 2020 Nov;587(7833):270-274. doi: 10.1038/s41586-020-2598-9. Epub 2020 Jul 29. Nature. 2020. PMID: 32726801

Cited by

References

    1. Zhou P, et al. A pneumonia outbreak associated with a new coronavirus of probable bat origin. Nature. 2020;579:270–273. doi: 10.1038/s41586-020-2012-7. - DOI - PMC - PubMed
    1. Huang C, et al. Clinical features of patients infected with 2019 novel coronavirus in Wuhan, China. Lancet. 2020;395:497–506. doi: 10.1016/S0140-6736(20)30183-5. - DOI - PMC - PubMed
    1. Holly MK, Diaz K, Smith JG. Defensins in viral infection and pathogenesis. Annu. Rev. Virol. 2017;4:369–391. doi: 10.1146/annurev-virology-101416-041734. - DOI - PubMed
    1. Liao M, et al. Single-cell landscape of bronchoalveolar immune cells in patients with COVID-19. Nat. Med. 2020;26:842–844. doi: 10.1038/s41591-020-0901-9. - DOI - PubMed
    1. Giamarellos-Bourboulis EJ, et al. Complex immune dysregulation in COVID-19 patients with severe respiratory failure. Cell Host Microbe. 2020;27:992–1000 e1003. doi: 10.1016/j.chom.2020.04.009. - DOI - PMC - PubMed

LinkOut - more resources