. 2021 Mar 25;12(1):1851.
doi: 10.1038/s41467-021-22188-y.

Predicting treatment response from longitudinal images using multi-task deep learning

Affiliations

Predicting treatment response from longitudinal images using multi-task deep learning

Cheng Jin et al. Nat Commun. .

Abstract

Radiographic imaging is routinely used to evaluate treatment response in solid tumors. Current imaging response metrics do not reliably predict the underlying biological response. Here, we present a multi-task deep learning approach that allows simultaneous tumor segmentation and response prediction. We design two Siamese subnetworks that are joined at multiple layers, which enables integration of multi-scale feature representations and in-depth comparison of pre-treatment and post-treatment images. The network is trained using 2568 magnetic resonance imaging scans of 321 rectal cancer patients for predicting pathologic complete response after neoadjuvant chemoradiotherapy. In multi-institution validation, the imaging-based model achieves AUC of 0.95 (95% confidence interval: 0.91-0.98) and 0.92 (0.87-0.96) in two independent cohorts of 160 and 141 patients, respectively. When combined with blood-based tumor markers, the integrated model further improves prediction accuracy with AUC 0.97 (0.93-0.99). Our approach to capturing dynamic information in longitudinal images may be broadly used for screening, treatment response evaluation, disease monitoring, and surveillance.


Conflict of interest statement

The Authors declare no competing interests.

Figures

Fig. 1
Fig. 1. Clinical workflow and study design.
a Diagnosis, treatment, and response evaluation for patients with rectal cancer. MRI examinations and blood tests were performed for each patient before and after neoadjuvant chemoradiotherapy. b Development and validation of a deep learning system to predict pathologic complete response from longitudinal imaging.
Fig. 2
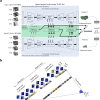
Fig. 2. Proposed network model for response prediction (3D RP-Net).
a The multi-task deep learning network consists of two subnetworks: one for feature extraction and tumor segmentation, and one for response prediction. The network takes pre- and post-therapy images as inputs and performs two tasks simultaneously: tumor segmentation and response prediction. b Depth-wise convolution of pre- and post-therapy images at multiple network layers for multi-scale feature integration and response prediction.
Fig. 3
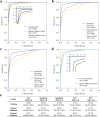
Fig. 3. Performance for predicting pathologic complete response.
a Receiver operating characteristic (ROC) curves of the proposed 3D RP-Net in the training and two validation cohorts. b ROC curves of three different network models in the internal validation cohort. c same as (b), except for external validation cohort. d ROC curves in the subgroup of patients with upper, middle, and lower rectal cancer in the internal validation cohort. e Detailed information for prediction performance of the proposed model in the study cohorts. AUC, area under the ROC curve; PPV, positive predictive value; NPV, negative predictive value.
Fig. 4
Fig. 4. Network visualization and interpretation.
Pre- and post-therapy MRI and the corresponding feature map visualization in key channels at the bottom of 3D RP-Net for two representative patients who were correctly predicted to be pCR and non-pCR, respectively. In the 107th channel corresponding to positive lymph nodes, there was no activation (maximum magnitude <50%) in either case. In the 162nd channel corresponding to EMVI, feature map was not activated in the case with pCR, while the overall magnitude decreased by only 9.2% (p = 0.89) with non-pCR. In the 201st channel corresponding to submucosal lesions, the overall magnitude of the feature map decreased by 88.9% (p < 0.001) with pCR, but decreased by only 11.3% (p = 0.67) with non-pCR. In the 219th channel corresponding to mesorectum invasion, the overall magnitude of the feature map decreased by 85.7% (p < 0.001) with pCR, but decreased by only 16.7% (p = 0.41) with non-pCR. In the 228th channel corresponding to tumor invasion, the overall magnitude of the feature map decreased by 90.5% (p < 0.001) with pCR, while tumor invasion was not activated with non-pCR. p values were computed based on the two-sided paired t test between the corresponding feature maps within each channel (n = 256 feature values) and adjusted for multiple comparisons. CRT, chemoradiotherapy; pCR, pathologic complete response; EMVI, extramural vascular invasion.
Fig. 5
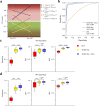
Fig. 5. Integration of imaging and blood-based biomarkers.
a Definition of five discrete categories of blood marker response based on the clearance patterns of CEA level before and after CRT. b ROC curves for three different models: combined imaging and CEA model, imaging alone, and CEA alone in the internal validation cohort. c Comparison of response prediction performance of different models at 95% specificity. d same as (c) except for 99% specificity. In the box plots, the central line represents the median, the bounds of box correspond to the first and third quartiles, and the whiskers are the minimum and maximum of the data. p values were computed based on the two-sided t test (n = 160 patients) between the prediction models as indicated in (c, d) and adjusted for multiple comparisons. CEA, carcinoembryonic antigen; PPV, positive predictive value; NPV, negative predictive value. ns, not significant, p ≥ 0.05; *0.01 ≤ p < 0.05; **0.001 ≤ p < 0.01; ***0.0001 ≤ p < 0.001; ****p < 0.0001.

References

    1. Eisenhauer EA, et al. New response evaluation criteria in solid tumours: revised RECIST guideline (version 1.1) Eur. J. Cancer. 2009;45:228–247. doi: 10.1016/j.ejca.2008.10.026. - DOI - PubMed
    1. O’Connor JP, et al. Imaging intratumor heterogeneity: role in therapy response, resistance, and clinical outcome. Clin. Cancer Res. 2015;21:249–257. doi: 10.1158/1078-0432.CCR-14-0990. - DOI - PMC - PubMed
    1. O’Connor JPB, et al. Imaging biomarker roadmap for cancer studies. Nat. Rev. Clin. Oncol. 2017;14:169–186. doi: 10.1038/nrclinonc.2016.162. - DOI - PMC - PubMed
    1. Lambin P, et al. Radiomics: the bridge between medical imaging and personalized medicine. Nat. Rev. Clin. Oncol. 2017;14:749. doi: 10.1038/nrclinonc.2017.141. - DOI - PubMed
    1. Topol EJ. High-performance medicine: the convergence of human and artificial intelligence. Nat. Med. 2019;25:44–56. doi: 10.1038/s41591-018-0300-7. - DOI - PubMed

Substances