. 2021 Mar 25;12(1):1889.
doi: 10.1038/s41467-021-22167-3.

Membrane type 1 matrix metalloproteinase promotes LDL receptor shedding and accelerates the development of atherosclerosis

Affiliations

Membrane type 1 matrix metalloproteinase promotes LDL receptor shedding and accelerates the development of atherosclerosis

Adekunle Alabi et al. Nat Commun. .

Abstract

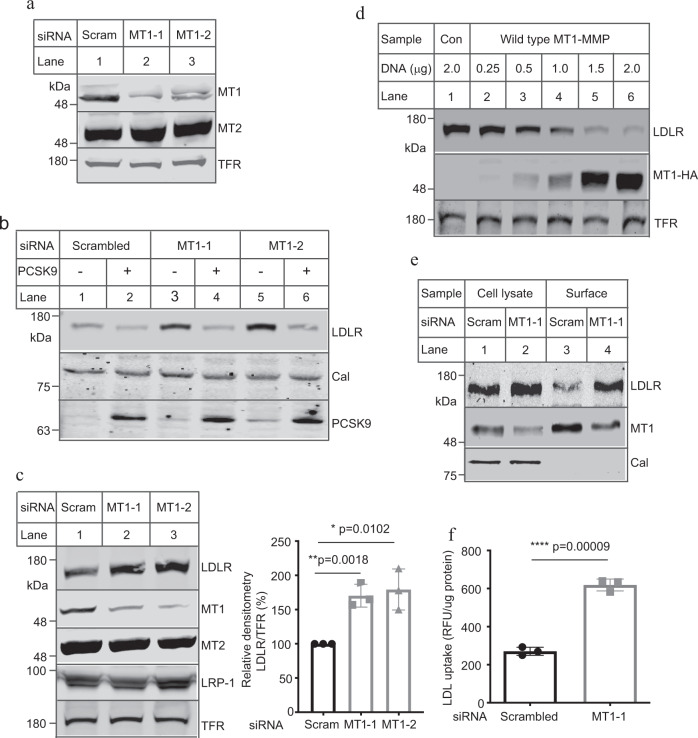
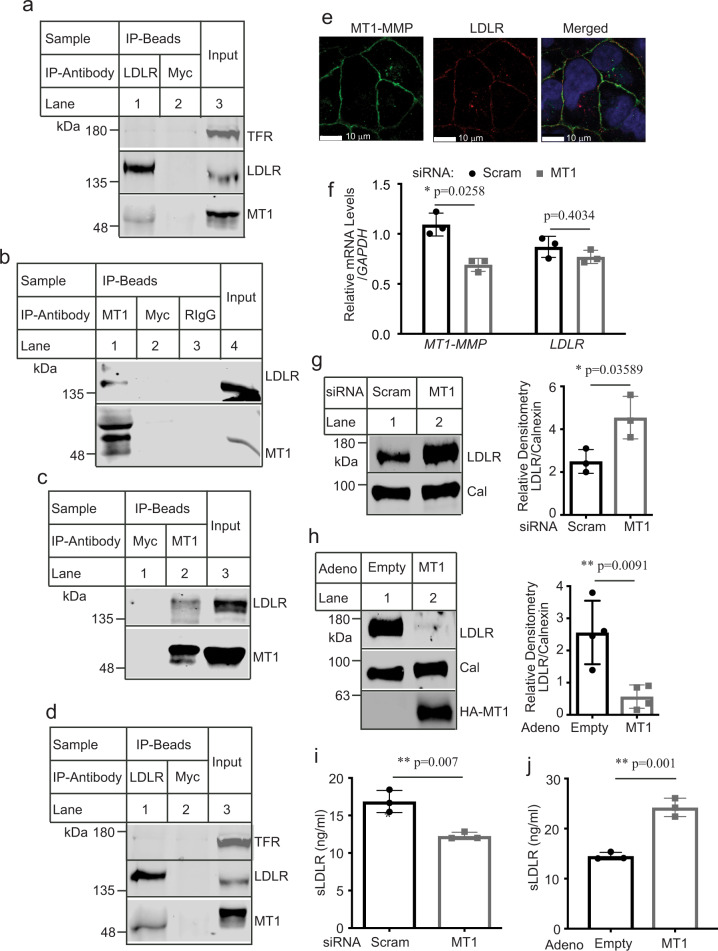
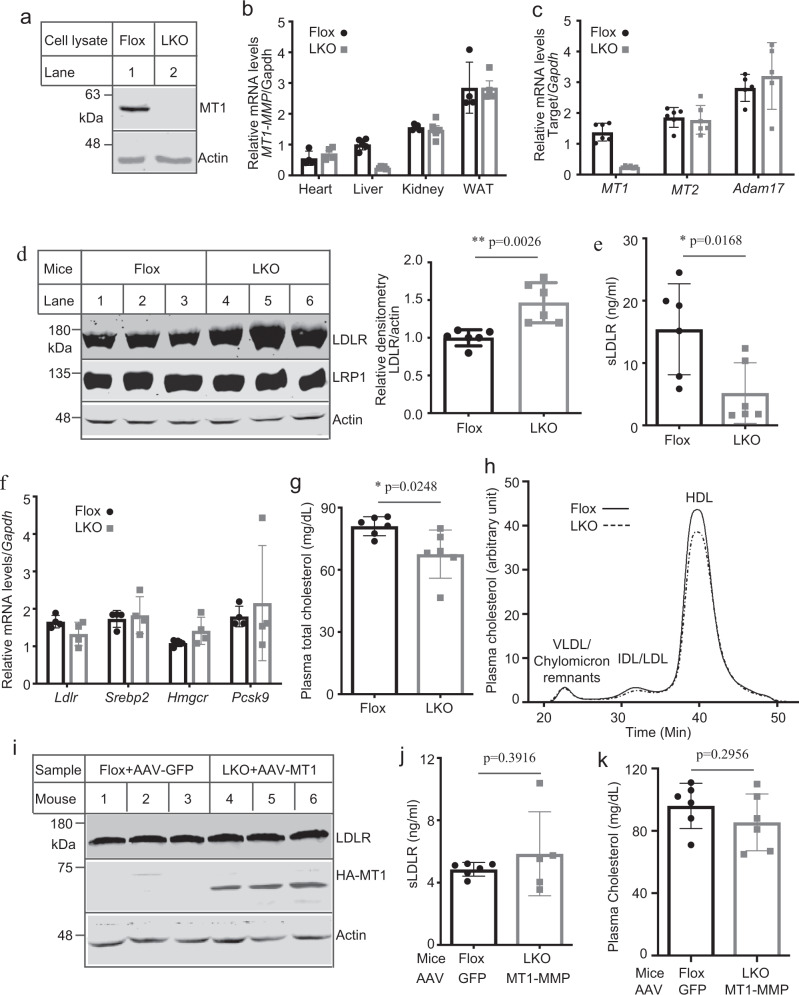
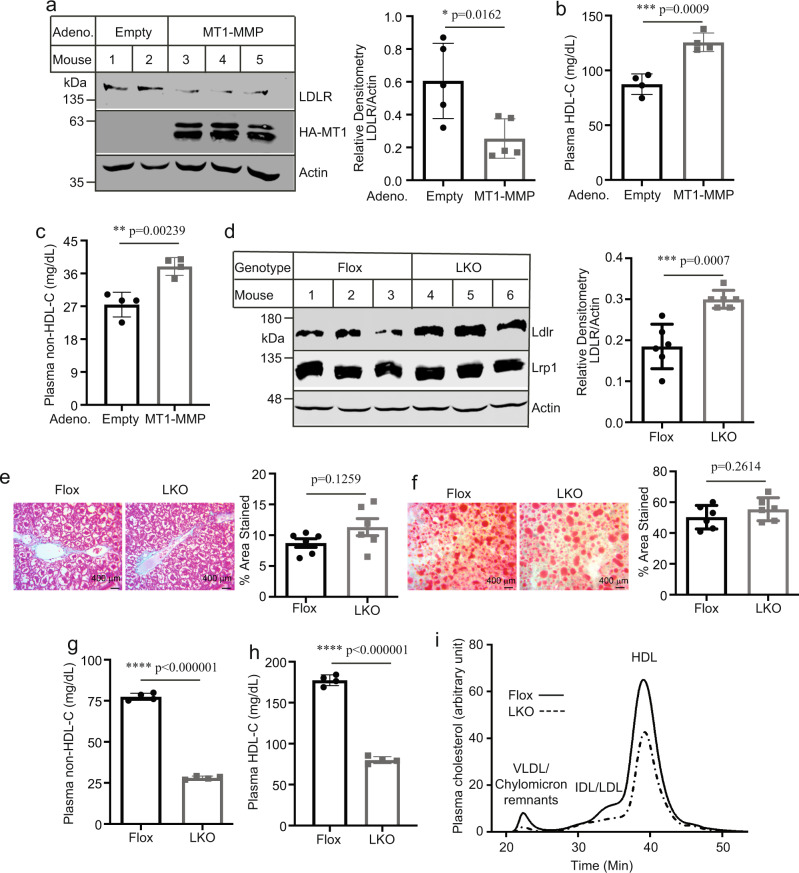
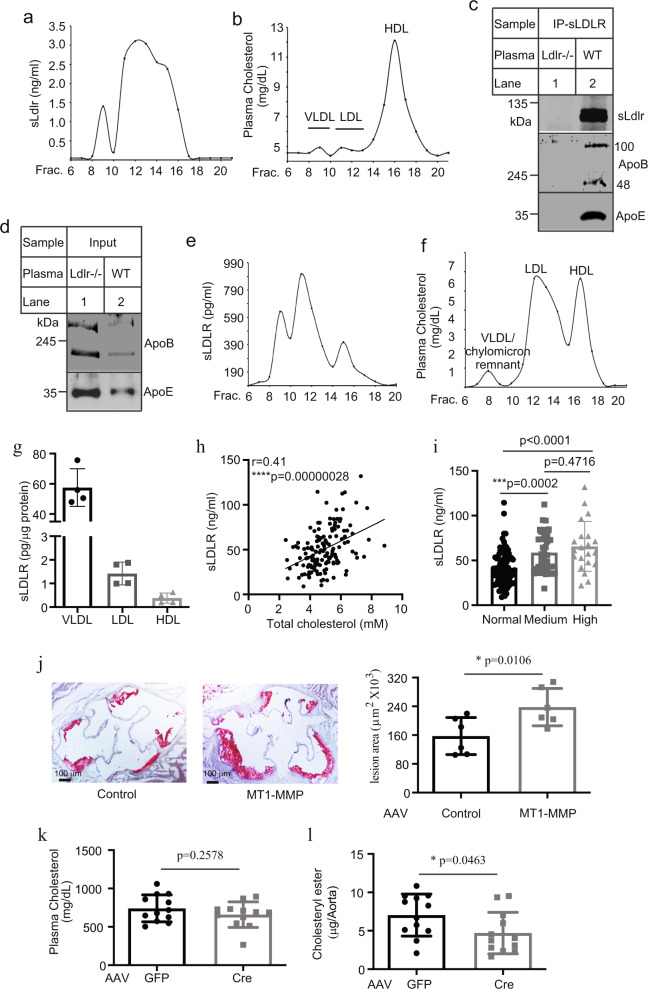
Plasma low-density lipoprotein (LDL) is primarily cleared by LDL receptor (LDLR). LDLR can be proteolytically cleaved to release its soluble ectodomain (sLDLR) into extracellular milieu. However, the proteinase responsible for LDLR cleavage is unknown. Here we report that membrane type 1-matrix metalloproteinase (MT1-MMP) co-immunoprecipitates and co-localizes with LDLR and promotes LDLR cleavage. Plasma sLDLR and cholesterol levels are reduced while hepatic LDLR is increased in mice lacking hepatic MT1-MMP. Opposite effects are observed when MT1-MMP is overexpressed. MT1-MMP overexpression significantly increases atherosclerotic lesions, while MT1-MMP knockdown significantly reduces cholesteryl ester accumulation in the aortas of apolipoprotein E (apoE) knockout mice. Furthermore, sLDLR is associated with apoB and apoE-containing lipoproteins in mouse and human plasma. Plasma levels of sLDLR are significantly increased in subjects with high plasma LDL cholesterol levels. Thus, we demonstrate that MT1-MMP promotes ectodomain shedding of hepatic LDLR, thereby regulating plasma cholesterol levels and the development of atherosclerosis.


Conflict of interest statement

The authors declare no competing interests.

Figures

Fig. 1
Fig. 1. MT1-MMP-mediated LDLR degradation.
a Knockdown of MT1-MMP expression. Whole-cell lysate from Huh7.5 cells transfected with scrambled (Scram) or one of the two different MT1-MMP siRNAs (MT1-1, MT1-2) was applied to immunoblotting. TFR, transferrin receptor. b Effect of MT1-MMP knockdown on PCSK9-promoted LDLR degradation. Huh7.5 cells transfected with scrambled or MT1-MMP siRNA were incubated with or without PCSK9 (2 μg/ml). Whole-cell lysate was applied to western blot with antibodies indicated. c Effect of MT1-MMP knockdown in HepG2 cells. The cells were transfected with scrambled (Scram) or MT1-MMP siRNAs (MT1-1, MT1-2) for 48 h. Same amount of whole-cell lysate was applied to immunoblotting. The images showed representative protein levels. Similar results were obtained from three independent experiments. The relative densitometry was the ratio of the densitometry of LDLR to that of transferrin receptor (TFR) at the same condition (n = 3 independent experiments). The percentage of relative densitometry was the ratio of the relative densitometry of LDLR at different treatments to that of LDLR at the control condition, which was defined as 100%. d Effect of MT1-MMP overexpression on LDLR. Whole-cell lysate was isolated from Huh7.5 cells transfected with empty plasmid (Con) or different amount of plasmid carrying MT1-MMP cDNA, and then subjected to immunoblotting. e Biotinylation of cell surface proteins. Huh7.5 cells transfected with scrambled (Scram) or MT1-MMP siRNA (MT1-1) were biotinylated. Same amount of total proteins in whole-cell lysate was applied to NeutrAvidin beads to pull down cell surface proteins, followed by immunoblotting. Cal, calnexin. f LDL uptake (n = 3 independent experiments). Huh7.5 cells transfected with scrambled or MT1-MMP siRNA (MT1-1) were labeled with Dil-LDL in the absence and presence of unlabeled LDL. Fluorescence intensity (RFU) was measured to calculate specific binding. Similar results were obtained from at least three independent experiments. Student’s t test (two-sided) was carried out to determine the significant differences between groups (c and f). The significance was defined as p < 0.05. Values of all data were mean ± SD. Source data are provided as a Source Data file.
Fig. 2
Fig. 2. MT1-MMP-mediated LDLR cleavage.
a Inhibitors treatment. Huh7.5 cells transfected with empty pCDNA3.1 or HA-tagged MT1-MMP-pCDNA3.1were incubated with MG132 (MG) or chloroquine (Chloro). Whole-cell lysate was subjected to immunoblotting. HA-tagged MT1-MMP was detected by an anti-HA antibody. b MT1-MMP knockdown. qRT-PCR of Huh7.5 cells transfected with scrambled or MT1-MMP siRNAs. The relative mRNA levels were the ratio of the mRNA levels of the target genes to that of GAPDH at the same condition. The fold-change of the relative mRNA levels of target gene expression in MT1-MMP siRNA treated groups was determined in comparison with that in the control group that was defined as 1. c MT1-MMP overexpression. Cells as indicated were infected with either empty (Emp), the wild-type (WT), or mutant E240A (E240A) MT1-MMP adenoviruses. Whole-cell lysate was subjected to immunoblotting. d LDLR cleavage (n = 3 independent experiments). Huh7.5 cells transfected with scrambled (Scram) or MT1-MMP siRNA (MT1-1) were cultured in DMEM only medium for 16 h. Whole-cell lysate (bottom) and concentrated media (top) were subjected to immunoblotting. MT1: MT1-MMP; Alb, albumin; TFR, transferrin receptor. e Ectodomain cleavage (n = 3 independent experiments). HEK293 cells were transfected with plasmid indicated. After 36 h, culture medium was changed to DMEM containing 0.5% FBS for overnight. Whole-cell lysate (bottom) and culture medium (top) were subjected to immunoblotting. The bottom figures in panels d and e showed representative protein levels. The relative densitometry was the ratio of the densitometry of sLDLR to that of albumin in culture medium in the same sample. Soluble LDLR. Culture medium was collected from Huh7.5 cells (f) (n = 4 independent experiments) or HEK293 cells (g) (n = 3 independent experiments) and subjected to measurement of sLDLR using ELISA. Similar results were obtained from at least three independent experiments. Student’s t test (two-sided) was carried out to determine the significant differences between groups (dg). The significance was defined as p < 0.05. Values of all data were mean ± SD. Source data are provided as a Source Data file.
Fig. 3
Fig. 3. Effects of MT1-MMP on LDLR.
Immunoprecipitation of LDLR (a and d) and MT1-MMP (b and c). Whole-cell lysate from HepG2 (a and b) or Huh7.5 cells (c and d) was subjected to immunoprecipitation using protein G beads and a mouse anti-LDLR (LDLR) or anti-Myc (Myc) antibody (a and d), or protein G beads and a mouse anti-MT1-MMP antibody, a mouse anti-Myc (Myc) antibody or rabbit IgG (RIgG) (b and c). The immunoprecipitated proteins (IP-Beads) and whole-cell lysate (Input) were subjected to immunoblotting. Representative images were shown. Similar results were obtained from three independent experiments. e Confocal microscopy. Huh7.5 cells were fixed, permeabilized, and then incubated with a mouse anti-LDLR monoclonal and a rabbit anti-MT1-MMP monoclonal antibody. MT1-MMP: green; LDLR: red, DAPI: blue. An x-y optical section of the cells illustrates the cellular distribution of proteins (magnification: 100×). f, g MT1-MMP knockdown (n = 3 independent experiments). Primary human hepatocytes were transfected with scrambled (Scram) or MT1-MMP siRNA (MT1). The relative mRNA levels were the ratio of the mRNA levels of the target genes to that of GAPDH at the same condition (f). Same amount of total proteins in whole-cell lysate was subjected to immunoblotting. Cal: calnexin. Relative densitometry was the ratio of the densitometry of LDLR to that of calnexin at the same condition. h Overexpression of MT1-MMP (n = 4 independent experiments). Whole-cell lysate was prepared from primary human hepatocytes infected with empty or the wild-type MT1-MMP (MT1)-adenovirus and then applied to immunoblotting. sLDLR. Medium was collected from primary human hepatocytes treated with siRNA (i) or adenovirus (j) to measure sLDLR with ELISA. Similar results were obtained from at least three independent experiments. Student’s t test (two-sided) was carried out to determine the significant differences between groups (f–j). The significance was defined as p < 0.05. Values of all data were mean ± SD. Source data are provided as a Source Data file.
Fig. 4
Fig. 4. Metabolic effects of MT1LKO mice.
a MT1-MMP deletion. Whole-cell lysate of primary mouse hepatocytes isolated from MT1Flox and MT1LKO mice was subjected to immunoblotting. Similar results were obtained from three independent experiments. b, c Relative expression of target genes. qRT-PCR measurement of mRNA levels of MT1-MMP in different tissues (b) (four or five mice per group) or MT1-MMP, MT2-MMP, and Adam17 in the liver (five or six mice per group) (c). The relative mRNA levels were the ratio of the mRNA levels of the target genes from different tissues to that of Gapdh in the same tissue. WAT, white adipose tissue. d Liver LDLR levels (6 mice per group). Liver homogenate was subjected to immunoblotting. Relative densitometry was the ratio of the densitometry of LDLR of different mice to that of actin of the same mouse. Representative images were shown. Similar results were obtained from the other three mice. e Plasma sLDLR determined by ELISA (6 mice per group). f Relative mRNA levels (4 mice per group). g Plasma levels of total cholesterol (6 mice per group). h Lipid profile. Same amount of plasma from each mouse in the same group was pooled and applied to FPLC analysis of plasma cholesterol (6 mice per group). ik Expression of human MT1-MMP. MT1Flox and MT1LKO mice were injected with AAVs encoding GFP or human MT1-MMP, respectively. Liver homogenate was applied to immunoblotting (6 mice per group). Representative images were shown. Similar results were obtained from the other three mice (i). Plasma samples were used to measure sLDLR levels (6 mice in the control group and 5 mice in MT1-MMP overexpression group) (j), and total cholesterol levels (6 mice per group) (k). Student’s t test (two-sided) was carried out to determine the significant differences between groups (bg, j and k). The significance was defined as p < 0.05. Values of all data were mean ± SD. Source data are provided as a Source Data file.
Fig. 5
Fig. 5. The impact of MT1-MMP.
a Overexpression of human MT1-MMP. Male C57BL/6J mice were injected with empty or the wild-type MT1-MMP adenoviruses (5 mice per group). Liver homogenate was subject to immunoblotting, followed by quantification of LDLR levels relative to actin in the same mouse. Representative images were shown. Similar results were obtained from other mice. Plasma levels of HDL (b) and non-HDL cholesterol (c) (4 mice per group). d Effect of the Western-type diet (6 mice per group). Mice were fed the Western-type diet for 8 weeks. Liver homogenate was subjected to immunoblotting. Relative densitometry of LDLR was determined as described. Actin was used as a loading control. Representative images were shown. Similar results were obtained from the other mice. Liver section staining. Representative figures and quantification (ImageJ 1.52S) of Masson’s Trichrome (e) and oil Red-O staining (f) in cross-sections of the liver (6 mice per group). Similar results were obtained from the other mice (magnification: 400×). Plasma levels of cholesterol content in HDL (g) and non-HDL (h) (4 mice per group). i Lipid profile. Same amount of plasma from each mouse in the same group (2 female and 2 male mice per group) was pooled and applied to FPLC analysis of plasma cholesterol. Student’s t test (two-sided) was carried out to determine the significant differences between groups (ah). The significance was defined as p < 0.05. Values of all data were mean ± SD. Source data are provided as a Source Data file.
Fig. 6
Fig. 6. Analysis of plasma sLDLR.
Profiles of plasma sLDLR (a) and lipoprotein cholesterol (b). Fasting mouse plasma was pooled from three mice and then applied to FPLC. Each sample was assayed in triplicate. Immunoprecipitation (c) and immunoblotting (d). Plasma pooled from three Ldlr−/− or the wild-type mice was applied to a rat anti-mouse LDLR antibody and protein-G beads. The immunoprecipitated proteins (c) and 3 μl of pooled plasma (d) were subjected to immunoblotting. Representative images were shown. Similar results were obtained from three independent experiments. Profiles of human plasma sLDLR (e) and lipoprotein cholesterol (f). The experiment was performed as described in panel 6a and b except that fasting human plasma was used. Each sample was assayed in triplicate. g sLDLR in lipoproteins. sLDLR in purified human VLDL, LDL and HDL was measured and normalized to protein concentrations. Each sample was assayed four times. h, i Plasma levels of sLDLR and total cholesterol. sLDLR and total cholesterol in fasting human plasma samples were measured using kits. The association (h) was analyzed using with the Pearson’s correlation coefficient and statistical significance among different groups (i) was analyzed with one-way Anova and Tukey post-hoc test using GraphPad Prism 9 (i n = 87 individuals in the normal group, 40 in the Medium group, and 21 in the high group). j Analysis of atherosclerosis. 8–10 week-old male apoE−/− mice were injected with AAV-Empty (Control) or AAV-MT1-MMP (MT1-MMP) and then fed the Western diet (6 mice per group). Atherosclerotic lesions were quantified using OMAX ToupView. Representative images were shown (Magnification 40×). Similar results were obtained from other mice. k, l MT1-MMP knockdown. 8–10-week-old male MT1Flox/ApoE−/− mice were injected with AAV-GFP (GFP) or AAV-TBG-Cre (Cre) and then fed the Western diet (13 and 11 mice in the GFP and Cre group, respectively). Plasma cholesterol (k) and aortic cholesteryl ester (l) were measured. Student’s t test (two-sided) was carried out to determine the significant differences between groups (jl). The significance was defined as p < 0.05. Values of all data were mean ± SD. Source data are provided as a Source Data file.

Similar articles

Cited by

References

    1. Goldstein JL, Brown MS. A century of cholesterol and coronaries: from plaques to genes to statins. Cell. 2015;161:161–172. doi: 10.1016/j.cell.2015.01.036. - DOI - PMC - PubMed
    1. Rudenko G, et al. Structure of the LDL receptor extracellular domain at endosomal pH. Science. 2002;298:2353–2358. doi: 10.1126/science.1078124. - DOI - PubMed
    1. Lagace TA. PCSK9 and LDLR degradation: regulatory mechanisms in circulation and in cells. Curr. Opin. Lipido. 2014;25:387–393. doi: 10.1097/MOL.0000000000000114. - DOI - PMC - PubMed
    1. Seidah NG, Awan Z, Chretien M, Mbikay M. PCSK9: a key modulator of cardiovascular health. Circ. Res. 2014;114:1022–1036. doi: 10.1161/CIRCRESAHA.114.301621. - DOI - PubMed
    1. Rashid S, et al. Decreased plasma cholesterol and hypersensitivity to statins in mice lacking Pcsk9. Proc. Natl Acad. Sci. USA. 2005;102:5374–5379. doi: 10.1073/pnas.0501652102. - DOI - PMC - PubMed

Publication types

MeSH terms

Grants and funding