. 2021 Mar 25;12(1):1869.
doi: 10.1038/s41467-021-22076-5.

Structure-based design of a Cortistatin analogue with immunomodulatory activity in models of inflammatory bowel disease

Affiliations

Structure-based design of a Cortistatin analogue with immunomodulatory activity in models of inflammatory bowel disease

Álvaro Rol et al. Nat Commun. .

Abstract

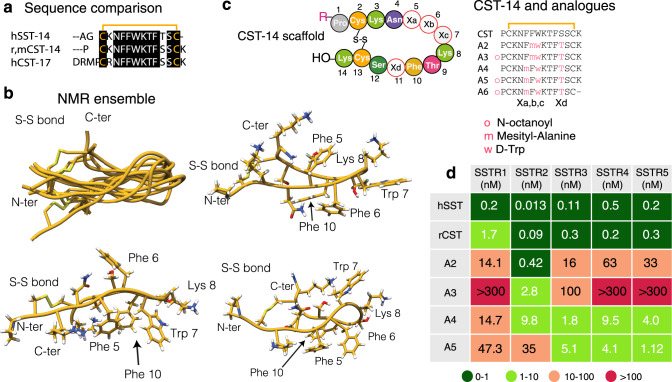
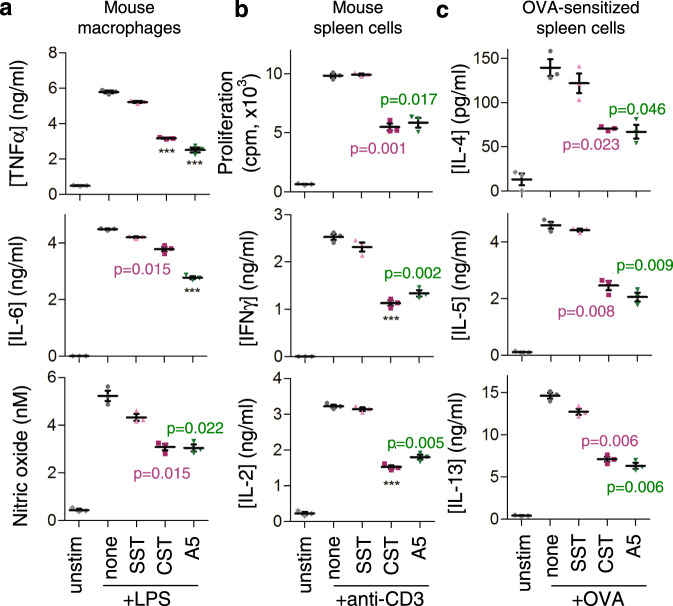
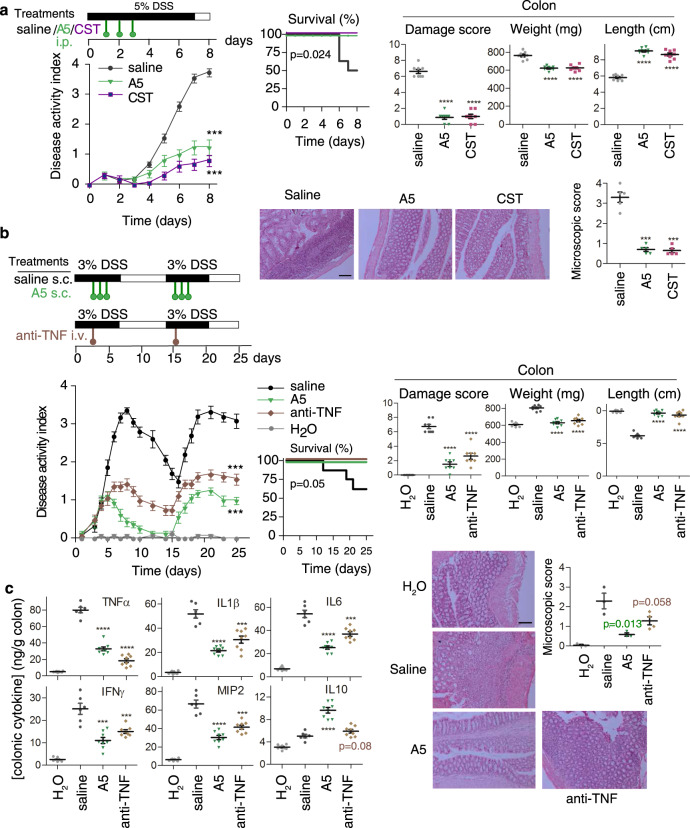
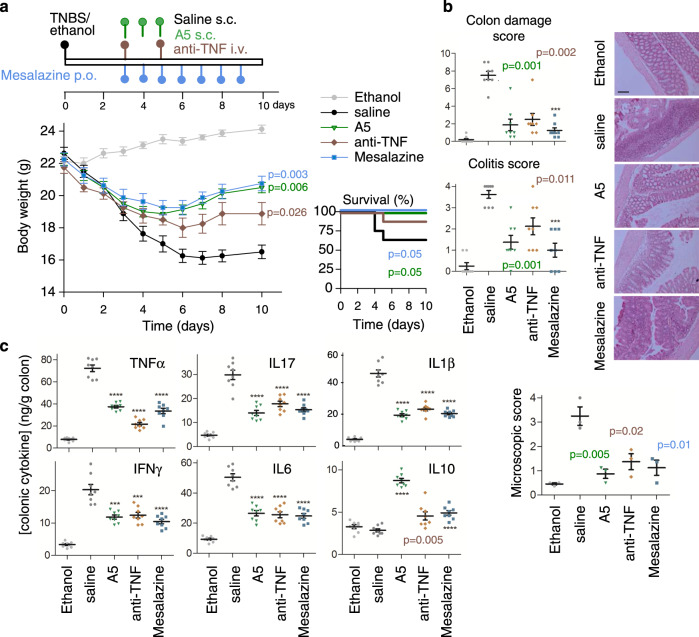
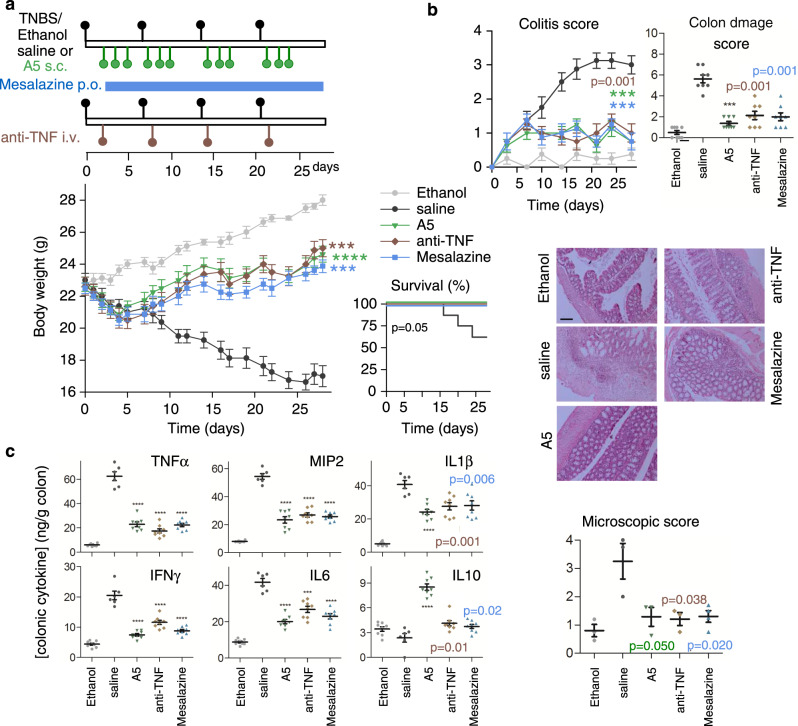
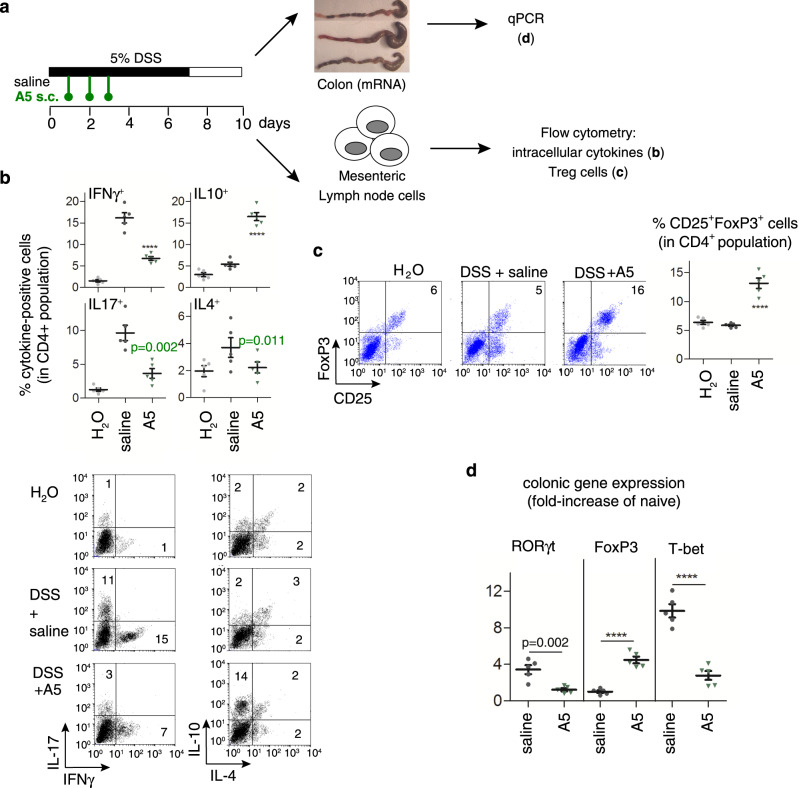
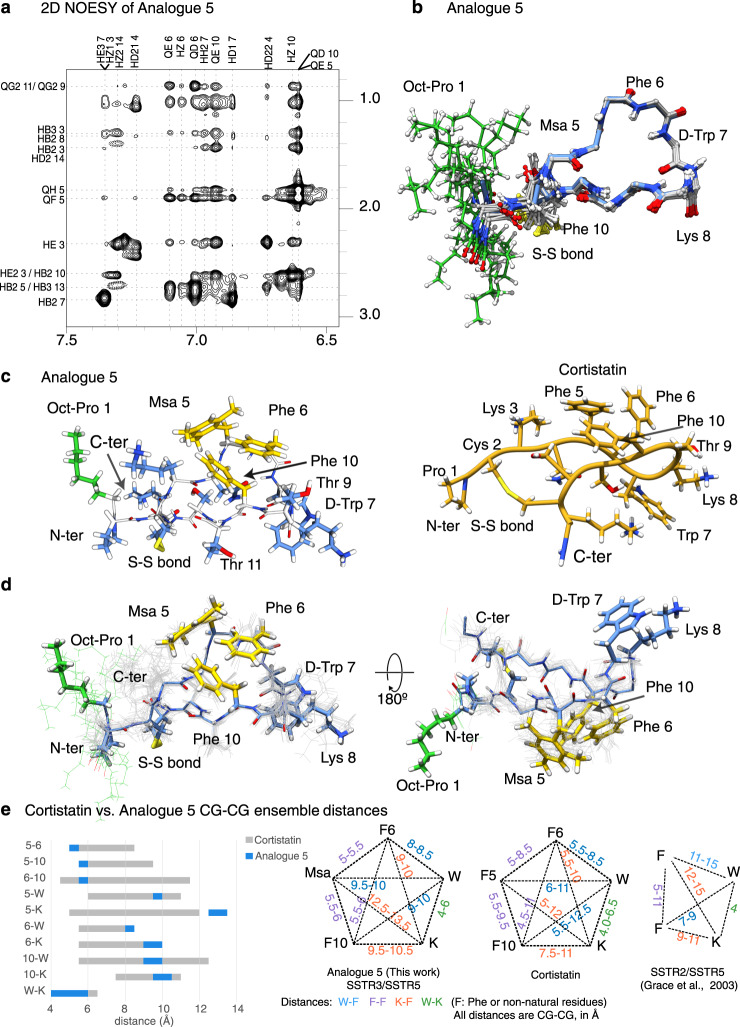
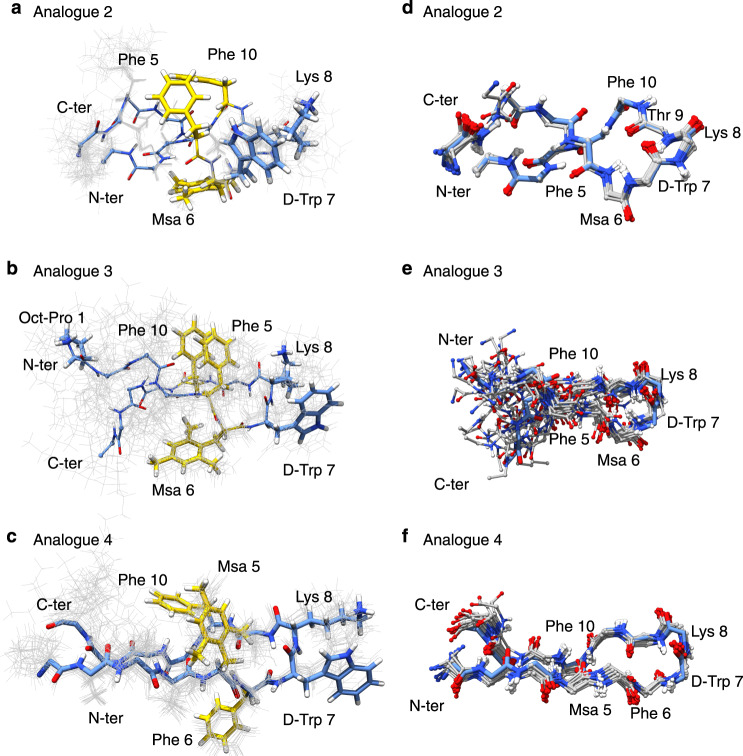
Ulcerative colitis and Crohn's disease are forms of inflammatory bowel disease whose incidence and prevalence are increasing worldwide. These diseases lead to chronic inflammation of the gastrointestinal tract as a result of an abnormal response of the immune system. Recent studies positioned Cortistatin, which shows low stability in plasma, as a candidate for IBD treatment. Here, using NMR structural information, we design five Cortistatin analogues adopting selected native Cortistatin conformations in solution. One of them, A5, preserves the anti-inflammatory and immunomodulatory activities of Cortistatin in vitro and in mouse models of the disease. Additionally, A5 displays an increased half-life in serum and a unique receptor binding profile, thereby overcoming the limitations of the native Cortistatin as a therapeutic agent. This study provides an efficient approach to the rational design of Cortistatin analogues and opens up new possibilities for the treatment of patients that fail to respond to other therapies.


Conflict of interest statement

Analogue 5 is patented, EP 3046933 B1 (BCN PEPTIDES, S.A.) 2019-02-27, “Cortistatin analogues for the treatment of inflammatory and/or immune diseases”. All authors declare no other competing interests.

Figures

Fig. 1
Fig. 1. Cortistatin and Somatostatin sequence comparison, analogue design and NMR conformers.
a Sequence comparison of human Somatostatin (SST) to rat, mouse and human Cortistatins (CST). b Backbone superposition of the 10-lowest energy conformers. The peptide backbone is shown in gold and the N- and C-terminus residues, as well as the disulfide bond are labelled. Representative aromatic clusters. All side chains are shown to facilitate structural analysis. Side chains participating in the interactions are specifically labelled. c Schematic representation of Cortistatin-14 sequence. Positions Xa, Xb, Xc and Xd have been mutated to prepare the analogues. Native CST was also synthesised for the NMR and functional studies. Sequences of the analogues prepared in this work. Substitutions are coloured. Synthetic scheme is displayed as Supplementary Fig. 1a. d Schematic representations of the relative affinities of SST, CST and analogues A2-A5 for the different Somatostatin receptors (SSTR1-SSTR5) Supplementary Fig. 1b. The relative affinities are represented based on the determined IC50 values. The values are collected as Supplementary Table 1.
Fig. 2
Fig. 2. Cortistatin analogue 5 regulates macrophage and lymphocyte activation.
Effects of Somatostatin (SST), Cortistatin (CST) and analogue 5 (A5) on the production of inflammatory cytokines and nitric oxide by LPS-activated mouse Raw 264 macrophages (a), on cell proliferation and production of Th1-type cytokines by anti-CD3-activated mouse spleen cells (b) and on the production of Th2-type cytokines by OVA-activated spleen cells isolated from mice immunised with OVA (c). Peptides were used at 100 nM and the dose-response curve for analogue 5 and cortistatin are shown in Supplementary Fig. 2a, b. Cells cultured in medium alone were used as unstimulated controls. Data are the mean ± SEM with dots representing individual values of biologically independent cell cultures, each performed in duplicate. Statistical significance between groups was assessed by paired, two-tailed Student’s t test. ***p < 0.001, ****p < 0.0001 vs. stimulated cells in the absence of peptides. Exact p-values are shown for p > 0.001. Source data are provided as a Source Data file.
Fig. 3
Fig. 3. Therapeutic effect of analogue 5 on DSS-induced ulcerative colitis.
a Protective effects against acute severe colitis induced by oral DSS by the treatment with Cortistatin (CST) and analogue 5 (A5) (as indicated in the scheme) evaluated by disease activity indexes (scoring body weight loss, stool consistency and presence of faecal blood), survival rate, macroscopic signs of colon inflammation (damage score, length and weight of colon) and histopathological scores. b Comparative therapeutic effects of treatments with A5 and anti-mouse TNFα antibody in a model of relapsing-remitting colitis induced by cyclic administration of DSS (see scheme for experimental design). c Effects of A5 and anti-TNFα treatments on levels of cytokines in colonic mucosa of mice with DSS-induced relapsing-remitting colitis. Mice receiving tap water instead of DSS were used as naive controls. Animals injected with saline instead of A5 were used as untreated colitic mice. n = 8 mice/group for all assays, unless for histological analysis (n = 5 mice/group in panel a, and n = 3 mice/group in panel b, where representative images are shown at ×100 magnification, scale bar: 200 µm). Data are mean ± SEM with dots representing individual values of biologically independent animals. Statistical differences between groups were calculated using two-tailed non-parametric Mann–Whitney test (for disease activity index, colon damage and microscopic scores), unpaired two-tailed Student’s t test (for colon length and weight) and Kaplan–Meier test (for survival). ***p < 0.001; ****p < 0.0001 versus untreated DSS-colitic mice (saline). Exact p-values are shown for p > 0.001. Source data are provided as a Source Data file. i.p. intraperitoneal, s.c. subcutaneous, i.v. intravenous.
Fig. 4
Fig. 4. Comparative therapeutic effects of analogue 5 with treatments of reference on TNBS-induced acute colitis.
Acute colitis was induced in mice by intrarectal TNBS and the animals were then treated with analogue 5 (A5) or with treatments of reference (anti-TNFα antibody and Mesalazine) following the therapeutic regime indicated in the scheme (a). Mice injected intrarectally with 50% ethanol were used as basal controls. Animals injected with saline instead of A5 were used as untreated colitic mice. Disease evolution and severity were monitored by survival and weight loss, colitis score, macroscopic colon damage score and histopathological signs (b) and by measuring the cytokine levels in colonic mucosa (c). n = 8 mice/group in all assays, unless for histopathological analysis (n = 3 mice/group, where representative images are shown at ×100 magnification, scale bar: 200 µm). Data are mean ± SEM with dots representing individual values of biologically independent animals. Statistical differences between groups were calculated using two-tailed non-parametric Mann–Whitney test (for colon damage, colitis and microscopic scores), unpaired two-tailed Student’s t test (for body weight and colonic cytokines) and Kaplan–Meier test (for survival). ***p < 0.001; ****p < 0.0001 versus untreated TNBS-colitic mice (saline). Exact p-values are shown for p > 0.001. Source data are provided as a Source Data file. s.c. subcutaneous, i.v. intravenous, p.o. oral.
Fig. 5
Fig. 5. Therapeutic effects of analogue 5 on TNBS-induced chronic colitis.
Chronic colitis was induced in mice by intrarectal injections of increasing doses of TNBS once a week and animals were then repetitively treated with analogue 5 (A5), anti-mouse TNFα antibody or mesalazine as indicated in the scheme (a). Mice injected with 50% ethanol were used as basal controls. Animals injected with saline instead of A5 were used as untreated colitic mice. Disease evolution and severity were monitored by survival and weight loss, colitis score, macroscopic colon damage score and histopathological signs (b) and by measuring the cytokine concentration levels in colonic mucosa (c). n = 8 mice/group in all assays, unless for histopathological analysis (n = 3–4 mice/group, where representative images are shown at ×100 magnification, scale bar: 200 µm). Data are mean ± SEM with dots representing individual values of biologically independent animals. Statistical differences between groups were calculated using two-tailed non-parametric Mann–Whitney test (for colon damage, colitis and microscopic scores), unpaired two-tailed Student’s t test (for body weight, colon length and weight, and colonic cytokines) and Kaplan–Meier test (for survival). ***p < 0.001; ****p < 0.0001 versus untreated TNBS-colitic mice (saline). Exact p-values are shown for p > 0.001. Source data are provided as a Source Data file. s.c. subcutaneous, i.v. intravenous, p.o. oral.
Fig. 6
Fig. 6. Treatment with analogue 5 reduces Th1 and Th17 cells and induces regulatory T cells in mice with ulcerative colitis.
Mice with DSS-induced acute colitis were treated with saline (untreated) or analogue 5 (A5) as indicated in the scheme (a). The percentages of cytokine-positive cells (b) and CD25+FoxP3+ Treg cells (c) in gated CD4+ population in mesenteric lymph node cells were analysed by flow cytometry (numbers in dot-plots represents percentages in each quadrant), and gene expression of T-bet, RORγt and FoxP3 in colon was determined by real-time qPCR (d). Mice receiving tap water instead of DSS were used as naive controls. n = 5 mice/group. Data are mean ± SEM with dots representing individual values of biologically independent animals. Statistical differences between groups were calculated using unpaired two-tailed Student’s t test. ****p < 0.0001 versus untreated DSS-induced colitic mice (saline). Exact p-values are shown for p > 0.001. Source data are provided as a Source Data file. FACS sequential gating/sorting strategies used for these experiments are shown as Supplementary Fig. 6f, g.
Fig. 7
Fig. 7. NMR conformers of analogue 5.
NMR restraints and ensemble of conformers corresponding to A5. a Side-chain amide region of the analogue 5 (1H-NOESY experiment), with peak assignments. Amide/proton alpha (left) and amide/aromatic (right) regions of the analogue 5 (1H-NOESY experiment), with peak assignments are shown as Supplementary Fig. 7a. 1D set of dilution experiments are included as Supplementary Fig. 7b. b Backbone superposition of the 15 lowest-energy calculated conformers. c Analogue 5, lowest energy conformer. Side chains are depicted as sticks. The residues defining the aromatic cluster are shown in yellow, the octanoyl moiety is highlighted in green whereas the remaining residues are shown in blue. The peptide backbone is shown in white. On the right, the equivalent Cortistatin conformer for comparison (shown in Fig. 1b). d Side chain and backbone distribution for the ensemble of the 15 best conformers shown as two orientations. Some residues are labelled. e Comparison of the pharmacophore region of analogue 5 to that of Cortistatin conformations represented in Fig. 1b. The comparison includes the distances between C-gamma atoms of the five residues considered to define the pharmacophore. The backbone and Chi1 comparison of these six molecules are provided as Supplementary Fig. 7c. Distances are represented as ranges to include the distance dispersion in the ensemble of conformations.
Fig. 8
Fig. 8. NMR conformers corresponding to analogues 2, 3 and 4.
a Analogue 2, side chain and backbone distribution for the ensemble of the 15 best conformers. Side chains are depicted and labelled. The lowest energy conformer is highlighted as sticks. b, c as a, for analogues 3 and 4. d Backbone superposition of the 15 best calculated conformers for analogue 2. e, f as d, for analogues 3 and 4.

References

    1. Sartor RB. Mechanisms of disease: pathogenesis of Crohn’s disease and ulcerative colitis. Nat. Clin. Pract. Gastroenterol. Hepatol. 2006;3:390–407. doi: 10.1038/ncpgasthep0528. - DOI - PubMed
    1. Targan SR, et al. A short-term study of chimeric monoclonal antibody cA2 to tumor necrosis factor alpha for Crohn’s disease. Crohn’s Disease cA2 Study Group. N. Engl. J. Med. 1997;337:1029–1035. doi: 10.1056/NEJM199710093371502. - DOI - PubMed
    1. Adegbola SO, Sahnan K, Warusavitarne J, Hart A, Tozer P. Anti-TNF therapy in Crohn’s disease. Int. J. Mol. Sci. 2018;19:1–21. doi: 10.3390/ijms19082244. - DOI - PMC - PubMed
    1. Podolsky DK. Inflammatory bowel disease. N. Engl. J. Med. 2002;347:417–429. doi: 10.1056/NEJMra020831. - DOI - PubMed
    1. Bernstein CN. Treatment of IBD: where we are and where we are going. Am. J. Gastroenterol. 2015;110:114–126. doi: 10.1038/ajg.2014.357. - DOI - PubMed

Publication types

MeSH terms