. 2021 Mar 25;12(1):1876.
doi: 10.1038/s41467-021-22166-4.

SARS-CoV-2 infection rewires host cell metabolism and is potentially susceptible to mTORC1 inhibition

Affiliations

SARS-CoV-2 infection rewires host cell metabolism and is potentially susceptible to mTORC1 inhibition

Peter J Mullen et al. Nat Commun. .

Abstract

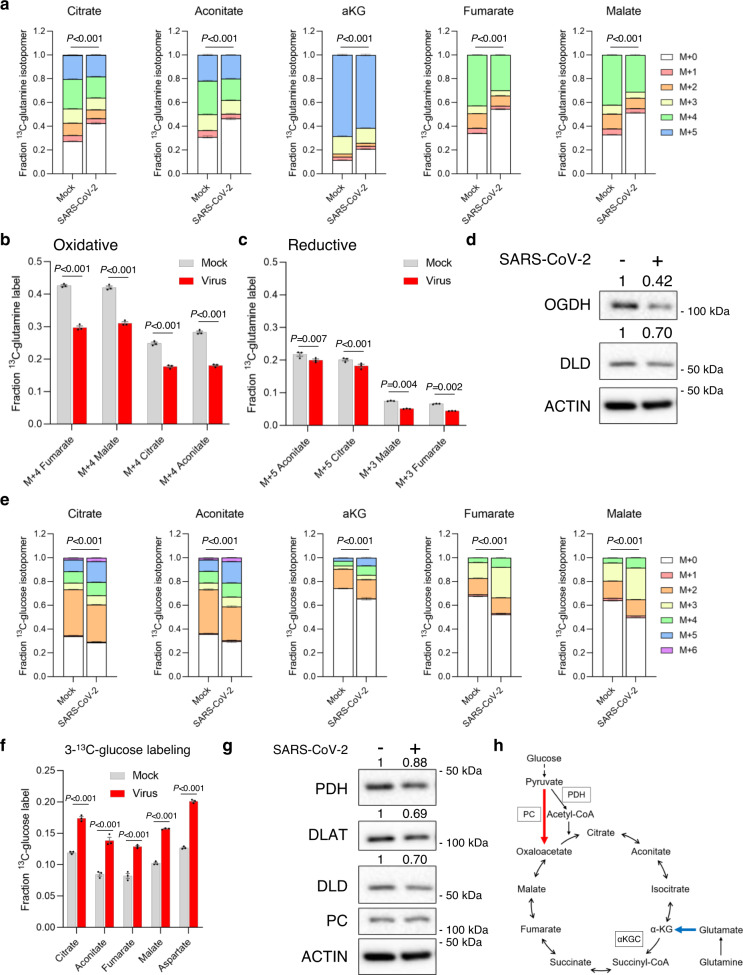
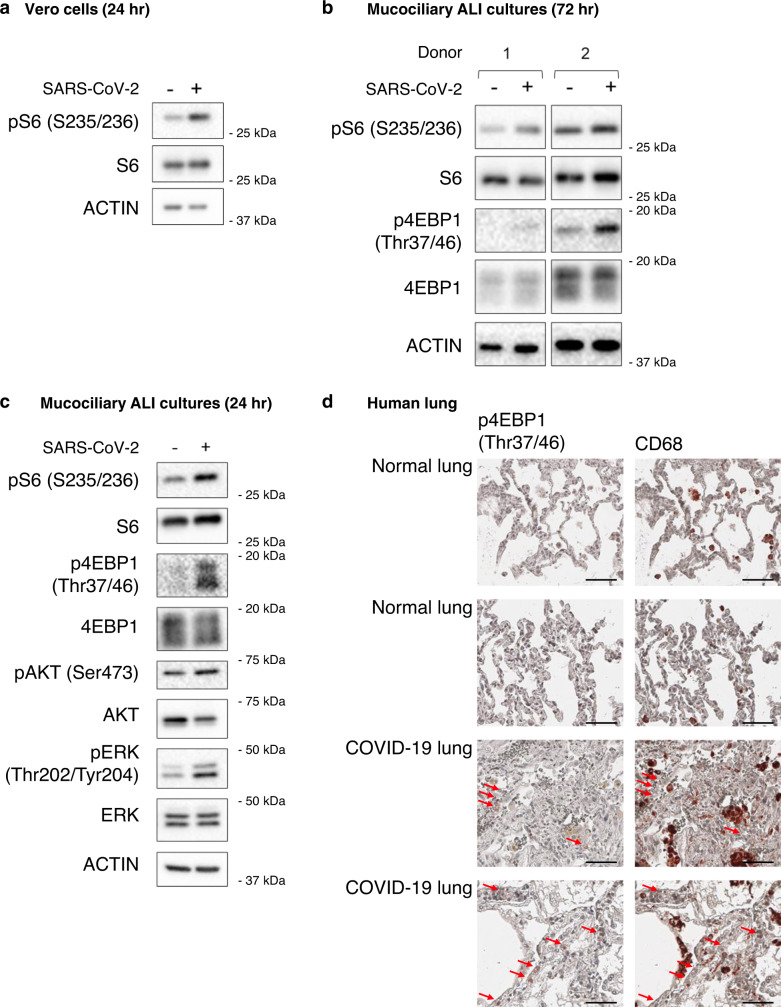
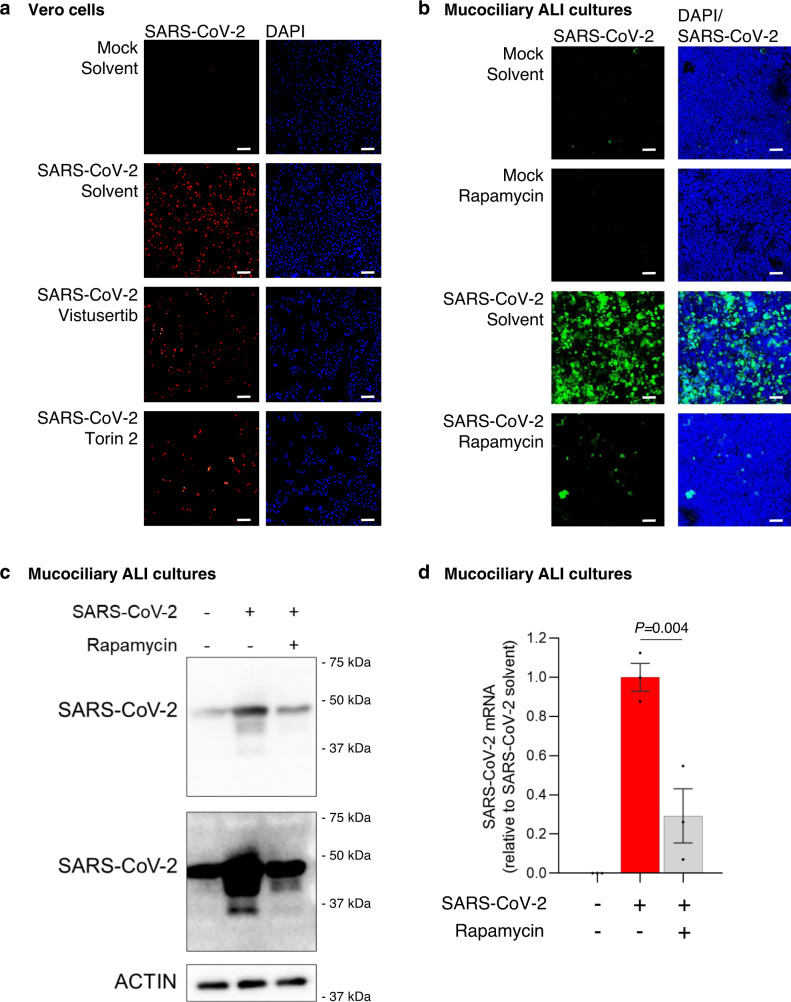
Viruses hijack host cell metabolism to acquire the building blocks required for replication. Understanding how SARS-CoV-2 alters host cell metabolism may lead to potential treatments for COVID-19. Here we profile metabolic changes conferred by SARS-CoV-2 infection in kidney epithelial cells and lung air-liquid interface (ALI) cultures, and show that SARS-CoV-2 infection increases glucose carbon entry into the TCA cycle via increased pyruvate carboxylase expression. SARS-CoV-2 also reduces oxidative glutamine metabolism while maintaining reductive carboxylation. Consistent with these changes, SARS-CoV-2 infection increases the activity of mTORC1 in cell lines and lung ALI cultures. Lastly, we show evidence of mTORC1 activation in COVID-19 patient lung tissue, and that mTORC1 inhibitors reduce viral replication in kidney epithelial cells and lung ALI cultures. Our results suggest that targeting mTORC1 may be a feasible treatment strategy for COVID-19 patients, although further studies are required to determine the mechanism of inhibition and potential efficacy in patients.


Conflict of interest statement

The authors declare no competing interests.

Figures

Fig. 1
Fig. 1. SARS-CoV-2 infection alters TCA cycle metabolism.
a Glutamine entry into the TCA cycle is reduced in SARS-CoV-2 infected cells. Mass isotopomer analysis of TCA cycle metabolites in mock or SARS-CoV-2 infected Vero kidney epithelial cells after 24 h incubation with U-13C-glutamine. Each isotopomer is a different color, which is defined in the figure. P values compare the total fraction labeled between mock and SARS-CoV-2 infected cells (n = 3 biologically independent samples). b The oxidative TCA cycle is decreased in SARS-CoV-2 infected (red bars) Vero cells after 24 h infection compared with mock infected (gray bars) Vero cells (n = 3 biologically independent samples). c The reductive TCA cycle is maintained in SARS-CoV-2 infected (red bars) Vero cells compared with mock infected (gray bars) Vero cells after 24 h infection (n = 3 biologically independent samples). d Levels of αKGC members OGDH and DLD are reduced in SARS-CoV-2 infected Vero cells (representative of two biological independent samples). e Glucose-derived carbon entry into the TCA cycle is increased in SARS-CoV-2 infected cells. Mass isotopomer analysis of TCA cycle metabolites in mock or SARS-CoV-2 infected Vero kidney epithelial cells after 24 h incubation with U-13C-glucose. Each isotopomer is a different color, which is defined in the figure. P values compare the total fraction labeled between mock and SARS-CoV-2 infected cells (n = 3 biologically independent samples). f Glucose-derived carbon entry into the TCA cycle using PC is increased in SARS-CoV-2 infected cells. Fraction of labeled metabolites in mock (gray bars) or SARS-CoV-2 infected (red bars) Vero cells after 24 h incubation with 3-13C-glucose (n = 3 biologically independent samples). g Levels of PDH complex members are decreased in SARS-CoV-2 infected Vero cells (representative of two biological independent samples). h Schematic of the changes in TCA cycle metabolism in SARS-CoV-2 infected cells. Glutamine entry is reduced (blue arrow) and pyruvate entry using PC is increased (red arrow). Unless indicated, data are the mean ± s.e.m. and P values were obtained by two-way ANOVA with Sidak’s multiple comparison test.
Fig. 2
Fig. 2. SARS-CoV-2 infection increases mTORC1 activity.
a mTORC1 activity is increased in SARS-CoV-2 infected Vero kidney epithelial cells. Protein was extracted from Vero cells infected with SARS-CoV-2 for 24 h and immunoblotted for the indicated proteins (representative of two biological independent samples). b mTORC1 activity is increased in ALI mucociliary cultures derived from two different donors. Protein was extracted from ALI cultures infected with SARS-CoV-2 for 72 h and immunoblotted for the indicated proteins (n = 2 biological independent samples). c pAKT and pERK are increased in SARS-CoV-2 infected NHBE ALI cultures (representative of two biological independent samples). d mTORC1 activity is increased in COVID-19 patient lungs. IHC staining of p4EBP1 and the macrophage marker CD68 on lungs from COVID-19 and non-COVID-19 patients. Images are representative of two out of five COVID-19 patient lungs and nine out of nine non-COVID-19 lungs. Red arrows indicate cells positive for p4EBP1. Scale bar 50 µM.
Fig. 3
Fig. 3. mTORC1 inhibitors reduce SARS-CoV-2 replication.
a mTORC1 inhibitors reduce SARS-CoV-2 levels in Vero kidney epithelial cells. Immunofluorescence of cells infected with SARS-CoV-2 and treated with 25 nM of the indicated non-FDA approved mTORC1 inhibitors for 72 h. Cells were stained for dsRNA (red) to show SARS-CoV-2 levels. DAPI (blue) stained the nuclei of the Vero cells (n = 3 biologically independent samples). b The FDA-approved mTORC1 inhibitor rapamycin reduces SARS-CoV-2 levels in NHBE ALI mucociliary cultures. Immunofluorescence of cells infected with SARS-CoV-2 and treated with 1 µM rapamycin for 48 h. Cells were stained with an anti-SARS coronavirus antibody (green) to show SARS-CoV-2 levels. DAPI (blue) stained the nuclei of the mucociliary cells (n = 3 biologically independent samples). c FDA-approved mTORC1 inhibitors reduce SARS-CoV-2 protein expression. NHBE ALI cultures were infected with SARS-CoV-2 and treated with 1 µM rapamycin. Protein was extracted after 48 h and immunoblotted with an anti-SARS coronavirus antibody to determine SARS-CoV-2 protein expression. Multiple exposures of SARS-CoV-2 antibody are shown (representative of three biological independent samples). d FDA-approved mTORC1 inhibitors reduce SARS-CoV-2 gene expression. NHBE ALI cultures were infected with SARS-CoV-2 (red bar) and treated with 1 µM rapamycin (gray bar). RNA was extracted after 48 h and SARS-CoV-2 N gene expression quantified relative to RPLP0 using qPCR. Data are normalized to SARS-CoV-2 solvent cells (n = 3 biologically independent samples. Data are mean ± s.e.m. and P values were obtained by one-way ANOVA with Tukey’s multiple comparison’s test). Scale bar 30 µM.

Similar articles

Cited by

References

    1. Thaker SK, Ch’ng J, Christofk HR. Viral highjacking of cellular metabolism. BMC Biol. 2019;17:59. doi: 10.1186/s12915-019-0678-9. - DOI - PMC - PubMed
    1. DeVito SR, Ortiz-Riaño E, Martínez-Sobrido L, Munger J. Cytomegalovirus-mediated activation of pyrimidine biosynthesis drives UDP-sugar synthesis to support viral protein glycosylation. Proc. Natl Acad. Sci. USA. 2014;111:18019–18024. doi: 10.1073/pnas.1415864111. - DOI - PMC - PubMed
    1. Vastag L, Koyuncu E, Grady SL, Shenk TE, Rabinowitz JD. Divergent effects of human cytomegalovirus and herpes simplex virus-1 on cellular metabolism. PLoS Pathog. 2011;7:e1002124. doi: 10.1371/journal.ppat.1002124. - DOI - PMC - PubMed
    1. Thaker SK, et al. Differential metabolic reprogramming by Zika virus promotes cell death in human versus mosquito cells. Cell Metab. 2019;29:1–11. doi: 10.1016/j.cmet.2019.01.024. - DOI - PMC - PubMed
    1. Thai M, et al. Adenovirus E4ORF1-induced MYC activation promotes host cell anabolic glucose metabolism and virus replication. Cell Metab. 2014;19:694–701. doi: 10.1016/j.cmet.2014.03.009. - DOI - PMC - PubMed

Publication types

MeSH terms