. 2021 Mar 25;12(1):1861.
doi: 10.1038/s41467-021-22140-0.

Whole-genome sequencing reveals progressive versus stable myeloma precursor conditions as two distinct entities

Affiliations

Whole-genome sequencing reveals progressive versus stable myeloma precursor conditions as two distinct entities

Bénedith Oben et al. Nat Commun. .

Abstract

Multiple myeloma (MM) is consistently preceded by precursor conditions recognized clinically as monoclonal gammopathy of undetermined significance (MGUS) or smoldering myeloma (SMM). We interrogate the whole genome sequence (WGS) profile of 18 MGUS and compare them with those from 14 SMMs and 80 MMs. We show that cases with a non-progressing, clinically stable myeloma precursor condition (n = 15) are characterized by later initiation in the patient's life and by the absence of myeloma defining genomic events including: chromothripsis, templated insertions, mutations in driver genes, aneuploidy, and canonical APOBEC mutational activity. This data provides evidence that WGS can be used to recognize two biologically and clinically distinct myeloma precursor entities that are either progressive or stable.


Conflict of interest statement

The authors declare no competing interest.

Figures

Fig. 1
Fig. 1. Summary of all patients with myeloma precursor condition included in the study.
a A cartoon summarizing the low-input whole-genome sequencing approach. b Follow up time for all patients with myeloma precursor condition included in the study. Purple and blue lines and dots reflect patients that progressed to multiple myeloma (MM; N = 17) and hadn’t had progression (N = 15) at the time of study, respectively. c Comparison of bone marrow plasma cell infiltration between stable and progressive myeloma precursor condition. p value was generated using Wilcoxon rank-sum test. Boxplots show the median and interquartile range. d Correlation between bone marrow plasma cell (BMPC) infiltration and single nucleotide variants (SNV) burden in myeloma precursor condition. p value and R2 were estimated using lm R function (linear regression). MGUS: monoclonal gammopathy of undetermined significance, SMM: smoldering multiple myeloma, SD: stable, PD: progressive.
Fig. 2
Fig. 2. Mutational signature landscape of multiple myeloma (MM) and myeloma precursor condition.
a Mutational signature contribution across all WGS samples included in the study. PD47563 is a patient with stable myeloma precursor condition with two samples collected at different time points, both reported in this plot (i.e., PD47563a and PD47563c). b Comparison of APOBEC mutational contribution (SBS2 + SBS13) between MM (N = 80), progressive (N = 17), and stable myeloma (N = 15) precursors. p values were calculated using Wilcoxon rank-sum test. Boxplots show the median and interquartile range. c APOBEC3A:3B ratio of all patients included in the study having detectable APOBEC activity. Blue, purple, and brown dots represent stable, progressive myeloma precursors, and MM, respectively. The green and yellow boxes on the x-axis reflect cases with and without translocations involving MAF/MAFB, respectively. MM: multiple myeloma, MGUS: monoclonal gammopathy of undetermined significance, SMM: smoldering multiple myeloma, SD: stable, PD: progressive, SBS: single-base substitution.
Fig. 3
Fig. 3. Mutations in myeloma driver genes.
a, b Prevalence and distribution of nonsynonymous mutations in driver genes (N = 80) across stable (blue; N = 15) and progressive (purple; N = 17) myeloma precursor condition and multiple myeloma (brown). In (b) red: mutated; Gray: wild type. p values were calculated using Wilcoxon rank-sum test. Boxplots show the median and interquartile range. c Proportion of cases with at least one significant known hotspot mutation (brown) within myeloma driver genes in stable and progressive myeloma precursor condition and multiple myeloma (MM). d Proportion of mutations in driver genes involving known AID targets (light green) in stable and progressive myeloma precursor condition and MM. MGUS: monoclonal gammopathy of undetermined significance, SMM: smoldering multiple myeloma, SD: stable, PD: progressive, WGS: whole-genome sequencing, WXS: whole exome sequencing. Asterisks in (c, d) indicate a p < 0.01 under Fisher’s exact test.
Fig. 4
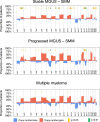
Fig. 4. Copy number profile of myeloma precursor condition and multiple myeloma (MM).
Cumulative copy number profile of all patients with either WGS or SNP array data available. Cases were grouped according to their clinical stage: stable (N = 81) and progressive (N = 19) myeloma precursor condition and MM (N = 228). Red and blue bars reflect chromosomal gain and loss, respectively. Yellow and green lines on the top of each graph represent GISTIC peaks with a significantly different prevalence across the three stages (yellow: Fisher’s exact test p < 0.05 and green: q < 0.1). On the first, second and third cumulative plots we reported the significant difference between: stable myeloma precursor condition vs. MM, stable myeloma precursor condition vs. progressive myeloma precursor condition and progressive myeloma precursor condition vs. MM, respectively. MGUS: monoclonal gammopathy of undetermined significance, SMM: smoldering multiple myeloma, chr: chromosome.
Fig. 5
Fig. 5. Landscape of structural variants (SV) in multiple myeloma (MM) and myeloma precursor condition.
a Prevalence of single and complex SV events across all cases included in this study. PD47563 is a patient with stable myeloma precursor condition with two samples collected at different time points, both reported in this plot (i.e., PD47563a and PD47563c). Blue, purple, and brown x-axis labels represent stable, progressive myeloma precursors and MM respectively. Ins: insertion, TRA: translocation. b Genome-wide density of SV breakpoints across stable, progressive myeloma precursors, and MM. Each patient genome was divided in bins of 1 Mb and, in case of presence of multiple SV breakpoints, only one breakpoint was counted. c Prevalence of 69 known SV hotspots across stable and progressive myeloma precursors, and MM. MGUS: monoclonal gammopathy of undetermined significance, SMM: smoldering multiple myeloma, SD: stable, PD: progressive, in the heatmap Red: mutated; Gray: wild type.
Fig. 6
Fig. 6. Timing the acquisition of the first multi-gain event in multiple myeloma (MM) and myeloma precursor conditions.
a Comparison of the patients’ age at the time of sample collection between stable (N = 15), progressive (N = 17) myeloma precursors and MM (N = 80). p values were calculated using the Wilcoxon rank-sum test. b Estimated patient age at the first multi-gain events with 95% confidence of intervals. Blue, purple and brown dots and lines represent stable (N = 7), progressive (N = 11) myeloma precursors, and MM (N = 22) respectively. Gray boxes reflect the sample collection time. c Comparison of estimated patient age at the first multi-gain events between stable, progressive myeloma precursors and MM. p values were calculated using the Wilcoxon rank-sum test. For (a, c) boxplots show the median and interquartile range. MGUS: monoclonal gammopathy of undetermined significance, SMM: smoldering multiple myeloma, SD: stable, PD: progressive.

Similar articles

Cited by

References

    1. Landgren O, Weiss BM. Patterns of monoclonal gammopathy of undetermined significance and multiple myeloma in various ethnic/racial groups: support for genetic factors in pathogenesis. Leukemia. 2009;23:1691–1697. doi: 10.1038/leu.2009.134. - DOI - PubMed
    1. Kyle RA, et al. Long-term follow-up of monoclonal gammopathy of undetermined significance. N. Engl. J. Med. 2018;378:241–249. doi: 10.1056/NEJMoa1709974. - DOI - PMC - PubMed
    1. Kyle RA, et al. Clinical course and prognosis of smoldering (asymptomatic) multiple myeloma. N. Engl. J. Med. 2007;356:2582–2590. doi: 10.1056/NEJMoa070389. - DOI - PubMed
    1. Kyle RA, et al. Prevalence of monoclonal gammopathy of undetermined significance. N. Engl. J. Med. 2006;354:1362–1369. doi: 10.1056/NEJMoa054494. - DOI - PubMed
    1. Maura, F. et al. Moving from cancer burden to cancer genomics for smoldering myeloma: a review. JAMA Oncol.6, 425–432 (2020). - PMC - PubMed

Publication types

MeSH terms