. 2021 Mar 25;11(1):6827.
doi: 10.1038/s41598-021-86289-w.

Tunneling-induced Talbot effect

Affiliations

Tunneling-induced Talbot effect

Babak Azizi et al. Sci Rep. .

Abstract

We investigate the reforming of a plane wave into a periodic waveform in its propagation through a structural asymmetry four-level quantum dot molecule (QDM) system that is induced by an inter-dot tunneling process and present the resulting tunneling-induced Talbot effect. The tunneling process between two neighborhood dots is provided with the aid of a gate voltage. Using a periodic coupling field the response of the medium to the propagating plane probe beam becomes periodic. The needed periodic coupling field is generated with the interference of two coherent plane waves having a small angle and propagating almost parallel to the probe beam direction. In the presence of the tunneling effect of an electron between two adjacent QDs, for the probe beam propagating through the QDM system, the medium becomes transparent where the coupling fields interfere constructively. As a result, the spatial periodicity of the coupling field modulates the passing plane probe beam. We determine the minimum length of the QDM system to generate a periodic intensity profile with a visibility value equal to 1 for the probe field at the exit plane of the medium. It is also shown that by increasing the propagation length of the probe beam through the QDM medium, the profile of the maximum intensity areas becomes sharper. This feature is quantified by considering a sharpness factor for the intensity profile of the probe beam at the transverse plane. Finally, we investigate free space propagation of the induced periodic field and present the Talbot images of the tunneling-induced periodic patterns at different propagation distances for different values of the QDM medium lengths. The presented dynamically designing method of the periodic coherent intensity patterns might find applications in science and technology. For instance, in optical lithography, the need to use micro/nanofabricated physical transmission diffraction gratings, in which preparation of them is expensive and time-consuming, can be eliminated.


Conflict of interest statement

The authors declare no competing interests.

Figures

Figure 1
Figure 1
The energy levels of the QDM system before (a) and after (b) applying the external voltage. (c) The energy diagram of the four-level ladder type QDM system and two applied laser fields. The electron and hole are shown by and , respectively.
Figure 2
Figure 2
A possible arrangement of the QDM system including the input probe field with the plane wavefront, standing coupling field, the output probe field profile and its image patterns.
Figure 3
Figure 3
Imaginary part of ρ21 as a function of Δp/Γ. Used parameters are Γ2=Γ4=Γ, Ωp=0.1Γ, Ωc=0.5Γ, and Δc=0.
Figure 4
Figure 4
The propagation of the probe field amplitude inside the QDM medium, |Ep(x,z)/Ep(0)|, and outside it, |ψp(X,Z)/Ep(0)|, in the absence of the tunneling effect, Te=0. Used parameters are Ωc0=0.5Γ, d=10μm, λp=870 nm, and L=6.9μm under the multi-photon resonance condition, Δp=Δc=0.
Figure 5
Figure 5
The propagation of the probe field amplitude inside the QDM medium, |Ep(x,z)/Ep(0)|, and outside it, |ψp(X,Z)/Ep(0)|, for the maximum value of the tunneling parameter, Te=Γ. Other used parameters are the same as in Fig. 4.
Figure 6
Figure 6
The visibility of the induced periodic waveform as a function of (a) medium length (for Te=Γ and Ωc0=0.5Γ), (b) tunneling parameter (for L=2.5μm and Ωc0=0.5Γ), and (c) strength of the coupling field (for Te=Γ and L=2.5μm).
Figure 7
Figure 7
The finesse of fringes of the induced periodic waveform versus (a) medium length (for Te=Γ and Ωc0=0.5Γ), (b) tunneling parameter (for L=2.5μm and Ωc0=0.5Γ), and (c) strength of the coupling field (for Te=Γ and L=2.5μm).
Figure 8
Figure 8
The visibility of the intensity profile of the quarter Talbot plane as a function of (a) medium length (for Ωc0=0.3Γ and Te=Γ (solid curve), Ωc0=0.5Γ and Te=Γ (dashed curve), and Ωc0=0.5Γ and Te=0.5Γ (dash-dotted curve)), (b) tunneling parameter (for Ωc0=0.3Γ and L=2.5μm (solid curve), Ωc0=0.5Γ and L=2.5μm (dashed curve), and Ωc0=0.5Γ and L=7.5μm (dash-dotted curve)), and (c) strength of the coupling field (for L=2.5μm and Te=Γ (solid curve), L=7.5μm and Te=Γ (dashed curve), and L=7.5μm and Te=0.5Γ (dash-dotted curve)). Other used parameters are the same as in Fig. 4.
Figure 9
Figure 9
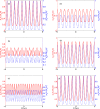
The profiles of (a) the output probe field at z=L and its diffracted field at (b) Z=ZT/5, (c) Z=ZT/4, (d) Z=3ZT/8, (e) Z=9ZT/20, and (f) Z=ZT/2. Solid (dashed) curves with the left (right) vertical axis demonstrate the amplitude (intensity) of the field in all panels. The selected set of parameters are Ωc0=0.5Γ, L=2.5μm, and Te=Γ. The other used parameters are the same as in Fig. 4.
Figure 10
Figure 10
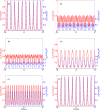
The profiles of (a) the output probe field at z=L and its diffracted field at (b) Z=ZT/5, (c) Z=ZT/4, (d) Z=3ZT/8, (e) Z=9ZT/20, and (f) Z=ZT/2 under the same parameters of Fig. 9 except for Te=0.5Γ. Solid (dashed) curves with the left (right) vertical axis demonstrate the amplitude (intensity) of the field in all panels.
Figure 11
Figure 11
The propagation of the probe field amplitude inside the QDM medium, |Ep(x,z)/Ep(0)|, and outside it, |ψp(X,Z)/Ep(0)|, for different lengths of the QDM medium, i.e. (a) L=2.5μm, (b) L=5.25μm, and (c) L=10.5μm. The tunneling parameter is fixed at Te=Γ, whereas other parameter values are the same as in Fig. 4.
Figure 12
Figure 12
The propagation of the probe field amplitude inside the QDM medium, |Ep(x,z)/Ep(0)|, and outside it, |ψp(X,Z)/Ep(0)|, for Te=0.5Γ and different lengths of the QDM medium, i.e. (a) L=1μm, (b) L=2μm, and (c) L=4.25μm. Other used parameters are the same as in Fig. 4.

Similar articles

Cited by

References

    1. Rayleigh L. On copying diffraction-gratings, and on some phenomena connected therewith. Philos. Mag. 1881;11:196–205. doi: 10.1080/14786448108626995. - DOI
    1. Talbot HF. Facts relating to optical science No. IV. Philos. Mag. 1836;9:401–407.
    1. Patorski K. The self-imaging phenomenon and its applications. Prog. Opt. 1989;27:1–108. doi: 10.1016/S0079-6638(08)70084-2. - DOI
    1. Lohmann AW, Thomas JA. Making an array illuminator based on the Talbot effect. Appl. Opt. 1990;29:4337–4340. doi: 10.1364/AO.29.004337. - DOI - PubMed
    1. Rasouli S, Tavassoly MT. Application of the moiré deflectometry on divergent laser beam to the measurement of the angle of arrival fluctuations and the refractive index structure constant in the turbulent atmosphere. Opt. Lett. 2008;33:980–982. doi: 10.1364/OL.33.000980. - DOI - PubMed