IL-1β mediated nanoscale surface clustering of integrin α5β1 regulates the adhesion of mesenchymal stem cells
- PMID: 33767269
- PMCID: PMC7994456
- DOI: 10.1038/s41598-021-86315-x
IL-1β mediated nanoscale surface clustering of integrin α5β1 regulates the adhesion of mesenchymal stem cells
Abstract
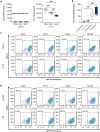
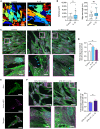
Clinical use of human mesenchymal stem cells (hMSCs) is limited due to their rapid clearance, reducing their therapeutic efficacy. The inflammatory cytokine IL-1β activates hMSCs and is known to enhance their engraftment. Consequently, understanding the molecular mechanism of this inflammation-triggered adhesion is of great clinical interest to improving hMSC retention at sites of tissue damage. Integrins are cell-matrix adhesion receptors, and clustering of integrins at the nanoscale underlies cell adhesion. Here, we found that IL-1β enhances adhesion of hMSCs via increased focal adhesion contacts in an α5β1 integrin-specific manner. Further, through quantitative super-resolution imaging we elucidated that IL-1β specifically increases nanoscale integrin α5β1 availability and clustering at the plasma membrane, whilst conserving cluster area. Taken together, these results demonstrate that hMSC adhesion via IL-1β stimulation is partly regulated through integrin α5β1 spatial organization at the cell surface. These results provide new insight into integrin clustering in inflammation and provide a rational basis for design of therapies directed at improving hMSC engraftment.
Conflict of interest statement
The authors declare no competing interests.
Figures


Similar articles
-
IL-1β promotes transendothelial migration of PBMCs by upregulation of the FN/α5β1 signalling pathway in immortalised human brain microvascular endothelial cells.Exp Cell Res. 2018 Dec 15;373(1-2):99-111. doi: 10.1016/j.yexcr.2018.10.002. Epub 2018 Oct 19. Exp Cell Res. 2018. PMID: 30342992
-
Mesenchymal stem cell migration is regulated by fibronectin through α5β1-integrin-mediated activation of PDGFR-β and potentiation of growth factor signals.J Cell Sci. 2011 Apr 15;124(Pt 8):1288-300. doi: 10.1242/jcs.076935. Epub 2011 Mar 23. J Cell Sci. 2011. PMID: 21429937 Free PMC article.
-
Fibronectin-mediated upregulation of α5β1 integrin and cell adhesion during differentiation of mouse embryonic stem cells.Cell Adh Migr. 2011 Jan-Feb;5(1):73-82. doi: 10.4161/cam.5.1.13704. Epub 2011 Jan 1. Cell Adh Migr. 2011. PMID: 20962574 Free PMC article.
-
Binding of ZO-1 to α5β1 integrins regulates the mechanical properties of α5β1-fibronectin links.Mol Biol Cell. 2017 Jul 7;28(14):1847-1852. doi: 10.1091/mbc.E17-01-0006. Epub 2017 Mar 1. Mol Biol Cell. 2017. PMID: 28251923 Free PMC article.
-
Deletion of mouse embryo fibroblast N-acetylglucosaminyltransferase V stimulates alpha5beta1 integrin expression mediated by the protein kinase C signaling pathway.J Biol Chem. 2005 Mar 4;280(9):8332-42. doi: 10.1074/jbc.M413532200. Epub 2004 Dec 22. J Biol Chem. 2005. PMID: 15615721
Cited by
-
Knockout of integrin β1 in induced pluripotent stem cells accelerates skin-wound healing by promoting cell migration in extracellular matrix.Stem Cell Res Ther. 2022 Jul 30;13(1):389. doi: 10.1186/s13287-022-03085-7. Stem Cell Res Ther. 2022. PMID: 35908001 Free PMC article.
-
Noncanonical functions of adhesion proteins in inflammation.Am J Physiol Cell Physiol. 2024 Sep 1;327(3):C505-C515. doi: 10.1152/ajpcell.00292.2024. Epub 2024 Jul 9. Am J Physiol Cell Physiol. 2024. PMID: 38981610 Free PMC article. Review.
-
Adipose-Derived Stromal Cells Exposed to RGD Motifs Enter an Angiogenic Stage Regulating Endothelial Cells.Int J Mol Sci. 2025 Jan 21;26(3):867. doi: 10.3390/ijms26030867. Int J Mol Sci. 2025. PMID: 39940638 Free PMC article.
-
Engineering mesenchymal stem cells for premature ovarian failure: overcoming challenges and innovating therapeutic strategies.Theranostics. 2024 Oct 7;14(17):6487-6515. doi: 10.7150/thno.102641. eCollection 2024. Theranostics. 2024. PMID: 39479455 Free PMC article. Review.
-
IL-13 and IL-17A Activate β1 Integrin through an NF-kB/Rho kinase/PIP5K1γ pathway to Enhance Force Transmission in Airway Smooth Muscle.bioRxiv [Preprint]. 2024 May 1:2024.05.01.592042. doi: 10.1101/2024.05.01.592042. bioRxiv. 2024. Update in: Proc Natl Acad Sci U S A. 2024 Aug 20;121(34):e2401251121. doi: 10.1073/pnas.2401251121. PMID: 38746410 Free PMC article. Updated. Preprint.
References
-
- Zhao Q, Ren H, Han Z. Mesenchymal stem cells: immunomodulatory capability and clinical potential in immune diseases. J. Cell. Immunother. 2016;2:3–20. doi: 10.1016/j.jocit.2014.12.001. - DOI
Publication types
MeSH terms
Substances
Grants and funding
- BB/L015129/1/BB_/Biotechnology and Biological Sciences Research Council/United Kingdom
- BB/D020875/1/BB_/Biotechnology and Biological Sciences Research Council/United Kingdom
- BB/M022080/1/BB_/Biotechnology and Biological Sciences Research Council/United Kingdom
- WT_/Wellcome Trust/United Kingdom
- 098411/Z/12/Z/WT_/Wellcome Trust/United Kingdom
LinkOut - more resources
Full Text Sources
Other Literature Sources

