. 2021 Mar 25;11(1):6887.
doi: 10.1038/s41598-021-86236-9.

Audiotactile interactions in the mouse cochlear nucleus

Affiliations

Audiotactile interactions in the mouse cochlear nucleus

Josephine Ansorge et al. Sci Rep. .

Abstract

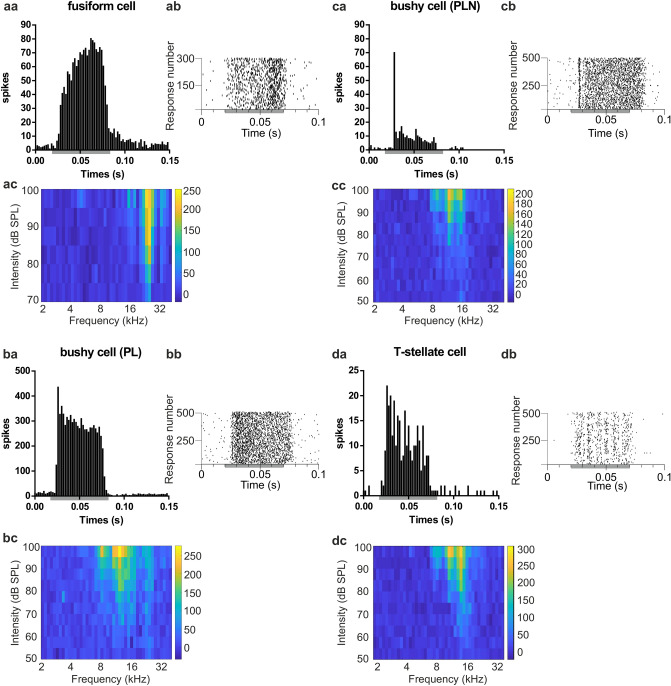
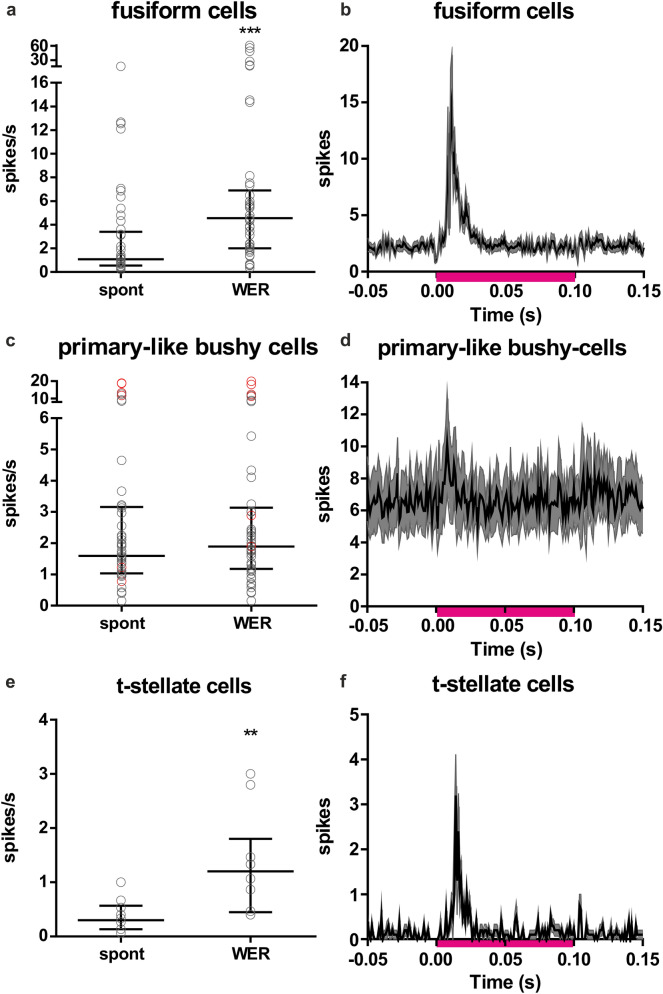
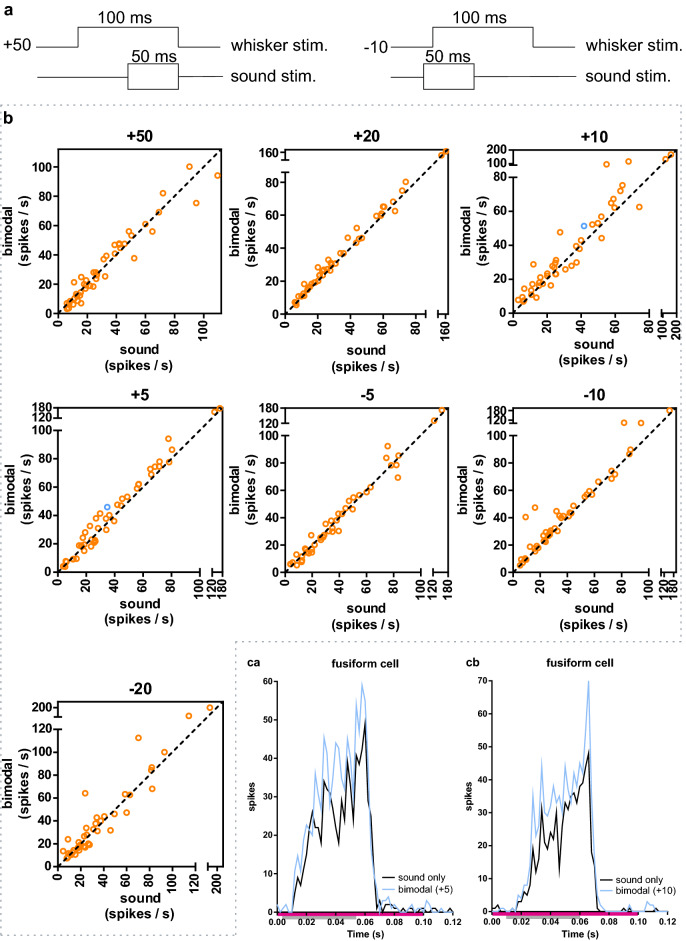
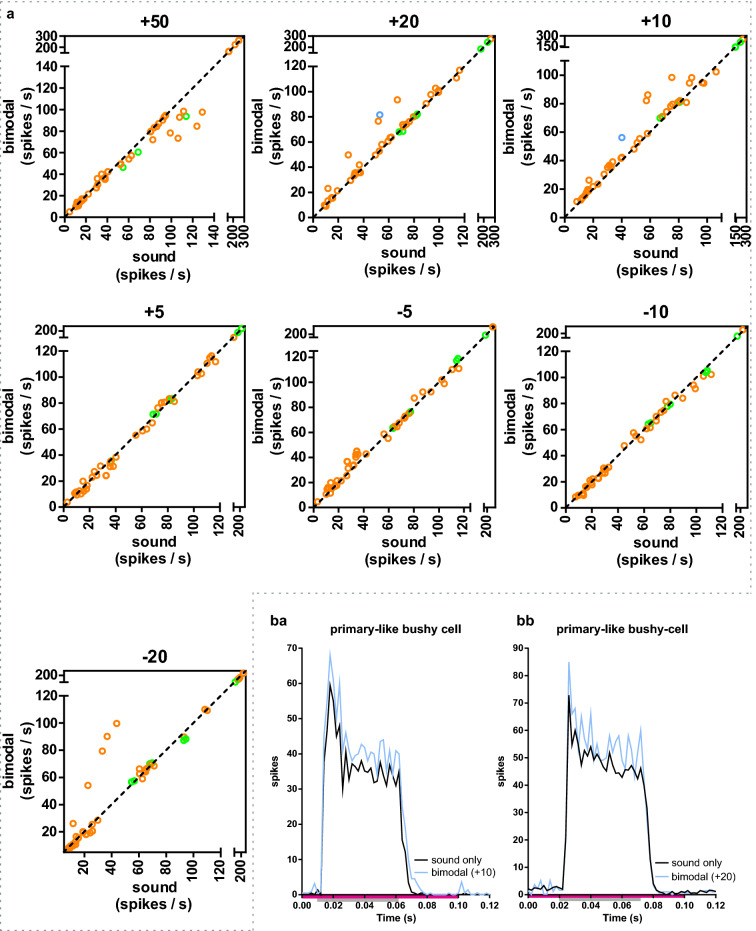
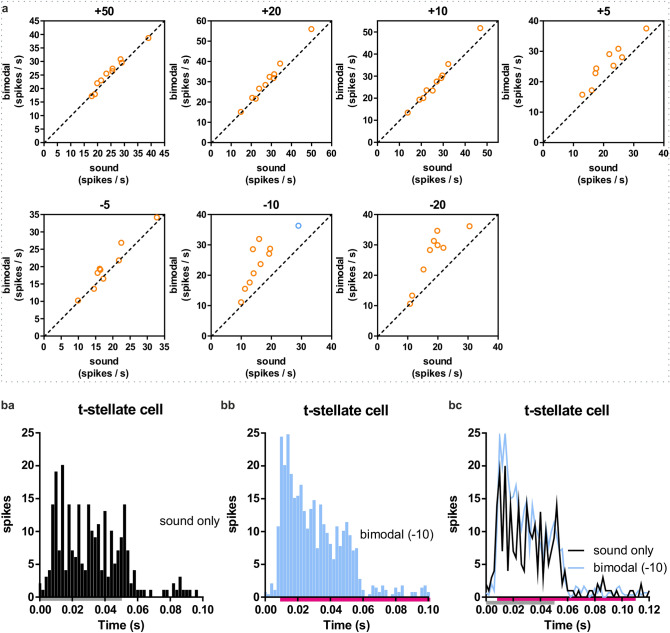
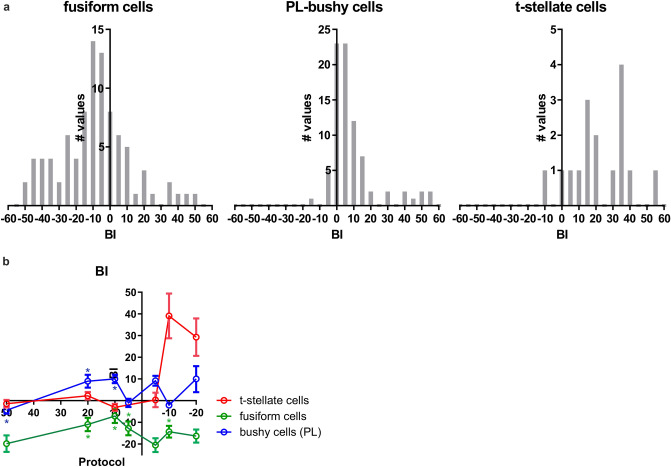
Multisensory integration of auditory and tactile information occurs already at the level of the cochlear nucleus. Rodents use their whiskers for tactile perception to guide them in their exploration of the world. As nocturnal animals with relatively poor vision, audiotactile interactions are of great importance for this species. Here, the influence of whisker deflections on sound-evoked spiking in the cochlear nucleus was investigated in vivo in anesthetized mice. Multichannel, silicon-probe electrophysiological recordings were obtained from both the dorsal and ventral cochlear nucleus. Whisker deflections evoked an increased spiking activity in fusiform cells of the dorsal cochlear nucleus and t-stellate cells in ventral cochlear nucleus, whereas bushy cells in the ventral cochlear nucleus showed a more variable response. The response to broadband noise stimulation increased in fusiform cells and primary-like bushy cells when the sound stimulation was preceded (~ 20 ms) by whisker stimulation. Multi-sensory integration of auditory and whisker input can thus occur already in this early brainstem nucleus, emphasizing the importance of early integration of auditory and somatosensory information.


Conflict of interest statement

The authors declare no competing interests.

Figures

Figure 1
Figure 1
Cell classification. The neurons recorded in the cochlear nucleus were classified based on their characteristic response profile. (aa) Post-stimulus time histogram (PSTH, 2 ms bin, 300 sweeps) of a spike-sorted unit from a fusiform cell in DCN recorded during best-frequency tone stimulation (24,261 Hz) at 20 dB above threshold. The PSTH shows the characteristic build-up response. (ab) Raster plot of the fusiform cell from aa. (ac) Receptive field (frequency intensity response pattern; colour code is spike rate in 50 ms from 10 sweeps) for the same fusiform cell. (ba) PSTH (2 ms bin, 500 sweeps) of a spike-sorted unit from a primary-like bushy cell (PL) in VCN recorded during best-frequency tone stimulation (12,130 Hz). (bb) Raster plot of the primary-like bushy cell from ba. (bc) Receptive field (colour code is spike rate in 50 ms from 10 sweeps) for the primary-like bushy cell in ba. (ca) PSTH (2 ms bin, 500 sweeps) of a spike-sorted unit from a primary-like-with-notch bushy cell (PLN) in VCN, recorded during best-frequency tone stimulation (10,560 Hz). (cb) Raster plot of the PLN bushy cell from ca. (cc) Receptive field of the primary-like bushy cell with notch. (da) PSTH (2 ms bin, 500 sweeps) of a spike-sorted unit from a t-stellate cell in VCN, recorded during best-frequency tone stimulation (14,934 Hz). (db) Raster plot of the spike-sorted t-stellate cell from da. (dc) Receptive field (colour code is spike rate in 50 ms from 10 sweeps) for the t-stellate cell. In the panels showing PSTH and raster plots, the grey bar is the 50 ms tone stimulation.
Figure 2
Figure 2
Whisker-evoked responses in fusiform cells, primary-like bushy cells and t-stellate cells. (a) Spontaneous spiking (spont) and the whisker-evoked response (WER) in fusiform cells. Whisker deflections increased median spiking in fusiform cells from 1.09 spikes/s to 4.56 spikes/s with whisker stimulation (n = 45; p < 0.0001, Wilcoxon matched pairs signed rank test). (b) The averaged PSTHs (1 ms bins) of all recorded fusiform cells. The sum of 1000 whisker-evoked stimulations were calculated for each cell, and then the average from these sums was calculated and plotted with a SEM confidence band. (c) Spontaneous spiking (spont) and the whisker-evoked response (WER) in bushy cells. Black circles are primary-like bushy cells (PL) and red circles are primary-like-with-notch bushy cells (PLN). Whisker deflections did not significantly change the median spiking activity (spont. 1.59 spikes/s; whisker stimulation 1.89 spikes/s; p = 0.1005, Wilcoxon matched-pairs signed rank). (d) The averaged PSTHs (1 ms bins) of all recorded primary-like bushy cells (PL and PLN). The sum of 1000 stimulations were calculated for each cell, and then the average from these sums was calculated and plotted with SEM confidence band. (e) Spontaneous spiking (spont) and the whisker-evoked response (WER) of t-stellate cells (n = 10). Whisker deflections increased spiking from 0.30 spikes/s to 1.20 spikes/s (n = 10; p = 0.0020, Wilcoxon matched-pairs signed rank test). (f) The averaged PSTHs (1 ms bins) of all recorded t-stellate cells. The sum of 1000 stimulations were calculated for each cell, and then the average from these sums was calculated and plotted with a SEM confidence band. In panels b, d & f the pink bar shows the time of whisker stimulation (0 to 0.10 s). In panels a, c & e the error bar indicates the median and the inter-quartile range (IQR).
Figure 3
Figure 3
Bimodal responses in fusiform cells. (a) Two schematic examples of how the different stimulation protocols were performed. Left: A 100 ms whisker stimulation starting 50 ms before (“ + 50”) the onset of a 50 ms sound (broadband noise) stimulation. Right: A 100 ms whisker stimulation starting 10 ms after (“−10”) the onset of a 50 ms sound stimulation. (b) Bimodal (whisker and sound) response compared to only sound stimulation. Each protocol (+ 50, + 20 + etc.; see Methods) is plotted separately and each spike-sorted unit is represented with a circle. The dotted line represents a linear regression line with slope 1 (y = x). The bimodal + 20, + 10, + 5 and − 5 protocols evoked a larger response compared to only sound stimulation. See Table 1 for numbers and statistics. Blue circles (one in the + 5 and one in the +10  plot) are for the example cells in ca-cb. (ca) Example PSTH for a fusiform cell showing the response to only sound compared to the + 5 bimodal protocol. The bimodal response is increased compared to the only sound response. Pink bar shows the time of whisker stimulation (from 0 to 0.1 s); the grey bar marks the duration of the sound stimulation (from 0.005 to 0.055 s; sum of 500 stimulations each for sound and bimodal). (cb) Example PSTH for a fusiform cell showing the response to only sound compared to the + 10 bimodal protocol. The bimodal response is increased compared to the only sound response. Pink bar shows the time of whisker stimulation (from 0 to 0.1 s); the grey bar marks the duration of the sound stimulation (from 0.01 to 0.06 s; sum of 500 stimulations each for sound and bimodal).
Figure 4
Figure 4
Bimodal response in bushy cells. (a) Bimodal stimulation compared to sound stimulation. Each protocol (+ 50, + 2 + etc.) is plotted separately and each spike-sorted unit is represented with a circle (PL: n = 42; PLN: n = 7). The dotted line represents a linear regression line with slope 1 (y = x). Orange circles (n = 42) are primary-like bushy cells and green circles (n = 7) are primary-like-with-notch bushy cells (PLNs). In PL cells the bimodal + 20 & + 10 stimulation protocols evoked a larger response compared to only sound (Table 2). Blue circles are the example cells from ba-bb. 5 PL bushy cells showed an increase of the bimodal response compared to the sound only stimulation with the − 20 protocol. (ba) PSTH for a primary-like bushy cell for the protocol + 10. The bimodal response is increased compared to the only sound response. Pink bar shows the time of whisker stimulation (from 0 to 0.10 s); the grey bar marks the duration of the sound stimulation (from 0.01 to 0.06 s; sum of 500 stimulations each for sound and bimodal). (bb) PSTH for a primary-like bushy cell for the protocol + 20. The bimodal response is increased compared to the only sound response. Pink bar shows the time of whisker stimulation (from 0 to 0.20 s); the grey bar marks the duration of the sound stimulation (from 0.02 to 0.07 s; sum of 500 stimulations each for sound and bimodal).
Figure 5
Figure 5
Bimodal response in t-stellate cells in VCN. (a) Bimodal compared to only sound stimulation. Each of the protocols (+ 50, + 20 etc.) plotted separately. Each dot is one spike-sorted unit. The dotted line represents a linear regression line with slope 1 (y = x). Blue circle is the example cells from ba-bc. (ba-bc) The PSTH of a representative cell is plotted for the − 10 protocol (blue dot in the panel “−10”). (ba) The PSTH for only sound. (bb) The PSTH for the bimodal stimulation. (bc) The overlay of the PSTHs from ba and bb. The grey bar shows the duration of the sound stimulation and the pink bar the duration of whisker stimulation. Sum of 500 stimulations each for sound and bimodal.
Figure 6
Figure 6
Bimodal integration index. (a) Histograms of the BI (bimodal integration index) for bimodal protocols where the spiking was increased compared to only sound stimulation. In fusiform cells, and primary-like bushy cells the BIs for the + 20 & + 10 protocols are plotted. For the t-stellate cells the − 20 and − 10 protocols. Two values for each cell, one for each of the two protocols. (For the t-stellate plot, four values with a BI > 60 are not included in the plot.) (b) The BI (mean ± SD) for all recorded protocols in fusiform cells, primary-like bushy cells and t-stellate cells. * in the corresponding colour mark the protocols where there was a significant difference in spiking activity between bimodal and sound stimulation.

References

    1. Young ED, Oertel D. The synaptic organization of the brain. Oxford: Oxford University Press; 2004.
    1. Basura GJ, Koehler SD, Shore SE. Multi-sensory integration in brainstem and auditory cortex. Brain Res. 2012;1485:95–107. doi: 10.1016/j.brainres.2012.08.037. - DOI - PMC - PubMed
    1. Wu C, Stefanescu RA, Martel DT, Shore SE. Listening to another sense: somatosensory integration in the auditory system. Cell Tissue Res. 2015;361:233–250. doi: 10.1007/s00441-014-2074-7. - DOI - PMC - PubMed
    1. Burian M, Gstoettner W. Projection of primary vestibular afferent fibres to the cochlear nucleus in the guinea pig. Neurosci. Lett. 1988;84:13–17. doi: 10.1016/0304-3940(88)90329-1. - DOI - PubMed
    1. Shore SE, Moore JK. Sources of input to the cochlear granule cell region in the guinea pig. Hear Res. 1998;116:33–42. doi: 10.1016/s0378-5955(97)00207-4. - DOI - PubMed